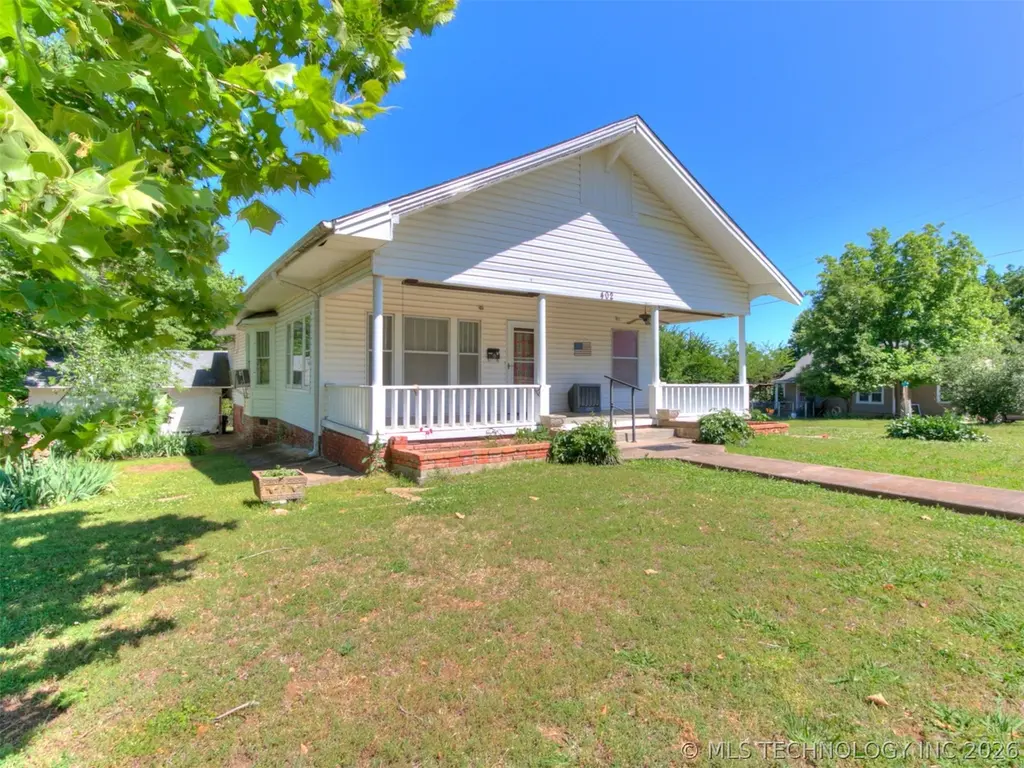
402 N Cimarron Ave · Drumright, OK
Flood risk 1/10 · Minimal
- FEMA flood zone
- X (unshaded)
- Chance of flooding over 30 yrs
- 0.0%
- Est. flood insurance / yr
- $507 – $1,088
Fire risk 8/10 · Major
- Est. fire insurance / yr
- $2,463 – $4,575
Heat risk 6/10 · Moderate
- Hot days now (above 110°F)
- 7 days/yr
- Hot days in 30 yrs
- 19 days/yr
Wind risk 3/10 · Minor
- Chance of severe wind over 30 yrs
- 4.0%
Air-quality risk 2/10 · Minimal
- Unhealthy air days now
- 1 days/yr
- Unhealthy air days in 30 yrs
- 1 days/yr
Risk factors via First Street. Map © Google.
Why this score? — see what drove the B grade
The composite is a weighted blend of 9 inputs, each scored 0–100. Each bar is that input's sub-score; the figure is the points it added to the 100-point composite (weight × sub-score).
- Cash flow +27.2/30.0
- ARV discount +12.6/15.0
- DSCR +9.5/10.0
- 1% rule +6.2/10.0
- Appreciation +5.6/10.0
- Livability +3.3/5.0
- Rent growth +2.5/5.0
- Condition / age +2.5/5.0
- Schools +2.3/10.0
$115,000
🖨 Deal sheet 📄 Offer letter ✓ Due diligence
Listing remarks
Located in the heart of Drumright on a generous yet quiet corner lot. Currently offers 3 bedrooms and 2 bathrooms, bonus room and a formal living area on the main level. Walkout basement plumbed with shower and gas hookup available. Detached garage with large workshop area and extra storage buildings. Ready for the love or vision of its new owners! Professional photos to be updated when available. Offered in "as-Is" Condition.
Key facts
- Walkout basement
- Corner lot
- Detached garage
Tags
Property features AI
Finance
- HOA & community: Gutters noted as a community feature
Exterior
- Parking: Detached garage with workshop and storage; 1 garage space
- Security: Storm shelter; Smoke detector(s)
- Utilities: Cable available; Electricity available; Natural gas available; Phone available; Public water; Public sewer
- Home design: 2-story home; Faces west; Basement with walk-out access and partial crawl space
- Construction: Built according to public records; Brick, vinyl siding, and wood frame construction; Asphalt/fiberglass roof; Basement and crawlspace foundation
- Exterior features: Concrete driveway; Covered porch; Porch; Dog run; Rain gutters; Shed(s) / exterior storage; Chain link partial fencing; Storm shelter; Smoke detector(s)
Interior
- Kitchen: Kitchen with breakfast nook; Oven; Range; Stove; Refrigerator
- Bedrooms: Living Room (First level) — formal living room
- Flooring: Carpet; Laminate; Tile
- Bathrooms: 2 full bathrooms
- Heating & cooling: Gas heating; Radiant heating; Window cooling units
- Interior features: High ceilings; Vaulted ceiling(s); Laminate counters; Wood window frames
- Laundry & utility: Electric dryer hookup; Gas water heater
Neighborhood map
What this means for you Summary
Snapshot
- This is a 3-bed/2.0-bath single-family listed at $115k.
Deal economics
- At list price, monthly cash flow is $330 ($4k/yr) — positive.
- The deal already cash-flows at list — no discount required.
- Meets the 1% rule at list price ($1k rent vs $115k).
- Recommended offer: $108k (6.0% below list) — sets the bar for market timing.
Location & tenants
- Location reads 66/100 on livability (#102 in OK) — a middle-class / working-renter tenant base. Strengths: cost of living A+, housing A-, crime B; Watch: schools F, amenities F, commute F.
- Drumright (rural): math 24% / reading 25% proficiency, ranked #353 of 513 in OK (top 69%) — low school quality limits family demand, transient renter base, plan for 1-2y turnover; 68% free/reduced lunch — lower-income household profile, screen leases tightly.
- Market conditions: 39 active listings in the ZIP; 193 units permitted in Creek County in 2024 (76 in 5+ unit buildings).
Forward outlook
- In year one you build about $2k of equity ($795 loan paydown + $1k appreciation (1.1% local appreciation)).
- At projected returns (1.1% appreciation + 3.0% rent growth), your $32k cash investment doubles in ~5 years — after that, you're playing with house money.
Negotiation context
- It's been on market 63 days — a 6% lower offer ($108k) is reasonable based on typical stale-listing flexibility.
- Current owner paid $16k; list at $115k implies a 597% gain — meaningful room to come down on a strong offer.
Risks & watch-outs
- Watch-outs: built in 1955 — expect roof / HVAC / electrical / plumbing capex.
- Climate carrying-cost: severe wildfire risk; extreme-heat days projected 7→19/yr by 2055 (HVAC capex compounding) — expect insurance premiums to compound above CPI over the hold.
Questions for the listing agent
- It's been on market 63 days. Have you received any prior offers? Is the seller open to a 6% concession, seller financing, or rate buy-down credit?
- Built in 1955 — when were the roof, HVAC, electrical panel, plumbing, and water heater last replaced?
- Why hasn't it sold? Are there any deal-killer items the seller is aware of (foundation, flood, title, zoning, code violations)?
- Is there a deadline driving the sale (1031 exchange, divorce, estate, relocation)? That informs how much negotiation room exists.
- Schools are F-rated, which usually means shorter tenancies and higher turnover. Who's the typical renter profile here, and what's been the actual vacancy rate?
- What's the average days-on-market for RENTAL listings here right now (not sales)? A rising rental-DOM trend means longer vacancies and softer asking-rent achievability than the comps imply.
- What's the recent tenant-quality profile in this submarket — average credit score on applications, eviction rate, late-payment / NSF rate, and stable-employment percentage? A property-management company in the area should have these aggregated.
- How much new for-sale + rental construction is in the pipeline within 1–3 miles? Heavy new supply typically softens prices + rents 12–24 months out; constrained supply supports both.
Investment metrics
- 1% rule
- 1.12% ✓
- Cap rate
- 9.73%
- Cash-on-cash
- 12.28%
- DSCR
- 1.55
- GRM
- 7.5
CMA / ARV
- ARV (on-the-fly)
- $129,600
- Comps found
- 12
Show comp detail 12 sales within ~0.75 mi
| Address | Dist | Beds/Ba | Sqft | Sold | Price | $/sf | Match |
|---|---|---|---|---|---|---|---|
| 421 N Creek Ave | 0.16mi | 4/2.0 (+1) | 1,722 (+6%) | 5mo | $93,750 | $54 | 73 |
| 302 W Oak St | 0.05mi | 4/1.5 (+1) | 1,560 (-4%) | 19mo | $125,000 | $80 | 69 |
| 420 S Virginia Ave | 0.60mi | 3/2.0 | 1,604 (-1%) | 4mo | $119,000 | $74 | 67 |
| 612 W Cherry St | 0.30mi | 3/2.0 | 1,600 (-1%) | 22mo | $170,000 | $106 | 66 |
| 406 N Bristow Ave | 0.18mi | 4/1.5 (+1) | 1,522 (-6%) | 14mo | $164,900 | $108 | 62 |
| 609 W Maple St | 0.32mi | 3/1.5 | 1,550 (-4%) | 17mo | $101,500 | $65 | 62 |
| 512 N Creek Ave | 0.15mi | 3/1.0 | 1,463 (-10%) | 14mo | $70,000 | $48 | 62 |
| 619 W Cherry St | 0.35mi | 3/2.0 | 1,457 (-10%) | 8mo | $178,500 | $123 | 60 |
| 133 E Drumright St | 0.23mi | 3/2.0 | 1,731 (+7%) | 22mo | $159,900 | $92 | 60 |
| 316 W Broadway St | 0.24mi | 2/1.0 (-1) | 1,520 (-6%) | 12mo | $110,000 | $72 | 60 |
| 622 W Oak St | 0.37mi | 3/1.5 | 1,696 (+5%) | 17mo | $151,000 | $89 | 58 |
| 400 S Ohio St | 0.45mi | 3/1.0 | 1,430 (-12%) | 11mo | $104,000 | $73 | 46 |
Match score weights: distance 35% · size 25% · config 20% · recency 20%. Top-matched comps best support the ARV.
Projected returns pro-forma
1.14% appreciation · 3.0% rent growth · sell at horizon
- IRR
- 14.4%
- Equity multiple
- 1.74×
- Total profit
- $23,865
- Equity at exit
- $40,076
- IRR
- 17.8%
- Equity multiple
- 3.18×
- Total profit
- $70,166
- Equity at exit
- $53,896
Cash invested: $32,200 (down + closing). Projections, not guarantees.
Landlord ↔ Tenant lean methodology
- Overall (STATE)
- 83 Strongly Landlord-Friendly
- State Oklahoma
- 83 Strongly Landlord-Friendly · R+20
- County
- — inherits STATE
- City
- — inherits STATE
ZIP-level market 74030
- Home prices YoY
- 0.5%
- Active inventory
- 39
- Price-to-rent
- 7.5×
Monthly cashflow live
- Estimated rent
- $1,284 medium interval (Pro) →
- Mortgage (P&I)
- −$603
- Tax from tax record
- −$33 /mo · $401/yr
- Insurance
- −$48
- HOA
- −$0
- Vacancy / Maint / Mgmt
- −$270
- Net cashflow
- $330
Break-even live
UW: 25.0% down · 7.5% · 30yr · 1.5% tax · 5.0% vac · 8.0% maint · 8.0% mgmt
Financing live
Cash to close
- Down payment
- $28,750
- Closing costs
- $3,450
- Reserves months
- —
- Total cash needed
- —
Loan-product check · same deal, 3 products live
Conventional
25% down · 7.5% · 30yr
- Down + closing
- —
- Monthly P&I
- —
- Monthly cashflow
- —
- DSCR
- —
- Eligible?
- —
Personal DTI + credit; lowest rate.
DSCR
20% down · 8.5% · 30yr
- Down + closing
- —
- Monthly P&I
- —
- Monthly cashflow
- —
- DSCR
- —
- Eligible?
- —
No personal income docs; deal must DSCR.
Hard money
10% down · 12.0% · 12mo
- Down + closing
- —
- Monthly P&I
- —
- Monthly cashflow
- —
- DSCR
- —
- Eligible?
- —
Short-term bridge; refi at stabilization.
Listing history 5 events
-
2026-06-01status $115,000 Pending 63 DOM
-
2026-06-01days on market $115,000 Active 63 DOM
-
2026-05-31days on market $115,000 Active 62 DOM
-
2026-03-30$115,000 Active
-
1991-04-08soldstatus $16,500
ⓘ Source: listings_history table (triggers on properties + properties_extension) + one-shot
backfill from property_details.listing_events for pre-trigger history.
Tax reassessment forecast OK · Resets to sale price
- Current annual tax
- $401 · $33/mo
- Projected year-2 tax
- $1,035 · $86/mo
- Expected delta
- +$634/yr (+$53/mo · 158.1%)
ⓘ Screening estimate from a state-policy table — verify with the county assessor before closing.
Climate risk First Street
- Flood 1/10 Low FEMA zone X (unshaded) · 0% chance over 30 yrs
- Wildfire 8/10 Severe
- Heat 6/10 Major 7 d/yr ≥110°F today · 19 d/yr by 30 yrs out
- Wind 3/10 Moderate 4% chance of damaging wind over 30 yrs
- Air quality 2/10 Low 1 unhealthy d/yr today · 1 by 30 yrs out
Nearby sold comps map
Loading sold comps map…
Walkable amenities ~0.75 mi
Loading nearby amenities…
Taxation est. · year 1
- Rental income
- $15,403
- − Mortgage interest
- −$6,442
- − Property taxes
- −$401
- − Insurance
- −$575
- − Repairs & maintenance
- −$1,232
- − Management
- −$1,232
- − Depreciation
- −$3,345
- Taxable income
- $2,175
- Est. tax owed @ 24.0%
- −$522
- After-tax cash flow
- $3,434/yr
For passive investors: Depreciation is non-cash, so a rental often shows a tax loss while cash-flowing — sheltering income. Rental losses are passive: they offset passive income freely, and up to $25,000/yr can offset ordinary (W-2) income if you actively participate and your MAGI is under $100k (phasing out to $0 by $150k); unused losses carry forward. On sale, claimed depreciation is recaptured at up to 25%, and gains may owe capital-gains tax (a 1031 exchange can defer both). Figures are a year-1 estimate at your 24.0% rate — not tax advice; consult a CPA.
Schools (NCES district)
- District
- Drumright
- NCES district ID
- 4010200
- Math proficiency
- 24% ▲ 7.00%
- Reading proficiency
- 25% ▼ -4.00%
- Median HH income
- $35,602
- Composite
- 23.33/100
- National rank
- #13308
- State rank
- #353 of 513 in OK
Livability — Drumright
- Score
- 66/100
- State rank
- #102
- US rank
- #11324
Category grades
Schools grade is shown separately in the Schools card above.
Census & demographics
- Census place
- Drumright, OK
- Population (ZIP)
- 2,978
Population outlook (Creek County) Hauer SSP2
- Today (2025)
- 72,706 people
- By 2030
- 73,032 · +0.4%
- By 2040
- 72,788 · +0.1%
- By 2050
- 71,558 · -1.6%
- By 2075
- 69,248 · -4.8%
- By 2100
- 62,722 · -13.7%
Race, ethnicity, and origin ACS 2023
- Neighborhood character
- Predominantly White (79%)
- Race & ethnicity
- White 79% Native American 9% Two or more races 8% Hispanic / Latino 2% Black 1% Asian 1%
- Common ancestry
- Slovak 2% Italian 1% Serbian 1%
- Foreign-born
- 1% · Canada, China
- Languages at home
- 98% English-only · Spanish 1% Chinese 1%
Political lean MEDSL · Creek
- 2024 margin
- Solid R (+55.7) · D 21.2% · R 77.0% · Other 1.8%
- 2008→2024 swing
- -14.1pp toward R · 2008: -41.6pp · 2024: -55.7pp
- All cycles
- 2024: R+55.7 2020: R+54.8 2016: R+54.5 2012: R+45.4 2008: R+41.6
Not yet ingested
- Civics
- —
Market trends
- HPI YoY
- ▲ 1.14%
- Current HPI
- 232.3723
- Rent YoY
- —
- Metro
- —
- State GDP YoY
- ▲ 1.55%
- F500 in state
- 6
Industry mix (Fortune 500 HQ in OK)
| Industry | F500 HQs | Revenue |
|---|---|---|
| Energy | 3 | $48B |
|
||
Price history
+597.0% since first listed2 events — show timeline
- 2026-03-30 Listed $115,000 MLS Technology, Inc.
- 1991-04-08 Sold (Public Records) $16,500 Public Records
Property tax history
+2.5%/yrLatest (2025): $401 · -0.2% YoY. Source: county tax records.
Cash-flow waterfall
monthlySold comps — $/sqft
last 12 mo · ≤1 miLoading sold comps…