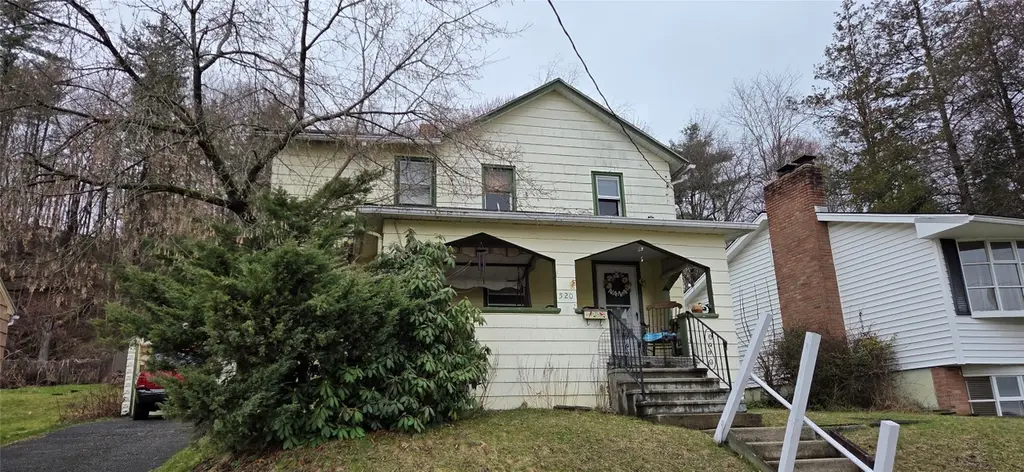
520 Davis Ave · Endicott, NY
Flood risk 1/10 · Minimal
- FEMA flood zone
- X
- Chance of flooding over 30 yrs
- 0.0%
- Est. flood insurance / yr
- $473 – $860
Fire risk 1/10 · Minimal
- Est. fire insurance / yr
- $691 – $1,283
Heat risk 3/10 · Minor
- Hot days now (above 93°F)
- 7 days/yr
- Hot days in 30 yrs
- 15 days/yr
Wind risk 2/10 · Minimal
- Chance of severe wind over 30 yrs
- 2.0%
Air-quality risk 2/10 · Minimal
- Unhealthy air days now
- 0 days/yr
- Unhealthy air days in 30 yrs
- 1 days/yr
Risk factors via First Street. Map © Google.
Why this score? — see what drove the B+ grade
The composite is a weighted blend of 9 inputs, each scored 0–100. Each bar is that input's sub-score; the figure is the points it added to the 100-point composite (weight × sub-score).
- Cash flow +28.6/30.0
- ARV discount +15.0/15.0
- DSCR +10.0/10.0
- 1% rule +8.8/10.0
- Rent growth +4.3/5.0
- Schools +4.3/10.0
- Livability +3.5/5.0
- Condition / age +2.5/5.0
- Appreciation +0.0/10.0
$109,900
🖨 Deal sheet 📄 Offer letter ✓ Due diligence
Listing remarks MLS
ONLINE AUCTION 5/4 - 5/6/2026. Opening bid is $25,000. This three bedroom, one bath home is located in the Village of Endicott. Cash offers only, no showings. Occupied, DO NOT GO ONTO THE PROPERTY OR DISTURB OCCUPANTS. All offers submitted via the auction site unseen. Contact an agent to submit a bid.
Key facts
- 7,840 sq ft lot
- 2 garage spots
- Built 1924
Neighborhood map
What this means for you Summary
Snapshot
- This is a 3-bed/1.0-bath single-family listed at $110k.
Deal economics
- At list price, monthly cash flow is $363 ($4k/yr) — positive.
- The deal already cash-flows at list — no discount required.
- Meets the 1% rule at list price ($2k rent vs $110k).
- Recommended offer: $103k (6.0% below list) — sets the bar for market timing.
- Cap rate 10.3% vs local median 5.5% in Endicott — top-decile yield for the area; either an underpriced asset or a hidden risk that comps aren't pricing in. Stress-test before assuming the spread holds.
Location & tenants
- Location reads 70/100 on livability (#438 in NY) — a middle-class / working-renter tenant base. Strengths: cost of living A+, health & safety A+, housing A; Watch: schools D+, amenities D, crime F.
- Union-Endicott Central School District (suburban): math 43% / reading 57% proficiency, ranked #387 of 590 in NY (top 66%) — acceptable for families but not a draw, mixed tenant base, ~2y average lease.
- Market conditions: Rents rising fast (+7.1%/yr); 213 active listings in the ZIP; 7 comparable units currently listed for rent nearby; rentals at typical pace (median 21d on market — plan ~3-4 weeks tenant-placement turnaround); 43% of comp listings sitting > 30 days — soft ceiling on asking rent; 340 units permitted in Broome County in 2024 (269 in 5+ unit buildings).
Forward outlook
- Local home prices are declining (-3.0%/yr); year-one equity from $760 of loan paydown is wiped out by about $3k of value loss. Plan a longer hold.
- Broome County population projected at -13% by 2050 — secular population decline; favor cash flow + early exit over multi-decade hold.
- At projected returns (-3.0% appreciation + 7.1% rent growth), your $31k cash investment doubles in ~7 years — after that, you're playing with house money.
Negotiation context
- It's been on market 75 days — a 6% lower offer ($103k) is reasonable based on typical stale-listing flexibility.
Risks & watch-outs
- Watch-outs: built in 1924 — expect roof / HVAC / electrical / plumbing capex.
Questions for the listing agent
- It's been on market 75 days. Have you received any prior offers? Is the seller open to a 6% concession, seller financing, or rate buy-down credit?
- Built in 1924 — when were the roof, HVAC, electrical panel, plumbing, and water heater last replaced?
- Why hasn't it sold? Are there any deal-killer items the seller is aware of (foundation, flood, title, zoning, code violations)?
- Is there a deadline driving the sale (1031 exchange, divorce, estate, relocation)? That informs how much negotiation room exists.
- Schools are D-rated, which usually means shorter tenancies and higher turnover. Who's the typical renter profile here, and what's been the actual vacancy rate?
- Crime grade is F in this area — have there been break-ins, vandalism, or insurance claims at this property in the last 3 years? What carrier currently insures it and at what premium?
- What's the average days-on-market for RENTAL listings here right now (not sales)? A rising rental-DOM trend means longer vacancies and softer asking-rent achievability than the comps imply.
- What's the recent tenant-quality profile in this submarket — average credit score on applications, eviction rate, late-payment / NSF rate, and stable-employment percentage? A property-management company in the area should have these aggregated.
- How much new for-sale + rental construction is in the pipeline within 1–3 miles? Heavy new supply typically softens prices + rents 12–24 months out; constrained supply supports both.
Investment metrics
- 1% rule
- 1.38% ✓
- Cap rate
- 10.25%
- Cash-on-cash
- 14.14%
- DSCR
- 1.63
- GRM
- 6.0
CMA / ARV
- ARV (median comp)
- $181,608
- List price
- $109,900
- Delta
- -39.49%
- Verdict
- UNDERPRICED
- Comps
- 20 within 1.0 mi
Show comp detail 12 sales within ~0.75 mi
| Address | Dist | Beds/Ba | Sqft | Sold | Price | $/sf | Match |
|---|---|---|---|---|---|---|---|
| 606 Exchange St S | 0.18mi | 3/1.0 | 1,248 (-0%) | 2mo | $146,500 | $117 | 90 |
| 505 Pinecrest Rd | 0.20mi | 3/1.5 | 1,368 (+9%) | 1mo | $250,000 | $183 | 72 |
| 105 West Edward St | 0.20mi | 3/2.0 | 1,350 (+8%) | 2mo | $175,000 | $130 | 72 |
| 407 Vestal Ave | 0.65mi | 3/1.0 | 1,284 (+3%) | 7mo | $155,000 | $121 | 59 |
| 207 N Page Ave | 0.63mi | 3/1.5 | 1,196 (-4%) | 3mo | $170,000 | $142 | 59 |
| 201 Sliter Pl | 0.58mi | 3/2.0 | 1,177 (-6%) | 6mo | $196,201 | $167 | 54 |
| 111 W Union St | 0.41mi | 3/1.5 | 1,436 (+15%) | 1mo | $205,000 | $143 | 53 |
| 124 W Wendell St. St | 0.69mi | 3/1.0 | 1,143 (-9%) | 4mo | $155,000 | $136 | 50 |
| 747 Dickson St | 0.74mi | 3/1.0 | 1,152 (-8%) | 5mo | $163,000 | $141 | 49 |
| 633 Church St | 0.46mi | 2/1.5 (-1) | 1,134 (-9%) | 10mo | $150,000 | $132 | 48 |
| 702 Church St | 0.51mi | 4/2.0 (+1) | 1,395 (+12%) | 7mo | $225,000 | $161 | 42 |
| 720 Maple St | 0.73mi | 2/1.0 (-1) | 1,164 (-7%) | 10mo | $119,000 | $102 | 42 |
Match score weights: distance 35% · size 25% · config 20% · recency 20%. Top-matched comps best support the ARV.
Projected returns pro-forma
-3.0% appreciation · 7.09% rent growth · sell at horizon
- IRR
- 9.3%
- Equity multiple
- 1.39×
- Total profit
- $11,860
- Equity at exit
- $16,386
- IRR
- 21.9%
- Equity multiple
- 3.25×
- Total profit
- $69,368
- Equity at exit
- $9,502
Cash invested: $30,772 (down + closing). Projections, not guarantees.
Landlord ↔ Tenant lean methodology
- Overall (STATE)
- 15 Strongly Tenant-Friendly
- State New York
- 15 Strongly Tenant-Friendly · D+10
- County
- — inherits STATE
- City
- — inherits STATE
ZIP-level market 13760
- Home prices YoY
- -32.7%
- Rents YoY
- 7.1%
- Active inventory
- 213
- Price-to-rent
- 6.0×
Monthly cashflow live
- Estimated rent
- $1,517 high interval (Pro) →
- Mortgage (P&I)
- −$576
- Tax from tax record
- −$213 /mo · $2,559/yr
- Insurance
- −$46
- HOA
- −$0
- Vacancy / Maint / Mgmt
- −$318
- Net cashflow
- $363
Break-even live
UW: 25.0% down · 7.5% · 30yr · 1.5% tax · 5.0% vac · 8.0% maint · 8.0% mgmt
Financing live
Cash to close
- Down payment
- $27,475
- Closing costs
- $3,297
- Reserves months
- —
- Total cash needed
- —
Loan-product check · same deal, 3 products live
Conventional
25% down · 7.5% · 30yr
- Down + closing
- —
- Monthly P&I
- —
- Monthly cashflow
- —
- DSCR
- —
- Eligible?
- —
Personal DTI + credit; lowest rate.
DSCR
20% down · 8.5% · 30yr
- Down + closing
- —
- Monthly P&I
- —
- Monthly cashflow
- —
- DSCR
- —
- Eligible?
- —
No personal income docs; deal must DSCR.
Hard money
10% down · 12.0% · 12mo
- Down + closing
- —
- Monthly P&I
- —
- Monthly cashflow
- —
- DSCR
- —
- Eligible?
- —
Short-term bridge; refi at stabilization.
Rent comps 7 comps
| Address | Beds | Baths | Sqft | Rent | $/sqft | DOM | Units | Dist |
|---|---|---|---|---|---|---|---|---|
| 804 Broad St Unit 2 Endicott, NY | 3.0 | 1.0 | 975 | $1,500 | $1.54 | 44d | 1 | 1.02mi |
| 209 Vivian Ln Vestal, NY | 2.0 | 1.5 | 1442 | $2,400 | $1.66 | 21d | 1 | 1.05mi |
| 1 Jane Lacey Dr Endicott, NY | 1.0–3.0 | 1.0–1.5 | 900 | $1,305 | $1.45 | 21d | 1 | 1.11mi |
| 401 Clayton Ave Vestal, NY | 2.0 | 1.0 | 952 | $1,350 | $1.42 | 44d | 1 | 1.23mi |
| 106 Madison Ave Unit 1 Endicott, NY | 3.0 | 1.0 | 1050 | $1,500 | $1.43 | 44d | 1 | 1.24mi |
| 228 Airport Rd Unit 1 Endicott, NY | 2.0 | 1.0 | 1000 | $1,075 | $1.07 | 21d | 1 | 1.29mi |
| 53 Washington Ave Unit 2 Endicott, NY | 2.0 | 1.0 | 1180 | $1,300 | $1.10 | 21d | 1 | 1.35mi |
Listing history 9 events
-
2026-06-07statusdays on market $109,900 Pending 75 DOM
-
2026-06-05days on market $109,900 Active 74 DOM
-
2026-06-03days on market $109,900 Active 73 DOM
-
2026-06-02days on market $109,900 Active 72 DOM
-
2026-06-01days on market $109,900 Active 71 DOM
-
2026-05-31days on market $109,900 Active 70 DOM
-
2026-05-30days on market $109,900 Active 69 DOM
-
2026-05-09status Pending 302-char remark
Show marketing remark (302 chars)
ONLINE AUCTION 5/4 - 5/6/2026. Opening bid is $25,000. This three bedroom, one bath home is located in the Village of Endicott. Cash offers only, no showings. Occupied, DO NOT GO ONTO THE PROPERTY OR DISTURB OCCUPANTS. All offers submitted via the auction site unseen. Contact an agent to submit a bid.
-
2026-03-03$109,900 Active 302-char remark
Show marketing remark (302 chars)
ONLINE AUCTION 5/4 - 5/6/2026. Opening bid is $25,000. This three bedroom, one bath home is located in the Village of Endicott. Cash offers only, no showings. Occupied, DO NOT GO ONTO THE PROPERTY OR DISTURB OCCUPANTS. All offers submitted via the auction site unseen. Contact an agent to submit a bid.
ⓘ Source: listings_history table (triggers on properties + properties_extension) + one-shot
backfill from property_details.listing_events for pre-trigger history.
Tax reassessment forecast NY · Partial reset (capped growth)
- Current annual tax
- $2,559 · $213/mo
- Projected year-2 tax
- $2,559 · $213/mo
- Expected delta
- $0/yr ($0/mo · 0.0%)
ⓘ Screening estimate from a state-policy table — verify with the county assessor before closing.
Climate risk First Street
- Flood 1/10 Low FEMA zone X · 0% chance over 30 yrs
- Wildfire 1/10 Low
- Heat 3/10 Moderate 7 d/yr ≥93°F today · 15 d/yr by 30 yrs out
- Wind 2/10 Low 2% chance of damaging wind over 30 yrs
- Air quality 2/10 Low 0 unhealthy d/yr today · 1 by 30 yrs out
Nearby sold comps map
Loading sold comps map…
Walkable amenities ~0.75 mi
Loading nearby amenities…
Taxation est. · year 1
- Rental income
- $18,198
- − Mortgage interest
- −$6,156
- − Property taxes
- −$2,559
- − Insurance
- −$550
- − Repairs & maintenance
- −$1,456
- − Management
- −$1,456
- − Depreciation
- −$3,197
- Taxable income
- $2,825
- Est. tax owed @ 24.0%
- −$678
- After-tax cash flow
- $3,675/yr
For passive investors: Depreciation is non-cash, so a rental often shows a tax loss while cash-flowing — sheltering income. Rental losses are passive: they offset passive income freely, and up to $25,000/yr can offset ordinary (W-2) income if you actively participate and your MAGI is under $100k (phasing out to $0 by $150k); unused losses carry forward. On sale, claimed depreciation is recaptured at up to 25%, and gains may owe capital-gains tax (a 1031 exchange can defer both). Figures are a year-1 estimate at your 24.0% rate — not tax advice; consult a CPA.
Schools (NCES district)
- District
- Union-Endicott Central School District
- NCES district ID
- 3610710
- Math proficiency
- 43% ▼ -9.00%
- Reading proficiency
- 57% ▲ 11.00%
- Median HH income
- $49,265
- Composite
- 42.66/100
- National rank
- #3176
- State rank
- #387 of 590 in NY
Livability — Endicott
- Score
- 70/100
- State rank
- #438
- US rank
- #7657
Category grades
Schools grade is shown separately in the Schools card above.
Census & demographics
- Census place
- Endicott, NY
- County
- Broome County · 126,805 people
- City population
- 42,896
- Metro
- Binghamton, NY
- Population (ZIP)
- 42,896
- Household income
- $66,095
- Rent vs Own
- Severe rent burden
- 1480.0
Population outlook (Broome County) Hauer SSP2
- Today (2025)
- 187,989 people
- By 2030
- 183,066 · -2.6%
- By 2040
- 172,228 · -8.4%
- By 2050
- 163,161 · -13.2%
- By 2075
- 153,641 · -18.3%
- By 2100
- 140,851 · -25.1%
Race, ethnicity, and origin ACS 2023
- Neighborhood character
- Predominantly White (84%)
- Race & ethnicity
- White 84% Two or more races 7% Hispanic / Latino 6% Black 4% Asian 2%
- Hispanic origin (detail)
- Puerto Rican 2%
- Common ancestry
- Romanian 6% Lithuanian 2% Slovak 2%
- Foreign-born
- 5% · Canada, China
- Languages at home
- 94% English-only · Spanish 2% Other Indo-European 1% Russian/Polish/Slavic 1%
Political lean MEDSL · Broome
- 2024 margin
- Toss-up / Even · D 50.2% · R 49.8%
- 2008→2024 swing
- -7.6pp toward R · 2008: 8.0pp · 2024: 0.4pp
- All cycles
- 2024: D+0.4 2020: D+3.5 2016: R+3.7 2012: D+4.6 2008: D+8.0
Not yet ingested
- Civics
- —
Market trends
- HPI YoY
- ▼ -131.29%
- Current HPI
- 270.2661
- Rent YoY
- ▲ 7.09%
- Metro
- Binghamton, NY
- State GDP YoY
- ▲ 2.60%
- F500 in state
- 92
Industry mix (Fortune 500 HQ in NY)
| Industry | F500 HQs | Revenue |
|---|---|---|
| Financial Services | 10 | $950B |
|
||
| Consumer Goods | 9 | $162B |
|
||
| Insurance | 4 | $225B |
|
||
| Telecommunications | 2 | $144B |
|
||
| Pharmaceuticals | 2 | $112B |
|
||
| Media / Entertainment | 2 | $69B |
|
||
Price history
2 events — show timeline
- 2026-05-09 Pending — GBAOR
- 2026-03-03 Listed $109,900 GBAOR
Property tax history
+5.6%/yrLatest (2025): $2,559 · +3.4% YoY. Source: county tax records.
Cash-flow waterfall
monthlySold comps — $/sqft
last 12 mo · ≤1 miLoading sold comps…