333 Industrial Dr · Mountain City, TN
Flood risk 1/10 · Minimal
- FEMA flood zone
- X (unshaded)
- Chance of flooding over 30 yrs
- 0.0%
- Est. flood insurance / yr
- $507 – $1,088
Fire risk 4/10 · Minor
- Est. fire insurance / yr
- $949 – $1,763
Heat risk 4/10 · Minor
- Hot days now (above 89°F)
- 9 days/yr
- Hot days in 30 yrs
- 25 days/yr
Wind risk 2/10 · Minimal
- Chance of severe wind over 30 yrs
- —
Air-quality risk 1/10 · Minimal
- Unhealthy air days now
- 0 days/yr
- Unhealthy air days in 30 yrs
- 0 days/yr
Risk factors via First Street. Map © Google.
Why this score? — see what drove the B+ grade
The composite is a weighted blend of 9 inputs, each scored 0–100. Each bar is that input's sub-score; the figure is the points it added to the 100-point composite (weight × sub-score).
- Cash flow +30.0/30.0
- 1% rule +10.0/10.0
- DSCR +10.0/10.0
- Appreciation +10.0/10.0
- ARV discount +7.5/15.0
- Livability +3.2/5.0
- Rent growth +2.5/5.0
- Condition / age +2.5/5.0
- Schools +2.4/10.0
$98,000
🖨 Deal sheet 📄 Offer letter ✓ Due diligence
Listing remarks
Inside of home has been completely painted. New laminate flooring throughout. New light fixtures throughout. Primary Bathroom has been updated with new shower and new vanity and sinks. Electric furnace and Monitor heater with oil tank. New kitchen appliances and the washing machine and dryer convey with the property. 14x76 Mobile Home
Key facts
- New light fixtures
- 0.5 acre lot
- Built 1990
Tags
Property features AI
Finance
- Other: Zoned for city; Approximately 0.5 acre lot
Exterior
- Parking: Driveway
- Utilities: Public water; Public sewer; Electricity connected; Cable available; Phone available; Water connected; Sewer connected
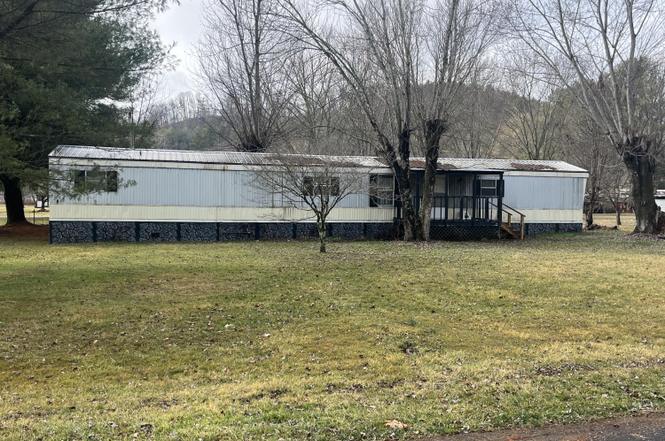
- Home design: Manufactured single-wide home; One story; Residential single-family property
- Construction: Aluminum siding; Metal roof; Built as a manufactured house
- Exterior features: Covered front and rear porches; Outbuilding on the property; Level topography; Has a view
Interior
- Kitchen: Electric range; Refrigerator; Dishwasher not listed
- Bedrooms: 3 bedrooms
- Flooring: Laminate flooring
- Bathrooms: 2 full bathrooms
- Heating & cooling: Central heating; Oil heating; No cooling
- Interior features: Washer and dryer included; Electric range; Refrigerator; Laminate flooring; Total of 6 rooms
- Laundry & utility: Washer hookup; Electric dryer hookup; Washer and dryer present
Neighborhood map
What this means for you Summary
Snapshot
- This is a 3-bed/2.0-bath other listed at $98k.
Deal economics
- At list price, monthly cash flow is $641 ($8k/yr) — positive.
- The deal already cash-flows at list — no discount required.
- Meets the 1% rule at list price ($2k rent vs $98k).
- Recommended offer: $89k (9.0% below list) — sets the bar for market timing.
- Cap rate 14.1% vs local median 2.1% in Mountain City — top-decile yield for the area; either an underpriced asset or a hidden risk that comps aren't pricing in. Stress-test before assuming the spread holds.
Location & tenants
- Location reads 63/100 on livability (#191 in TN) — a middle-class / working-renter tenant base. Strengths: crime A+, cost of living A+; Watch: housing C-, health & safety C-, amenities F.
- Johnson County (rural): math 27% / reading 31% proficiency, ranked #69 of 139 in TN (top 50%) — low school quality limits family demand, transient renter base, plan for 1-2y turnover.
- Zoned schools: Mountain City Elementary (math 41% / reading 40%, grade F, #219 of 952 statewide, top 24%, 436 students, 0% FRL); Johnson Co Middle School (math 28% / reading 31%, grade F, #107 of 333 statewide, top 33%, 284 students, 0% FRL); Johnson Co High School (math 17% / reading 32%, grade F, #129 of 332 statewide, top 43%, 643 students, 0% FRL) — zoned schools average 0% FRL vs 59% district-wide (59 pts lower); this property's tenant base skews higher-income than the district average.
- Market conditions: 130 active listings in the ZIP; 6 units permitted in Johnson County in 2024 (0 in 5+ unit buildings).
Forward outlook
- In year one you build about $10k of equity ($678 loan paydown + $10k appreciation (10.0% local appreciation)).
- Johnson County population projected at -21% by 2050 — secular population decline; favor cash flow + early exit over multi-decade hold.
- At projected returns (10.0% appreciation + 3.0% rent growth), your $27k cash investment doubles in ~2 years — after that, you're playing with house money.
- By year 4, paydown + projected appreciation supports a ~$37k cash-out refi (75% LTV) — recoverable capital for the next deal without selling this one.
Negotiation context
- It's been on market 97 days — a 9% lower offer ($89k) is reasonable based on typical stale-listing flexibility.
Questions for the listing agent
- It's been on market 97 days. Have you received any prior offers? Is the seller open to a 9% concession, seller financing, or rate buy-down credit?
- Why hasn't it sold? Are there any deal-killer items the seller is aware of (foundation, flood, title, zoning, code violations)?
- Is there a deadline driving the sale (1031 exchange, divorce, estate, relocation)? That informs how much negotiation room exists.
- Schools are F-rated, which usually means shorter tenancies and higher turnover. Who's the typical renter profile here, and what's been the actual vacancy rate?
- What's the average days-on-market for RENTAL listings here right now (not sales)? A rising rental-DOM trend means longer vacancies and softer asking-rent achievability than the comps imply.
- What's the recent tenant-quality profile in this submarket — average credit score on applications, eviction rate, late-payment / NSF rate, and stable-employment percentage? A property-management company in the area should have these aggregated.
- How much new for-sale + rental construction is in the pipeline within 1–3 miles? Heavy new supply typically softens prices + rents 12–24 months out; constrained supply supports both.
Investment metrics
- 1% rule
- 1.59% ✓
- Cap rate
- 14.14%
- Cash-on-cash
- 28.04%
- DSCR
- 2.25
- GRM
- 5.3
CMA / ARV
No comps found within radius.
Projected returns pro-forma
10.0% appreciation · 3.0% rent growth · sell at horizon
- IRR
- 45.5%
- Equity multiple
- 4.43×
- Total profit
- $94,175
- Equity at exit
- $88,286
- IRR
- 39.5%
- Equity multiple
- 9.93×
- Total profit
- $245,155
- Equity at exit
- $190,392
Cash invested: $27,440 (down + closing). Projections, not guarantees.
Landlord ↔ Tenant lean methodology
- Overall (STATE)
- 87 Strongly Landlord-Friendly
- State Tennessee
- 87 Strongly Landlord-Friendly · R+13
- County
- — inherits STATE
- City
- — inherits STATE
ZIP-level market 37683
- Home prices YoY
- 10.5%
- Active inventory
- 130
- Price-to-rent
- 5.3×
Monthly cashflow live
- Estimated rent
- $1,555 medium interval (Pro) →
- Mortgage (P&I)
- −$514
- Tax from tax record
- −$33 /mo · $392/yr
- Insurance
- −$41
- HOA
- −$0
- Vacancy / Maint / Mgmt
- −$327
- Net cashflow
- $641
Break-even live
UW: 25.0% down · 7.5% · 30yr · 1.5% tax · 5.0% vac · 8.0% maint · 8.0% mgmt
Financing live
Cash to close
- Down payment
- $24,500
- Closing costs
- $2,940
- Reserves months
- —
- Total cash needed
- —
Loan-product check · same deal, 3 products live
Conventional
25% down · 7.5% · 30yr
- Down + closing
- —
- Monthly P&I
- —
- Monthly cashflow
- —
- DSCR
- —
- Eligible?
- —
Personal DTI + credit; lowest rate.
DSCR
20% down · 8.5% · 30yr
- Down + closing
- —
- Monthly P&I
- —
- Monthly cashflow
- —
- DSCR
- —
- Eligible?
- —
No personal income docs; deal must DSCR.
Hard money
10% down · 12.0% · 12mo
- Down + closing
- —
- Monthly P&I
- —
- Monthly cashflow
- —
- DSCR
- —
- Eligible?
- —
Short-term bridge; refi at stabilization.
Listing history 1 events
-
2026-02-21$128,000 Active
ⓘ Source: listings_history table (triggers on properties + properties_extension) + one-shot
backfill from property_details.listing_events for pre-trigger history.
Tax reassessment forecast TN · Resets to sale price
- Current annual tax
- $392 · $33/mo
- Projected year-2 tax
- $696 · $58/mo
- Expected delta
- +$304/yr (+$25/mo · 77.5%)
ⓘ Screening estimate from a state-policy table — verify with the county assessor before closing.
Climate risk First Street
- Flood 1/10 Low FEMA zone X (unshaded) · 0% chance over 30 yrs
- Wildfire 4/10 Moderate
- Heat 4/10 Moderate 9 d/yr ≥89°F today · 25 d/yr by 30 yrs out
- Wind 2/10 Low
- Air quality 1/10 Low 0 unhealthy d/yr today · 0 by 30 yrs out
Nearby sold comps map
Loading sold comps map…
Walkable amenities ~0.75 mi
Loading nearby amenities…
Taxation est. · year 1
- Rental income
- $18,661
- − Mortgage interest
- −$5,490
- − Property taxes
- −$392
- − Insurance
- −$490
- − Repairs & maintenance
- −$1,493
- − Management
- −$1,493
- − Depreciation
- −$2,851
- Taxable income
- $6,453
- Est. tax owed @ 24.0%
- −$1,549
- After-tax cash flow
- $6,145/yr
For passive investors: Depreciation is non-cash, so a rental often shows a tax loss while cash-flowing — sheltering income. Rental losses are passive: they offset passive income freely, and up to $25,000/yr can offset ordinary (W-2) income if you actively participate and your MAGI is under $100k (phasing out to $0 by $150k); unused losses carry forward. On sale, claimed depreciation is recaptured at up to 25%, and gains may owe capital-gains tax (a 1031 exchange can defer both). Figures are a year-1 estimate at your 24.0% rate — not tax advice; consult a CPA.
Schools (NCES district)
- District
- Johnson County
- NCES district ID
- 4702160
- Math proficiency
- 27% ▼ -11.00%
- Reading proficiency
- 31% ▬ 0.00%
- Median HH income
- $31,298
- Composite
- 23.58/100
- National rank
- #7852
- State rank
- #69 of 139 in TN
Livability — Mountain City
- Score
- 63/100
- State rank
- #191
- US rank
- #15252
Category grades
Schools grade is shown separately in the Schools card above.
Census & demographics
- Census place
- Mountain City, TN
- Population (ZIP)
- 13,716
Population outlook (Johnson County) Hauer SSP2
- Today (2025)
- 16,842 people
- By 2030
- 16,158 · -4.1%
- By 2040
- 14,682 · -12.8%
- By 2050
- 13,306 · -21.0%
- By 2075
- 11,087 · -34.2%
- By 2100
- 9,360 · -44.4%
Race, ethnicity, and origin ACS 2023
- Neighborhood character
- Predominantly White (86%)
- Race & ethnicity
- White 86% Two or more races 6% Black 5% Hispanic / Latino 3%
- Common ancestry
- Serbian 5% Slovak 3% Romanian 1%
- Foreign-born
- 3% · Canada
- Languages at home
- 95% English-only · Spanish 4% German/W. Germanic 1%
Political lean MEDSL · Johnson
- 2024 margin
- Solid R (+69.3) · D 15.0% · R 84.3%
- 2008→2024 swing
- -27.1pp toward R · 2008: -42.2pp · 2024: -69.3pp
- All cycles
- 2024: R+69.3 2020: R+66.9 2016: R+67.3 2012: R+50.5 2008: R+42.2
Not yet ingested
- Civics
- —
Market trends
- HPI YoY
- ▲ 29.22%
- Current HPI
- 307.8545
- Rent YoY
- —
- Metro
- —
- State GDP YoY
- ▲ 2.78%
- F500 in state
- 22
Industry mix (Fortune 500 HQ in TN)
| Industry | F500 HQs | Revenue |
|---|---|---|
| Healthcare | 3 | $91B |
|
||
| Retail | 3 | $72B |
|
||
| Transportation / Logistics | 1 | $88B |
|
||
| Paper / Packaging | 1 | $19B |
|
||
| Insurance | 1 | $13B |
|
||
| Energy | 1 | $12B |
|
||
Price history
1 event — show timeline
- 2026-02-21 Listed $128,000 TVRMLS
Property tax history
+6.2%/yrLatest (2025): $392 · +56.2% YoY. Source: county tax records.
Cash-flow waterfall
monthlySold comps — $/sqft
last 12 mo · ≤1 miLoading sold comps…