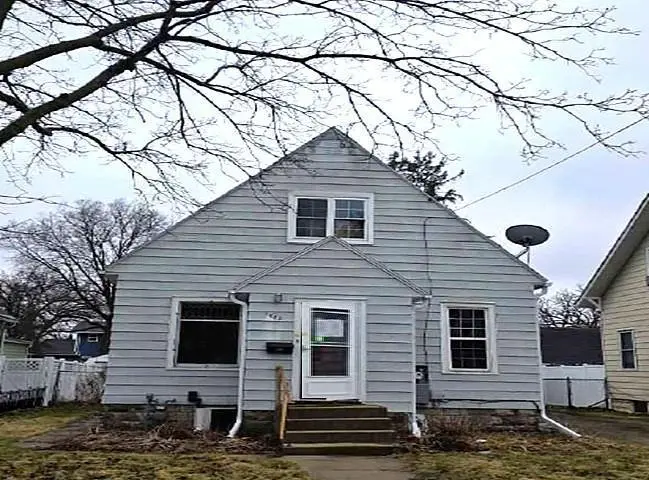
1009 5th Ave NW · Austin, MN
Flood risk 1/10 · Minimal
- FEMA flood zone
- X (unshaded)
- Chance of flooding over 30 yrs
- 0.0%
- Est. flood insurance / yr
- $473 – $860
Fire risk 1/10 · Minimal
- Est. fire insurance / yr
- $888 – $1,650
Heat risk 1/10 · Minimal
- Hot days now (above 98°F)
- 7 days/yr
- Hot days in 30 yrs
- 16 days/yr
Wind risk 2/10 · Minimal
- Chance of severe wind over 30 yrs
- —
Air-quality risk 1/10 · Minimal
- Unhealthy air days now
- 0 days/yr
- Unhealthy air days in 30 yrs
- 0 days/yr
Risk factors via First Street. Map © Google.
Why this score? — see what drove the B grade
The composite is a weighted blend of 9 inputs, each scored 0–100. Each bar is that input's sub-score; the figure is the points it added to the 100-point composite (weight × sub-score).
- Cash flow +30.0/30.0
- 1% rule +10.0/10.0
- DSCR +10.0/10.0
- ARV discount +7.5/15.0
- Rent growth +5.0/5.0
- Livability +4.0/5.0
- Schools +2.5/10.0
- Condition / age +2.5/5.0
- Appreciation +0.0/10.0
$68,900
🖨 Deal sheet 📄 Offer letter ✓ Due diligence
Listing remarks MLS
Duplex in NE Austin. Investment property. Live in one unit, rent out the other, or rent out both units.
Key facts
- 6,098 sq ft lot
- Garage
- Built 1921
Property features AI
Finance
- Financial info: Tax amount approximately $1,725 (2025)
Exterior
- Parking: 1-car garage
- Utilities: City water connected; City sewer connected; Natural gas
- Home design: Residential property; One and one-half stories; Main living on the main level; Above-grade finished area 1,015
- Construction: Other roof; Other foundation
- Exterior features: Other exterior features
Interior
- Bedrooms: 3 bedrooms
- Bathrooms: 1 full bathroom
- Heating & cooling: Forced air heating; Central air conditioning
- Interior features: Full, unfinished basement; Central air
Neighborhood map
What this means for you Summary
Snapshot
- This is a 3-bed/1.0-bath single-family listed at $69k.
Deal economics
- At list price, monthly cash flow is $554 ($7k/yr) — positive.
- The deal already cash-flows at list — no discount required.
- Meets the 1% rule at list price ($1k rent vs $69k).
- Cap rate 15.9% vs local median 4.5% in Austin — top-decile yield for the area; either an underpriced asset or a hidden risk that comps aren't pricing in. Stress-test before assuming the spread holds.
Location & tenants
- Location reads 80/100 on livability (#77 in MN, #1,829 nationally) — a professional / high-income tenant draw. Strengths: cost of living A+, housing A+, health & safety A+; Watch: schools C-, commute F.
- Austin Public School District (town): math 24% / reading 34% proficiency, ranked #267 of 301 in MN (top 89%) — low school quality limits family demand, transient renter base, plan for 1-2y turnover.
- Market conditions: Rents rising fast (+11.6%/yr); 188 active listings in the ZIP; 9 comparable units currently listed for rent nearby; rentals lingering (median 44d on market — plan ~5-8 weeks vacancy on turnover, expect pricing pressure); 100% of comp listings sitting > 30 days — soft ceiling on asking rent; 53 units permitted in Mower County in 2024 (0 in 5+ unit buildings).
Forward outlook
- Local home prices are declining (-3.0%/yr); year-one equity from $476 of loan paydown is wiped out by about $2k of value loss. Plan a longer hold.
- At projected returns (-3.0% appreciation + 8.0% rent growth), your $19k cash investment doubles in ~4 years — after that, you're playing with house money.
Negotiation context
- Only 14 days on market — expect competitive offers; lowballing is unlikely to land.
- 5 sale attempts since 27y ago with the ask held roughly flat each time — persistent listings suggest the price (not the market) is what's stuck; bring a comps-based counter.
Risks & watch-outs
- Watch-outs: built in 1921 — expect roof / HVAC / electrical / plumbing capex.
Questions for the listing agent
- Built in 1921 — when were the roof, HVAC, electrical panel, plumbing, and water heater last replaced?
- Is there a deadline driving the sale (1031 exchange, divorce, estate, relocation)? That informs how much negotiation room exists.
- What's the average days-on-market for RENTAL listings here right now (not sales)? A rising rental-DOM trend means longer vacancies and softer asking-rent achievability than the comps imply.
- What's the recent tenant-quality profile in this submarket — average credit score on applications, eviction rate, late-payment / NSF rate, and stable-employment percentage? A property-management company in the area should have these aggregated.
- How much new for-sale + rental construction is in the pipeline within 1–3 miles? Heavy new supply typically softens prices + rents 12–24 months out; constrained supply supports both.
Investment metrics
- 1% rule
- 1.90% ✓
- Cap rate
- 15.93%
- Cash-on-cash
- 34.44%
- DSCR
- 2.53
- GRM
- 4.4
CMA / ARV
No comps found within radius.
Projected returns pro-forma
-3.0% appreciation · 8.0% rent growth · sell at horizon
- IRR
- 35.5%
- Equity multiple
- 2.61×
- Total profit
- $31,040
- Equity at exit
- $10,273
- IRR
- 44.8%
- Equity multiple
- 6.39×
- Total profit
- $104,030
- Equity at exit
- $5,957
Cash invested: $19,292 (down + closing). Projections, not guarantees.
Landlord ↔ Tenant lean methodology
- Overall (STATE)
- 46 Balanced
- State Minnesota
- 46 Balanced · D+2
- County
- — inherits STATE
- City
- — inherits STATE
ZIP-level market 55912
- Home prices YoY
- -34.4%
- Rents YoY
- 11.6%
- Active inventory
- 188
- Price-to-rent
- 4.4×
Monthly cashflow live
- Estimated rent
- $1,310 high interval (Pro) →
- Mortgage (P&I)
- −$361
- Tax from tax record
- −$91 /mo · $1,094/yr
- Insurance
- −$29
- HOA
- −$0
- Vacancy / Maint / Mgmt
- −$275
- Net cashflow
- $554
Break-even live
UW: 25.0% down · 7.5% · 30yr · 1.5% tax · 5.0% vac · 8.0% maint · 8.0% mgmt
Financing live
Cash to close
- Down payment
- $17,225
- Closing costs
- $2,067
- Reserves months
- —
- Total cash needed
- —
Loan-product check · same deal, 3 products live
Conventional
25% down · 7.5% · 30yr
- Down + closing
- —
- Monthly P&I
- —
- Monthly cashflow
- —
- DSCR
- —
- Eligible?
- —
Personal DTI + credit; lowest rate.
DSCR
20% down · 8.5% · 30yr
- Down + closing
- —
- Monthly P&I
- —
- Monthly cashflow
- —
- DSCR
- —
- Eligible?
- —
No personal income docs; deal must DSCR.
Hard money
10% down · 12.0% · 12mo
- Down + closing
- —
- Monthly P&I
- —
- Monthly cashflow
- —
- DSCR
- —
- Eligible?
- —
Short-term bridge; refi at stabilization.
Rent comps 9 comps
| Address | Beds | Baths | Sqft | Rent | $/sqft | DOM | Units | Dist |
|---|---|---|---|---|---|---|---|---|
| 609 11th St NW Austin, MN | 2.0 | 2.0 | 925 | $1,300 | $1.41 | 43d | 1 | 0.11mi |
| 600 14th St NW Apt 6 Austin, MN | 2.0 | 1.0 | 700 | $995 | $1.42 | 43d | 1 | 0.30mi |
| 900 14th St NW Austin, MN | 2.0 | 1.0 | 518 | $1,050 | $2.03 | 43d | 18 | 0.39mi |
| 704 1st Dr NW Austin, MN | 3.0 | 1.0–2.0 | 981 | $2,514 | $2.56 | 43d | 96 | 0.56mi |
| 401 2nd Ave SW Unit 102 Austin, MN | 3.0 | 1.0 | 780 | $1,025 | $1.31 | 43d | 1 | 0.61mi |
| 202 11th Ave NW Unit 602 Austin, MN | 2.0 | 1.0 | 1000 | $950 | $0.95 | 43d | 1 | 0.69mi |
| 1310 21st Ave NW Austin, MN | 2.0 | 1.0 | 685 | $1,467 | $2.14 | 43d | 5 | 1.25mi |
| 800 8th Ave SE Austin, MN | 3.0 | 1.0 | 842 | $1,600 | $1.90 | 43d | 1 | 1.35mi |
| 1204 1st Ave NE Austin, MN | 3.0 | 2.0 | 1200 | $1,600 | $1.33 | 43d | 1 | 1.47mi |
Listing history 15 events
-
2026-06-07statusdays on market $68,900 Pending 14 DOM
-
2026-06-05days on market $68,900 Active 13 DOM
-
2026-06-02days on market $68,900 Active 11 DOM
-
2026-06-01days on market $68,900 Active 10 DOM
-
2026-05-31days on market $68,900 Active 9 DOM
-
2026-05-30days on market $68,900 Active 8 DOM
-
2026-05-22$68,900 Active
-
2007-03-30soldstatus $70,785 103-char remark
Show marketing remark (103 chars)
Duplex in NE Austin. Investment property. Live in one unit, rent out the other, or rent out both units.
-
2006-11-22$70,535 103-char remark
Show marketing remark (103 chars)
Duplex in NE Austin. Investment property. Live in one unit, rent out the other, or rent out both units.
-
2006-05-31soldstatus $56,500 164-char remark
Show marketing remark (164 chars)
Nice 3+ bedroom home, original oak woodwork with lead glass bookcases. Neat house with newer high efficiency forced air furnace and central air. Shower in basement.
-
2006-05-26soldstatus $56,500
-
2006-01-09$59,900 164-char remark
Show marketing remark (164 chars)
Nice 3+ bedroom home, original oak woodwork with lead glass bookcases. Neat house with newer high efficiency forced air furnace and central air. Shower in basement.
-
2005-10-14$69,900
-
1999-08-03soldstatus $47,000
-
1999-04-19$49,900
ⓘ Source: listings_history table (triggers on properties + properties_extension) + one-shot
backfill from property_details.listing_events for pre-trigger history.
Tax reassessment forecast MN · Partial reset (capped growth)
- Current annual tax
- $1,094 · $91/mo
- Projected year-2 tax
- $1,094 · $91/mo
- Expected delta
- $0/yr ($0/mo · 0.0%)
ⓘ Screening estimate from a state-policy table — verify with the county assessor before closing.
Climate risk First Street
- Flood 1/10 Low FEMA zone X (unshaded) · 0% chance over 30 yrs
- Wildfire 1/10 Low
- Heat 1/10 Low 7 d/yr ≥98°F today · 16 d/yr by 30 yrs out
- Wind 2/10 Low
- Air quality 1/10 Low 0 unhealthy d/yr today · 0 by 30 yrs out
Nearby sold comps map
Loading sold comps map…
Walkable amenities ~0.75 mi
Loading nearby amenities…
Taxation est. · year 1
- Rental income
- $15,718
- − Mortgage interest
- −$3,859
- − Property taxes
- −$1,094
- − Insurance
- −$344
- − Repairs & maintenance
- −$1,257
- − Management
- −$1,257
- − Depreciation
- −$2,004
- Taxable income
- $5,901
- Est. tax owed @ 24.0%
- −$1,416
- After-tax cash flow
- $5,227/yr
For passive investors: Depreciation is non-cash, so a rental often shows a tax loss while cash-flowing — sheltering income. Rental losses are passive: they offset passive income freely, and up to $25,000/yr can offset ordinary (W-2) income if you actively participate and your MAGI is under $100k (phasing out to $0 by $150k); unused losses carry forward. On sale, claimed depreciation is recaptured at up to 25%, and gains may owe capital-gains tax (a 1031 exchange can defer both). Figures are a year-1 estimate at your 24.0% rate — not tax advice; consult a CPA.
Schools (NCES district)
- District
- Austin Public School District
- NCES district ID
- 2703450
- Math proficiency
- 24% ▼ -12.00%
- Reading proficiency
- 34% ▼ -9.00%
- Median HH income
- $43,818
- Composite
- 24.75/100
- National rank
- #7604
- State rank
- #267 of 301 in MN
Livability — Austin
- Score
- 80/100
- State rank
- #77
- US rank
- #1829
Category grades
Schools grade is shown separately in the Schools card above.
Census & demographics
- Census place
- Austin, MN
- County
- Mower County · 29,632 people
- City population
- 29,632
- Metro
- Austin, MN
- Population (ZIP)
- 29,632
- Household income
- $70,177
- Rent vs Own
- Severe rent burden
- 759.0
Population outlook (Mower County) Hauer SSP2
- Today (2025)
- 39,967 people
- By 2030
- 40,204 · +0.6%
- By 2040
- 40,509 · +1.4%
- By 2050
- 40,841 · +2.2%
- By 2075
- 42,029 · +5.2%
- By 2100
- 42,272 · +5.8%
Race, ethnicity, and origin ACS 2023
- Neighborhood character
- Predominantly White (67%)
- Race & ethnicity
- White 67% Hispanic / Latino 16% Asian 8% Two or more races 7% Black 5%
- Hispanic origin (detail)
- Mexican 12%
- Common ancestry
- Portuguese 16% Lithuanian 2% Iranian 2%
- Foreign-born
- 15% · Canada, Philippines, China
- Languages at home
- 76% English-only · Spanish 14% Other Asian/Pacific 5% German/W. Germanic 1%
Political lean MEDSL · Mower
- 2024 margin
- R (+10.5) · D 43.9% · R 54.4% · Other 1.7%
- 2008→2024 swing
- -34.1pp toward R · 2008: 23.6pp · 2024: -10.5pp
- All cycles
- 2024: R+10.5 2020: R+5.8 2016: R+7.8 2012: D+22.7 2008: D+23.6
Not yet ingested
- Civics
- —
Market trends
- HPI YoY
- ▼ -142.60%
- Current HPI
- 271.4199
- Rent YoY
- ▲ 11.62%
- Metro
- Austin, MN
- State GDP YoY
- ▲ 2.41%
- F500 in state
- 34
Industry mix (Fortune 500 HQ in MN)
| Industry | F500 HQs | Revenue |
|---|---|---|
| Healthcare | 2 | $407B |
|
||
| Retail | 2 | $150B |
|
||
| Consumer Goods | 2 | $32B |
|
||
| Industrial Machinery | 2 | $6B |
|
||
| Agriculture | 1 | $40B |
|
||
| Healthcare / Medical Devices | 1 | $32B |
|
||
Price history
+38.1% since first listed9 events — show timeline
- 2026-05-22 Listed $68,900 NORTHSTARMLS as Distributed by MLS Grid
- 2007-03-30 Sold (MLS) $70,785 NORTHSTARMLS as Distributed by MLS Grid
- 2006-11-22 Listed $70,535 NORTHSTARMLS as Distributed by MLS Grid
- 2006-05-31 Sold (MLS) $56,500 NORTHSTARMLS as Distributed by MLS Grid
- 2006-05-26 Sold (Public Records) $56,500 Public Records
- 2006-01-09 Listed $59,900 NORTHSTARMLS as Distributed by MLS Grid
- 2005-10-14 Listed $69,900 NORTHSTARMLS as Distributed by MLS Grid
- 1999-08-03 Sold (MLS) $47,000 NORTHSTARMLS as Distributed by MLS Grid
- 1999-04-19 Listed $49,900 NORTHSTARMLS as Distributed by MLS Grid
Property tax history
+9.7%/yrLatest (2025): $1,094 · +8.3% YoY. Source: county tax records.
Cash-flow waterfall
monthlySold comps — $/sqft
last 12 mo · ≤1 miLoading sold comps…