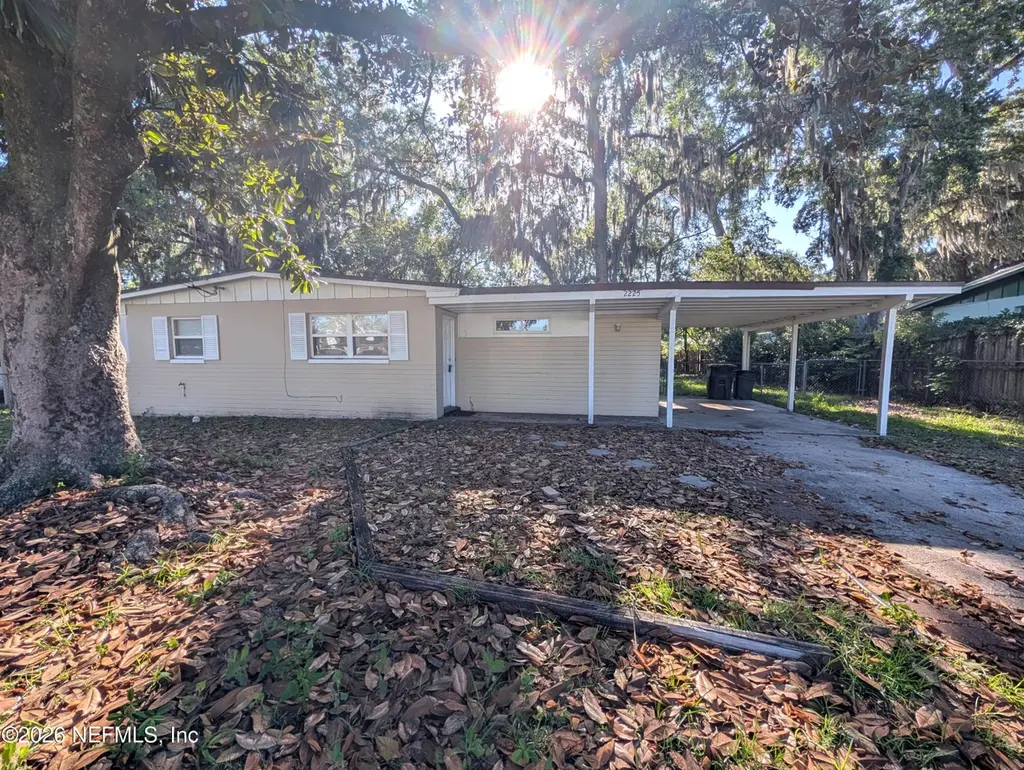
2225 Thiervy Dr · Jacksonville, FL
Flood risk 1/10 · Minimal
- FEMA flood zone
- X (unshaded)
- Chance of flooding over 30 yrs
- 0.0%
- Est. flood insurance / yr
- $507 – $1,088
Fire risk 5/10 · Moderate
- Est. fire insurance / yr
- $947 – $1,759
Heat risk 8/10 · Major
- Hot days now (above 108°F)
- 7 days/yr
- Hot days in 30 yrs
- 20 days/yr
Wind risk 9/10 · Severe
- Chance of severe wind over 30 yrs
- 99.0%
Air-quality risk 5/10 · Moderate
- Unhealthy air days now
- 6 days/yr
- Unhealthy air days in 30 yrs
- 7 days/yr
Risk factors via First Street. Map © Google.
Why this score? — see what drove the D grade
The composite is a weighted blend of 9 inputs, each scored 0–100. Each bar is that input's sub-score; the figure is the points it added to the 100-point composite (weight × sub-score).
- Cash flow +12.3/30.0
- ARV discount +10.5/15.0
- Livability +4.2/5.0
- Schools +3.9/10.0
- DSCR +3.6/10.0
- 1% rule +3.4/10.0
- Rent growth +3.0/5.0
- Condition / age +2.5/5.0
- Appreciation +0.0/10.0
$195,000
🖨 Deal sheet (PDF) 📄 Offer letter ✓ Due diligence
Listing remarks MLS
Cute freshly painted house in quiet neighborhood. A/c replaced in 2000. Whole house fan in the hallway. Laminate and tile floors. Fenced backyard. Great home for first time home buyer or rental for investor.
Key facts
- Central hvac
- Open dining area
- Large shady lot
Tags
Property features AI
Finance
- HOA & community: Not a senior community
Exterior
- Parking: Attached 1-car carport; Off-street parking
- Utilities: Cable available; Sewer connected; Water connected
- Home design: Single family residence; One story
- Construction: Shingle roof
- Exterior features: Backyard fence
Interior
- Kitchen: Dishwasher; Electric cooktop; Electric oven; Electric water heater
- Bedrooms: 3 bedrooms
- Flooring: Carpet; Tile
- Bathrooms: 2 full bathrooms
- Heating & cooling: Central heating; Central air conditioning
- Interior features: Ceiling fans; Primary bathroom with shower (no tub)
- Laundry & utility: Washer hookup; Electric dryer hookup
Neighborhood map
What this means for you Summary
Snapshot
- This is a 3-bed/2.0-bath single-family listed at $195k.
Deal economics
- At list price, monthly cash flow is $-36 ($-432/yr) — negative.
- To cash-flow at today's rent, offer at most $189k (3.3% below list).
- To meet the 1% rule (rent ≥ 1% of price), the offer needs to be $164k (16.0% below list).
- Recommended offer: $164k (16.0% below list) — sets the bar for 1% rule.
- Cap rate 6.1% vs local median 3.9% in Jacksonville — top-decile yield for the area; either an underpriced asset or a hidden risk that comps aren't pricing in. Stress-test before assuming the spread holds.
Location & tenants
- Location reads 83/100 on livability (#50 in FL, #911 nationally) — a professional / high-income tenant draw. Strengths: amenities A+, commute A+, housing A+.
- Duval (urban): math 46% / reading 45% proficiency, ranked #48 of 73 in FL (top 66%) — families likely to look elsewhere, expect single-tenant / working-renter base with shorter leases.
- Zoned schools: Normandy Village Elementary School (math 37% / reading 32%, grade F, #1,709 of 2,144 statewide, top 81%, 495 students, 78% FRL); Charger Academy (math 33% / reading 26%, grade F, #469 of 571 statewide, top 84%, 961 students, 71% FRL); Edward H. White High School (math 31% / reading 25%, grade F, #464 of 667 statewide, top 70%, 1,538 students, 64% FRL) — zoned schools average 71% FRL vs 49% district-wide (22 pts higher); higher-poverty schools than district average — tighter screening recommended.
- Zoned-school proficiency averages 31% at this address vs 46% district-wide (-15 pts) — the specific schools serving this property underperform the Duval average; the district grade overstates school quality for this exact location.
- Market conditions: Rents rising (+2.1%/yr); 441 active listings in the ZIP; 40 comparable units currently listed for rent nearby; rentals at typical pace (median 16d on market — plan ~3-4 weeks tenant-placement turnaround); 6,503 units permitted in Duval County in 2024 (1,131 in 5+ unit buildings).
Forward outlook
- Local home prices are declining (-3.0%/yr); year-one equity from $1k of loan paydown is wiped out by about $6k of value loss. Plan a longer hold.
- Duval County population projected at +19% by 2050 — long-run rental-demand tailwind backs the buy-and-hold thesis.
Negotiation context
- It's been on market 16 days — a 2% lower offer ($192k) is reasonable based on typical stale-listing flexibility.
- 6 sale attempts since 21y ago with the ask held roughly flat each time — persistent listings suggest the price (not the market) is what's stuck; bring a comps-based counter.
- Current owner paid $76k; list at $195k implies a 155% gain — meaningful room to come down on a strong offer.
Risks & watch-outs
- Watch-outs: built in 1959 — expect roof / HVAC / electrical / plumbing capex.
- Climate carrying-cost: severe wind risk, 99% chance of damaging wind over 30y; moderate wildfire risk; extreme-heat days projected 7→20/yr by 2055 (HVAC capex compounding) — expect insurance premiums to compound above CPI over the hold.
Questions for the listing agent
- What do current leases actually rent for vs. the listed asking? Can we see a recent rent roll and the last 12 months of T-12 income?
- Built in 1959 — when were the roof, HVAC, electrical panel, plumbing, and water heater last replaced?
- Is there a deadline driving the sale (1031 exchange, divorce, estate, relocation)? That informs how much negotiation room exists.
- Schools are B-rated — typically a magnet for longer-tenancy family renters. What's the average tenant stay here, and is there a school-zone premium baked into asking?
- The area grade is low — what's the realistic commute time and amenity access for the typical tenant pool here? Any planned neighborhood developments (good or bad) we should know about?
- What's the average days-on-market for RENTAL listings here right now (not sales)? A rising rental-DOM trend means longer vacancies and softer asking-rent achievability than the comps imply.
- What's the recent tenant-quality profile in this submarket — average credit score on applications, eviction rate, late-payment / NSF rate, and stable-employment percentage? A property-management company in the area should have these aggregated.
- How much new for-sale + rental construction is in the pipeline within 1–3 miles? Heavy new supply typically softens prices + rents 12–24 months out; constrained supply supports both.
Investment metrics
- 1% rule
- 0.84% ✗
- Cap rate
- 6.07%
- Cash-on-cash
- -0.79%
- DSCR
- 0.96
- GRM
- 9.9
CMA / ARV
- ARV (on-the-fly)
- $209,160
- Comps found
- 12
Show comp detail 12 sales within ~0.75 mi
| Address | Dist | Beds/Ba | Sqft | Sold | Price | $/sf | Match |
|---|---|---|---|---|---|---|---|
| 2505 W Lourdes Dr | 0.34mi | 3/1.0 | 1,275 (+1%) | 3mo | $133,000 | $104 | 76 |
| 2377 Winterwood Cir E | 0.30mi | 3/2.0 | 1,369 (+9%) | 0mo | $269,000 | $196 | 72 |
| 2204 Patou Dr W | 0.14mi | 3/1.0 | 1,388 (+10%) | 2mo | $189,900 | $137 | 71 |
| 7943 Lorient Dr | 0.14mi | 4/2.0 (+1) | 1,374 (+9%) | 8mo | $216,000 | $157 | 67 |
| 8256 Justin Rd N | 0.39mi | 3/2.0 | 1,144 (-9%) | 2mo | $187,900 | $164 | 65 |
| 7987 Winterwood Ln | 0.13mi | 3/2.0 | 1,089 (-14%) | 8mo | $225,000 | $207 | 65 |
| 8124 Jeanwood Dr | 0.49mi | 4/2.0 (+1) | 1,328 (+5%) | 3mo | $238,500 | $180 | 61 |
| 2141 Monteau Dr | 0.31mi | 4/2.0 (+1) | 1,398 (+11%) | 3mo | $190,000 | $136 | 60 |
| 8043 Joffre Dr | 0.22mi | 3/1.0 | 1,075 (-15%) | 3mo | $119,900 | $112 | 58 |
| 2644 W Kenwood Dr | 0.58mi | 4/2.0 (+1) | 1,328 (+5%) | 7mo | $220,000 | $166 | 53 |
| 2683 Glory Trl | 0.63mi | 3/2.0 | 1,397 (+11%) | 5mo | $243,000 | $174 | 48 |
| 8055 Stargrass Ct | 0.72mi | 3/2.0 | 1,410 (+12%) | 2mo | $269,000 | $191 | 45 |
Match score weights: distance 35% · size 25% · config 20% · recency 20%. Top-matched comps best support the ARV.
Projected returns pro-forma
-3.0% appreciation · 2.11% rent growth · sell at horizon
- IRR
- -18.6%
- Equity multiple
- 0.35×
- Total profit
- $-35,330
- Equity at exit
- $29,075
- IRR
- -12.8%
- Equity multiple
- 0.28×
- Total profit
- $-39,519
- Equity at exit
- $16,860
Cash invested: $54,600 (down + closing). Projections, not guarantees.
Landlord ↔ Tenant lean methodology
- Overall (STATE)
- 87 Strongly Landlord-Friendly
- State Florida
- 87 Strongly Landlord-Friendly · R+3
- County
- — inherits STATE
- City
- — inherits STATE
ZIP-level market 32210
- Rents YoY
- 2.1%
- Active inventory
- 441
- Price-to-rent
- 9.9×
Monthly cashflow live
- Estimated rent
- $1,637 high interval (Pro) →
- Mortgage (P&I)
- −$1,023
- Tax from tax record
- −$226 /mo · $2,709/yr
- Insurance
- −$81
- HOA
- −$0
- Vacancy / Maint / Mgmt
- −$344
- Net cashflow
- $-36
Break-even live
Sensitivity live
| Price | -10% $74 | -5% $19 | +0% $-36 | +5% $-91 | +10% $-146 |
|---|---|---|---|---|---|
| Rent | -10% $-165 | -5% $-101 | +0% $-36 | +5% $29 | +10% $93 |
| Rate | -1.0pp $62 | -0.5pp $14 | base $-36 | +0.5pp $-87 | +1.0pp $-138 |
UW: 25.0% down · 7.5% · 30yr · 1.5% tax · 5.0% vac · 8.0% maint · 8.0% mgmt
Financing live
Cash to close
- Down payment
- $48,750
- Closing costs
- $5,850
- Reserves months
- —
- Total cash needed
- —
Loan-product check · same deal, 3 products live
Conventional
25% down · 7.5% · 30yr
- Down + closing
- —
- Monthly P&I
- —
- Monthly cashflow
- —
- DSCR
- —
- Eligible?
- —
Personal DTI + credit; lowest rate.
DSCR
20% down · 8.5% · 30yr
- Down + closing
- —
- Monthly P&I
- —
- Monthly cashflow
- —
- DSCR
- —
- Eligible?
- —
No personal income docs; deal must DSCR.
Hard money
10% down · 12.0% · 12mo
- Down + closing
- —
- Monthly P&I
- —
- Monthly cashflow
- —
- DSCR
- —
- Eligible?
- —
Short-term bridge; refi at stabilization.
Rent comps 40 comps
| Address | Beds | Baths | Sqft | Rent | $/sqft | DOM | Units | Dist |
|---|---|---|---|---|---|---|---|---|
| 2225 Corot Dr Jacksonville, FL | 4.0 | 2.0 | 1330 | $1,596 | $1.20 | 15d | 1 | 0.19mi |
| 7963 Lemans Dr Jacksonville, FL | 3.0 | 1.5 | 1068 | $1,349 | $1.26 | 25d | 1 | 0.21mi |
| 2248 Patou Dr Jacksonville, FL | 4.0 | 1.0 | 1338 | $1,625 | $1.21 | 22d | 1 | 0.22mi |
| 2145 Bourget Dr Jacksonville, FL | 4.0 | 2.0 | 1174 | $1,595 | $1.36 | 9d | 1 | 0.25mi |
| 2433 Justin Rd E Jacksonville, FL | 3.0 | 2.0 | 1540 | $1,745 | $1.13 | 15d | 1 | 0.29mi |
| 2141 Monteau Dr Jacksonville, FL | 4.0 | 2.0 | 1398 | $1,600 | $1.14 | 25d | 1 | 0.31mi |
| 2419 Winterwood Cir E Jacksonville, FL | 3.0 | 2.0 | 1530 | $1,715 | $1.12 | 22d | 1 | 0.31mi |
| 2444 Justin Rd E Jacksonville, FL | 3.0 | 2.0 | 1124 | $1,393 | $1.24 | 25d | 1 | 0.32mi |
| 2505 Lourdes Dr W Jacksonville, FL | 3.0 | 2.0 | 1300 | $1,850 | $1.42 | 25d | 1 | 0.34mi |
| 2002 Constant Dr Jacksonville, FL | 3.0 | 1.0 | 1038 | $1,580 | $1.52 | 6d | 1 | 0.36mi |
| 1936 Constant Dr Jacksonville, FL | 3.0 | 2.0 | 1124 | $1,645 | $1.46 | 25d | 1 | 0.39mi |
| 8001 Ridgehill View Rd Jacksonville, FL | 4.0 | 2.0 | 1526 | $1,845 | $1.21 | 12d | 1 | 0.39mi |
| 2050 Monteau Dr Jacksonville, FL | 4.0 | 2.0 | 1178 | $1,348 | $1.14 | 18d | 1 | 0.41mi |
| 8240 Pear Rd Jacksonville, FL | 3.0 | 2.0 | 1182 | $1,595 | $1.35 | 12d | 1 | 0.42mi |
| 8267 Pear Rd Jacksonville, FL | 3.0 | 2.0 | 1120 | $1,550 | $1.38 | 25d | 1 | 0.45mi |
| 7705 Peace Ln Jacksonville, FL | 3.0 | 2.0 | 1849 | $2,100 | $1.14 | 5d | 1 | 0.49mi |
| 8255 Yolanda Ct Jacksonville, FL | 4.0 | 2.0 | 1658 | $1,595 | $0.96 | 25d | 1 | 0.55mi |
| 2584 Spring Lake Rd Jacksonville, FL | 4.0 | 2.0 | 1298 | $2,300 | $1.77 | 5d | 1 | 0.58mi |
| 8252 Yolanda Ct Jacksonville, FL | 3.0 | 2.0 | 1306 | $1,789 | $1.37 | 4d | 1 | 0.58mi |
| 7810 Spring Branch Dr S Jacksonville, FL | 3.0 | 2.0 | 1284 | $1,960 | $1.53 | 3d | 1 | 0.81mi |
| 3775 Spring Lake Rd Jacksonville, FL | 3.0 | 2.0 | 1456 | $1,900 | $1.30 | 25d | 1 | 0.82mi |
| 7178 Conant Ave Jacksonville, FL | 2.0 | 1.0 | 996 | $1,000 | $1.00 | 19d | 1 | 0.88mi |
| 2512 Sadler Trace Way Jacksonville, FL | 3.0 | 2.5 | 1404 | $1,750 | $1.25 | 25d | 1 | 0.90mi |
| 7233 Eudine Dr S Jacksonville, FL | 3.0 | 1.5 | 884 | $1,345 | $1.52 | 5d | 1 | 0.91mi |
| 2528 Sadler Trace Way Unit 1 Jacksonville, FL | 3.0 | 2.5 | 1404 | $2,000 | $1.42 | 18d | 1 | 0.92mi |
| 2528 Sadler Trace Way Jacksonville, FL | 3.0 | 2.5 | 1404 | $2,000 | $1.42 | 25d | 1 | 0.92mi |
| 7188 Koleda Dr Jacksonville, FL | 4.0 | 2.0 | 1473 | $1,327 | $0.90 | 4d | 1 | 0.94mi |
| 3620 Kirkpatrick Cir #4 Jacksonville, FL | 2.0 | 2.0 | 1118 | $1,175 | $1.05 | 16d | 1 | 0.97mi |
| 3620 Kirkpatrick Cir #4 Jacksonville, FL | 2.0 | 2.0 | 1118 | $1,250 | $1.12 | 19d | 1 | 0.97mi |
| 7147 Eudine Dr N Jacksonville, FL | 3.0 | 2.0 | 1456 | $1,585 | $1.09 | 25d | 1 | 0.99mi |
| 7152 Koleda Dr Jacksonville, FL | 4.0 | 1.0 | 1110 | $1,300 | $1.17 | 16d | 1 | 0.99mi |
| 7152 Koleda Dr Jacksonville, FL | 3.0 | 1.0 | 1110 | $1,300 | $1.17 | 5d | 1 | 0.99mi |
| 3631 Kirkpatrick Cir Jacksonville, FL | 2.0–3.0 | 2.0 | 1137 | $1,350 | $1.19 | 9d | 2 | 1.01mi |
| 2234 Firestone Rd Jacksonville, FL | 4.0 | 2.0 | 1110 | $2,000 | $1.80 | 16d | 1 | 1.04mi |
| 7655 Mailes Ct Jacksonville, FL | 2.0 | 2.0 | 1040 | $1,365 | $1.31 | 6d | 2 | 1.04mi |
| 7655 Mailes Ct Jacksonville, FL | 2.0 | 2.0 | 1040 | $1,365 | $1.31 | 9d | 1 | 1.04mi |
| 7619 Mailes Ct Jacksonville, FL | 2.0 | 2.0 | 1040 | $1,365 | $1.31 | 6d | 1 | 1.07mi |
| 7656 Mailes Ct Unit 202 Jacksonville, FL | 2.0 | 2.0 | 1040 | $1,225 | $1.18 | 25d | 1 | 1.07mi |
| 7650 Mailes Ct #101 Jacksonville, FL | 2.0 | 2.0 | 1051 | $1,200 | $1.14 | 25d | 1 | 1.08mi |
| 7076 Queen of Hearts Ct Jacksonville, FL | 3.0 | 2.0 | 1131 | $1,500 | $1.33 | 16d | 1 | 1.08mi |
Listing history 11 events
-
2026-06-21days on market $195,000 Active 16 DOM
-
2026-06-18days on market $195,000 Active 13 DOM
-
2026-06-17days on market $195,000 Active 12 DOM
-
2026-06-16days on market $195,000 Active 11 DOM
-
2026-06-15days on market $195,000 Active 10 DOM
-
2026-06-13days on market $195,000 Active 8 DOM
-
2026-06-13days on market $195,000 Active 7 DOM
-
2026-06-09days on market $195,000 Active 4 DOM
-
2026-06-08days on market $195,000 Active 3 DOM
-
2026-06-07remarks 502-char remark
-
2026-06-07$195,000 Active 2 DOM
ⓘ Source: listings_history table (triggers on properties + properties_extension) + one-shot
backfill from property_details.listing_events for pre-trigger history.
Tax reassessment forecast FL · Resets to sale price
- Current annual tax
- $2,709 · $226/mo
- Projected year-2 tax
- $2,709 · $226/mo
- Expected delta
- $0/yr ($0/mo · 0.0%)
ⓘ Screening estimate from a state-policy table — verify with the county assessor before closing.
Climate risk First Street
- Flood 1/10 Low FEMA zone X (unshaded) · 0% chance over 30 yrs
- Wildfire 5/10 Major
- Heat 8/10 Severe 7 d/yr ≥108°F today · 20 d/yr by 30 yrs out
- Wind 9/10 Extreme 99% chance of damaging wind over 30 yrs
- Air quality 5/10 Major 6 unhealthy d/yr today · 7 by 30 yrs out
Nearby sold comps map
Loading sold comps map…
Walkable amenities ~0.75 mi
Loading nearby amenities…
Taxation est. · year 1
- Rental income
- $19,650
- − Mortgage interest
- −$10,923
- − Property taxes
- −$2,709
- − Insurance
- −$975
- − Repairs & maintenance
- −$1,572
- − Management
- −$1,572
- − Depreciation
- −$5,673
- Taxable loss
- −$3,774
- Est. tax savings @ 24.0%
- +$906
- After-tax cash flow
- $474/yr
For passive investors: Depreciation is non-cash, so a rental often shows a tax loss while cash-flowing — sheltering income. Rental losses are passive: they offset passive income freely, and up to $25,000/yr can offset ordinary (W-2) income if you actively participate and your MAGI is under $100k (phasing out to $0 by $150k); unused losses carry forward. On sale, claimed depreciation is recaptured at up to 25%, and gains may owe capital-gains tax (a 1031 exchange can defer both). Figures are a year-1 estimate at your 24.0% rate — not tax advice; consult a CPA.
Schools (NCES district)
- District
- Duval
- NCES district ID
- 1200480
- Math proficiency
- 46% ▼ -11.00%
- Reading proficiency
- 45% ▼ -4.00%
- Median HH income
- $48,987
- Composite
- 38.97/100
- National rank
- #4076
- State rank
- #48 of 73 in FL
Livability — Jacksonville
- Score
- 83/100
- State rank
- #50
- US rank
- #911
Category grades
Schools grade is shown separately in the Schools card above.
Census & demographics
- Census place
- Jacksonville, FL
- County
- Duval County · 1,015,274 people
- City population
- 979,034
- Metro
- Jacksonville, FL
- Population (ZIP)
- 65,729
- Household income
- $61,050
- Rent vs Own
- Severe rent burden
- 3605.0
Population outlook (Duval County) Hauer SSP2
- Today (2025)
- 1,013,010 people
- By 2030
- 1,059,228 · +4.6%
- By 2040
- 1,141,439 · +12.7%
- By 2050
- 1,205,258 · +19.0%
- By 2075
- 1,324,282 · +30.7%
- By 2100
- 1,319,620 · +30.3%
Race, ethnicity, and origin ACS 2023
- Neighborhood character
- Diverse neighborhood (Simpson 0.65)
- Race & ethnicity
- White 43% Black 38% Hispanic / Latino 10% Two or more races 7% Asian 3%
- Hispanic origin (detail)
- Mexican 3% Puerto Rican 3%
- Common ancestry
- Slovak 2% Hispanic 2% Italian 1%
- Foreign-born
- 10% · Canada, Vietnam, China
- Languages at home
- 86% English-only · Spanish 7% French/Haitian/Cajun 2% Tagalog/Filipino 1%
Political lean MEDSL · Duval
- 2024 margin
- Toss-up / Even · D 48.7% · R 50.1% · Other 1.2%
- 2008→2024 swing
- +0.4pp no change · 2008: -1.9pp · 2024: -1.5pp
- All cycles
- 2024: R+1.5 2020: D+3.8 2016: R+1.5 2012: R+3.6 2008: R+1.9
Not yet ingested
- Civics
- —
Market trends
- HPI YoY
- ▼ -314.81%
- Current HPI
- 281.2688
- Rent YoY
- ▲ 2.11%
- Metro
- Jacksonville, FL
- State GDP YoY
- ▲ 3.28%
- F500 in state
- 36
Industry mix (Fortune 500 HQ in FL)
| Industry | F500 HQs | Revenue |
|---|---|---|
| Industrial Technology | 2 | $29B |
|
||
| Insurance | 2 | $17B |
|
||
| Retail | 1 | $60B |
|
||
| Technology Distribution | 1 | $58B |
|
||
| Homebuilding | 1 | $35B |
|
||
| Technology Manufacturing | 1 | $35B |
|
||
Price history
+695.9% since first listed19 events — show timeline
- 2026-06-03 Listed $195,000 realMLS
- 2022-06-22 Price Changed $1,250 RENT.
- 2017-05-02 Sold (Public Records) $76,500 Public Records
- 2017-04-26 Sold (MLS) $76,500 realMLS
- 2017-04-05 Pending — realMLS
- 2017-04-04 Listed $99,500 realMLS
- 2010-01-25 Listing Removed — realMLS
- 2010-01-23 Sold (MLS) $45,101 realMLS
- 2009-12-30 Listed $32,000 realMLS
- 2009-10-29 Listing Removed — realMLS
- 2009-02-03 Listed $95,000 realMLS
- 2006-05-10 Sold (Public Records) $134,000 Public Records
- 2006-05-06 Listing Removed — realMLS
- 2006-05-04 Sold (MLS) $134,000 realMLS
- 2006-04-19 Listing Removed — realMLS
- 2006-02-06 Listed $129,900 realMLS
- 2005-10-19 Listed $134,900 realMLS
- 2005-09-29 Sold (Public Records) $95,000 Public Records
- 1978-02-17 Sold (Public Records) $24,500 Public Records
Property tax history
+7.9%/yrLatest (2025): $2,709 · +11.9% YoY. Source: county tax records.
Cash-flow waterfall
monthlySold comps — $/sqft
last 12 mo · ≤1 miLoading sold comps…