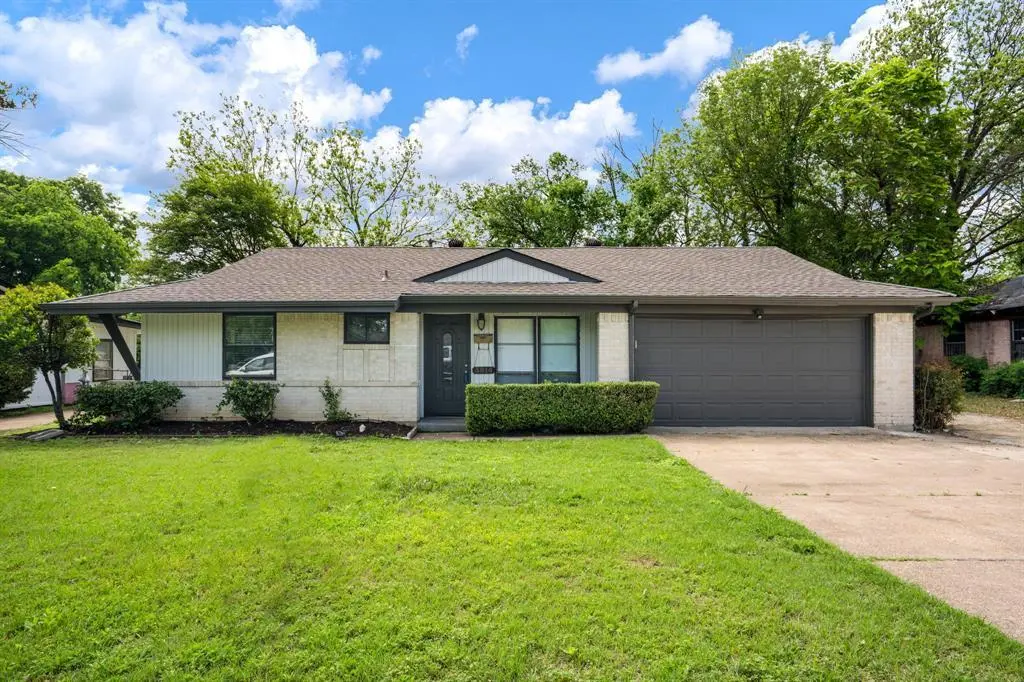
3814 Golden Hills Dr · Dallas, TX
Flood risk 1/10 · Minimal
- FEMA flood zone
- X (unshaded)
- Chance of flooding over 30 yrs
- 0.0%
- Est. flood insurance / yr
- $507 – $1,088
Fire risk 3/10 · Minor
- Est. fire insurance / yr
- $1,222 – $2,270
Heat risk 7/10 · Major
- Hot days now (above 110°F)
- 7 days/yr
- Hot days in 30 yrs
- 24 days/yr
Wind risk 6/10 · Moderate
- Chance of severe wind over 30 yrs
- 27.0%
Air-quality risk 2/10 · Minimal
- Unhealthy air days now
- 1 days/yr
- Unhealthy air days in 30 yrs
- 2 days/yr
Risk factors via First Street. Map © Google.
Why this score? — see what drove the D+ grade
The composite is a weighted blend of 9 inputs, each scored 0–100. Each bar is that input's sub-score; the figure is the points it added to the 100-point composite (weight × sub-score).
- Cash flow +13.6/30.0
- ARV discount +13.1/15.0
- 1% rule +5.0/10.0
- DSCR +4.1/10.0
- Livability +4.0/5.0
- Schools +2.8/10.0
- Condition / age +2.5/5.0
- Rent growth +1.8/5.0
- Appreciation +0.0/10.0
$180,000
🖨 Deal sheet (PDF) 📄 Offer letter ✓ Due diligence
Listing remarks
Updated 3-bedroom home on an oversized . 239-acre lot with a large backyard and 2-car garage. Light-filled living area features vaulted ceilings, wood-look flooring, and a painted brick fireplace. Kitchen offers white cabinetry, quartz countertops, stainless steel appliances, and a modern backsplash. Flexible space off the kitchen works as a home office, breakfast nook, or second living area. Primary bedroom includes a private half bath, with a full bath serving the secondary bedrooms. Conveniently located near Paul Quinn College with quick access to I-20 and I-45. Buyer to Purchase New Survey.
Key facts
- Quartz countertops
- Large backyard
- Oversized lot
Tags
Property features AI
Finance
- Other: Listing is Active Under Contract; Possession at closing/funding; Standard listing conditions
- Financial info: Accepts Cash, Conventional, FHA, and VA financing; No second mortgage indicated
- HOA & community: No association (no HOA)
Exterior
- Parking: Attached garage; Two garage spaces; Two covered parking spaces; Garage with automatic door opener; Garage approximately 19' wide by 22' long
- Security: Smoke detector(s)
- Utilities: City water; City sewer; Property not in a municipal utility district
- Home design: Single-family residence; One-story; Residential property in Highland Hills subdivision; Not attached to another property; Smoke detectors installed
- Construction: Built in 1960 (preowned); Brick and siding exterior; Composition roof; Slab foundation
- Exterior features: Chain link fencing; Lot under 0.5 acre (approx. 0.239 acres); Buyer to purchase new survey
Interior
- Kitchen: Built-in cabinets; Natural stone/granite counters; Gas oven; Gas range; Microwave
- Bedrooms: Three bedrooms total; Primary bedroom on main level (13 x 11); Bedroom on main level (10 x 10); Bedroom on main level (10 x 11)
- Flooring: Ceramic tile; Luxury vinyl plank
- Bathrooms: One full bathroom; One half bathroom (two total bathrooms)
- Heating & cooling: Central heating (natural gas); Central air conditioning; Ceiling fans; Electric cooling components
- Interior features: Six total rooms; Two living areas; One dining area; Fireplace (1) with unspecified type; Other interior features
- Laundry & utility: Washer hookup; Laundry area located in garage
Neighborhood map
What this means for you Summary
Snapshot
- This is a 3-bed/1.5-bath single-family listed at $180k.
Deal economics
- At list price, monthly cash flow is $10 ($119/yr) — positive.
- The deal already cash-flows at list — no discount required.
- To meet the 1% rule (rent ≥ 1% of price), the offer needs to be $179k (0.5% below list).
- Recommended offer: $177k (1.5% below list) — sets the bar for market timing.
- Cap rate 6.4% vs local median 2.3% in Dallas — top-decile yield for the area; either an underpriced asset or a hidden risk that comps aren't pricing in. Stress-test before assuming the spread holds.
Location & tenants
- Location reads 81/100 on livability (#24 in TX, #1,380 nationally) — a professional / high-income tenant draw. Strengths: amenities A+, commute A+, housing A+; Watch: crime F.
- Dallas ISD (urban): math 31% / reading 36% proficiency, ranked #559 of 826 in TX (top 68%) — families likely to look elsewhere, expect single-tenant / working-renter base with shorter leases; 83% free/reduced lunch — lower-income household profile, screen leases tightly.
- Zoned schools: J N Ervin El (math 17% / reading 20%, grade F, #3,759 of 4,322 statewide, top 88%, 646 students, 98% FRL).
- Zoned-school proficiency averages 18% at this address vs 34% district-wide (-15 pts) — the specific schools serving this property underperform the Dallas ISD average; the district grade overstates school quality for this exact location.
- Market conditions: Rents soft (-2.8%/yr); 218 active listings in the ZIP; 32 comparable units currently listed for rent nearby; rentals at typical pace (median 19d on market — plan ~3-4 weeks tenant-placement turnaround); 12,577 units permitted in Dallas County in 2024 (6,829 in 5+ unit buildings).
- This rent runs 40% of the median local income ($54k/yr) — at the standard rent-burdened threshold; future hikes will face affordability resistance.
Forward outlook
- Local home prices are declining (-3.0%/yr); year-one equity from $1k of loan paydown is wiped out by about $5k of value loss. Plan a longer hold.
- Dallas County population projected at +35% by 2050 — long-run rental-demand tailwind backs the buy-and-hold thesis.
Negotiation context
- It's been on market 24 days — a 2% lower offer ($177k) is reasonable based on typical stale-listing flexibility.
- 5 sale attempts since 6y ago with the ask held roughly flat each time — persistent listings suggest the price (not the market) is what's stuck; bring a comps-based counter.
Risks & watch-outs
- Watch-outs: property tax is 2.6% of price.
- Climate carrying-cost: major wind risk, 27% chance of damaging wind over 30y; extreme-heat days projected 7→24/yr by 2055 (HVAC capex compounding) — expect insurance premiums to compound above CPI over the hold.
Questions for the listing agent
- Built in 1960 — when were the roof, HVAC, electrical panel, plumbing, and water heater last replaced?
- Property tax is high relative to price — has the assessment been appealed recently, and will the sale trigger a re-assessment?
- Is there a deadline driving the sale (1031 exchange, divorce, estate, relocation)? That informs how much negotiation room exists.
- Crime grade is F in this area — have there been break-ins, vandalism, or insurance claims at this property in the last 3 years? What carrier currently insures it and at what premium?
- The area grade is low — what's the realistic commute time and amenity access for the typical tenant pool here? Any planned neighborhood developments (good or bad) we should know about?
- What's the average days-on-market for RENTAL listings here right now (not sales)? A rising rental-DOM trend means longer vacancies and softer asking-rent achievability than the comps imply.
- What's the recent tenant-quality profile in this submarket — average credit score on applications, eviction rate, late-payment / NSF rate, and stable-employment percentage? A property-management company in the area should have these aggregated.
- How much new for-sale + rental construction is in the pipeline within 1–3 miles? Heavy new supply typically softens prices + rents 12–24 months out; constrained supply supports both.
Investment metrics
- 1% rule
- 1.00% ✗
- Cap rate
- 6.36%
- Cash-on-cash
- 0.24%
- DSCR
- 1.01
- GRM
- 8.4
CMA / ARV
- ARV (on-the-fly)
- $205,530
- Comps found
- 8
Show comp detail 8 sales within ~0.75 mi
| Address | Dist | Beds/Ba | Sqft | Sold | Price | $/sf | Match |
|---|---|---|---|---|---|---|---|
| 3814 Golden Hills Dr | 0.00mi | 3/1.5 | 1,054 (0%) | 0mo | $180,000 | $171 | 100 |
| 3850 Basswood Dr | 0.15mi | 3/1.0 | 1,206 (+14%) | 9mo | $119,000 | $99 | 59 |
| 5815 Bluffman Dr | 0.29mi | 3/1.0 | 957 (-9%) | 13mo | $195,000 | $204 | 58 |
| 3855 Morningview Dr | 0.25mi | 3/1.0 | 966 (-8%) | 23mo | $210,000 | $217 | 53 |
| 4205 Firewood Dr | 0.66mi | 3/1.5 | 1,167 (+11%) | 9mo | $230,000 | $197 | 44 |
| 3945 Happy Canyon Dr | 0.53mi | 4/2.0 (+1) | 1,183 (+12%) | 11mo | $218,900 | $185 | 39 |
| 3810 Happy Canyon Dr | 0.65mi | 4/1.0 (+1) | 1,210 (+15%) | 11mo | $199,850 | $165 | 28 |
| 3923 Mehalia Dr | 0.67mi | 3/1.5 | 924 (-12%) | 24mo | $180,000 | $195 | 28 |
Match score weights: distance 35% · size 25% · config 20% · recency 20%. Top-matched comps best support the ARV.
Projected returns pro-forma
-3.0% appreciation · 0.0% rent growth · sell at horizon
- IRR
- -19.7%
- Equity multiple
- 0.33×
- Total profit
- $-33,661
- Equity at exit
- $26,839
- IRR
- -22.1%
- Equity multiple
- 0.04×
- Total profit
- $-48,278
- Equity at exit
- $15,563
Cash invested: $50,400 (down + closing). Projections, not guarantees.
Landlord ↔ Tenant lean methodology
- Overall (STATE)
- 87 Strongly Landlord-Friendly
- State Texas
- 87 Strongly Landlord-Friendly · R+5
- County
- — inherits STATE
- City
- — inherits STATE
ZIP-level market 75241
- Home prices YoY
- -16.9%
- Rents YoY
- -2.8%
- Active inventory
- 218
- Price-to-rent
- 8.4×
Monthly cashflow live
- Estimated rent
- $1,792 high interval (Pro) →
- Mortgage (P&I)
- −$944
- Tax from tax record
- −$387 /mo · $4,640/yr
- Insurance
- −$75
- HOA
- −$0
- Vacancy / Maint / Mgmt
- −$376
- Net cashflow
- $10
Break-even live
Sensitivity live
| Price | -10% $112 | -5% $61 | +0% $10 | +5% $-41 | +10% $-92 |
|---|---|---|---|---|---|
| Rent | -10% $-132 | -5% $-61 | +0% $10 | +5% $81 | +10% $151 |
| Rate | -1.0pp $101 | -0.5pp $56 | base $10 | +0.5pp $-37 | +1.0pp $-84 |
UW: 25.0% down · 7.5% · 30yr · 1.5% tax · 5.0% vac · 8.0% maint · 8.0% mgmt
Financing live
Cash to close
- Down payment
- $45,000
- Closing costs
- $5,400
- Reserves months
- —
- Total cash needed
- —
Loan-product check · same deal, 3 products live
Conventional
25% down · 7.5% · 30yr
- Down + closing
- —
- Monthly P&I
- —
- Monthly cashflow
- —
- DSCR
- —
- Eligible?
- —
Personal DTI + credit; lowest rate.
DSCR
20% down · 8.5% · 30yr
- Down + closing
- —
- Monthly P&I
- —
- Monthly cashflow
- —
- DSCR
- —
- Eligible?
- —
No personal income docs; deal must DSCR.
Hard money
10% down · 12.0% · 12mo
- Down + closing
- —
- Monthly P&I
- —
- Monthly cashflow
- —
- DSCR
- —
- Eligible?
- —
Short-term bridge; refi at stabilization.
Rent comps 32 comps
| Address | Beds | Baths | Sqft | Rent | $/sqft | DOM | Units | Dist |
|---|---|---|---|---|---|---|---|---|
| 3528 Keyridge Dr Dallas, TX | 3.0 | 2.0 | 1362 | $1,795 | $1.32 | 22d | 1 | 0.05mi |
| 3835 Basswood Dr Dallas, TX | 3.0 | 2.0 | 1000 | $1,625 | $1.62 | 25d | 1 | 0.14mi |
| 3806 Castle Hills Dr Dallas, TX | 4.0 | 2.0 | 1422 | $1,900 | $1.34 | 18d | 1 | 0.21mi |
| 5821 Bonnie View Rd Dallas, TX | 1.0–3.0 | 1.0–2.0 | 820 | $1,101 | $1.34 | 9d | 7 | 0.37mi |
| 5850 Highland Hills Dr Dallas, TX | 2.0–4.0 | 1.0–2.0 | 910 | $1,097 | $1.21 | 0d | 8 | 0.56mi |
| 5761 Highland Hills Dr Dallas, TX | 1.0–3.0 | 1.0–2.0 | 1040 | $1,749 | $1.68 | 5d | 7 | 0.63mi |
| 5175 Cardiff St Dallas, TX | 3.0 | 1.0 | 1248 | $1,650 | $1.32 | 45d | 1 | 0.73mi |
| 3130 Stag Rd Dallas, TX | 1.0–3.0 | 1.0–2.0 | 831 | $1,469 | $1.77 | 45d | 3 | 0.76mi |
| 5160 Cardiff St Dallas, TX | 4.0 | 2.0 | 1251 | $1,950 | $1.56 | 5d | 1 | 0.77mi |
| 3440 Simpson Stuart Rd Dallas, TX | 1.0–3.0 | 1.0–2.0 | 942 | $2,103 | $2.23 | 2d | 9 | 0.79mi |
| 3131 Simpson Stuart Rd Dallas, TX | 1.0–3.0 | 1.0–2.0 | 1024 | $1,694 | $1.65 | 0d | 31 | 0.86mi |
| 4281 Lava Forest Dr Dallas, TX | 3.0–5.0 | 2.0–2.5 | 1840 | $2,050 | $1.11 | 0d | 1 | 0.92mi |
| 6319 Crosswood Ln Dallas, TX | 3.0 | 2.0 | 1316 | $2,060 | $1.57 | 21d | 1 | 0.93mi |
| 6347 Racer Summit Dr Dallas, TX | 3.0 | 2.0 | 1175 | $1,965 | $1.67 | 25d | 1 | 0.97mi |
| 2703 Kool Ave Dallas, TX | 3.0 | 2.0 | 1248 | $1,700 | $1.36 | 25d | 1 | 1.02mi |
| 2602 Ripple Rd Dallas, TX | 3.0 | 2.0 | 1232 | $1,700 | $1.38 | 45d | 1 | 1.03mi |
| 3623 Softcloud Dr Dallas, TX | 3.0 | 2.0 | 1477 | $1,910 | $1.29 | 45d | 1 | 1.09mi |
| 3460 South Loop 12 Dallas, TX | 3.0 | 2.0 | 1048 | $1,350 | $1.29 | 25d | 1 | 1.11mi |
| 3460 South Loop 12 Dallas, TX | 2.0 | 1.5 | 867 | $1,150 | $1.33 | 7d | 1 | 1.11mi |
| 3460 South Loop 12 Dallas, TX | 1.0–2.0 | 1.0–1.5 | 758 | $1,150 | $1.52 | 14d | 2 | 1.11mi |
| 3035 E Ledbetter Dr Dallas, TX | 1.0–2.0 | 1.0 | 643 | $1,275 | $1.98 | 5d | 1 | 1.11mi |
| 6445 Baraboo Dr Dallas, TX | 4.0 | 1.5 | 1218 | $1,650 | $1.35 | 45d | 1 | 1.11mi |
| 3015 E Ledbetter Dr Dallas, TX | 2.0–3.0 | 2.0 | 1030 | $1,475 | $1.43 | 5d | 1 | 1.12mi |
| 2520 Fatima Ave Dallas, TX | 3.0 | 2.0 | 1176 | $1,950 | $1.66 | 9d | 1 | 1.18mi |
| 2751 E Ledbetter Dr Dallas, TX | 1.0–3.0 | 1.0–1.5 | 794 | $1,410 | $1.78 | 45d | 3 | 1.19mi |
| 4836 Sunnyvale St Dallas, TX | 1.0–3.0 | 1.0–2.0 | 515 | $1,512 | $2.94 | 45d | 7 | 1.22mi |
| 4140 Wilshire Blvd Dallas, TX | 3.0 | 2.0 | 1125 | $1,795 | $1.60 | 19d | 1 | 1.33mi |
| 2525 Lyola St Dallas, TX | 3.0 | 2.0 | 1080 | $1,895 | $1.75 | 45d | 1 | 1.37mi |
| 6327 Hidden Trail Dr Dallas, TX | 3.0 | 2.0 | 1187 | $1,795 | $1.51 | 45d | 1 | 1.37mi |
| 6436 Moonhill Dr Dallas, TX | 4.0 | 2.0 | 1200 | $1,961 | $1.63 | 3d | 1 | 1.41mi |
| 3522 Tioga St Dallas, TX | 4.0 | 3.0 | 1438 | $2,095 | $1.46 | 0d | 1 | 1.47mi |
| 3522 Tioga St Dallas, TX | 4.0 | 3.0 | 1438 | $2,095 | $1.46 | 5d | 1 | 1.47mi |
Listing history 16 events
-
2026-05-14status Pending
-
2026-05-06historical Active Option Contract
-
2026-05-06status Active
-
2026-04-26historical Active Option Contract
-
2026-04-20$180,000 Active
-
2024-01-20historical $1,595
-
2024-01-12$1,595
-
2023-10-17historical $1,595
-
2023-09-30price $1,595
-
2023-09-21price $1,625
-
2023-08-19$1,675
-
2020-12-31soldstatus
-
2020-12-07historical
-
2020-12-07$145,000 Active
-
2020-10-14soldstatus
-
1960-12-02soldstatus
ⓘ Source: listings_history table (triggers on properties + properties_extension) + one-shot
backfill from property_details.listing_events for pre-trigger history.
Tax reassessment forecast TX · Resets to sale price
- Current annual tax
- $4,640 · $387/mo
- Projected year-2 tax
- $4,640 · $387/mo
- Expected delta
- $0/yr ($0/mo · 0.0%)
ⓘ Screening estimate from a state-policy table — verify with the county assessor before closing.
Climate risk First Street
- Flood 1/10 Low FEMA zone X (unshaded) · 0% chance over 30 yrs
- Wildfire 3/10 Moderate
- Heat 7/10 Severe 7 d/yr ≥110°F today · 24 d/yr by 30 yrs out
- Wind 6/10 Major 27% chance of damaging wind over 30 yrs
- Air quality 2/10 Low 1 unhealthy d/yr today · 2 by 30 yrs out
Nearby sold comps map
Loading sold comps map…
Walkable amenities ~0.75 mi
Loading nearby amenities…
Taxation est. · year 1
- Rental income
- $21,502
- − Mortgage interest
- −$10,083
- − Property taxes
- −$4,640
- − Insurance
- −$900
- − Repairs & maintenance
- −$1,720
- − Management
- −$1,720
- − Depreciation
- −$5,236
- Taxable loss
- −$2,798
- Est. tax savings @ 24.0%
- +$671
- After-tax cash flow
- $790/yr
For passive investors: Depreciation is non-cash, so a rental often shows a tax loss while cash-flowing — sheltering income. Rental losses are passive: they offset passive income freely, and up to $25,000/yr can offset ordinary (W-2) income if you actively participate and your MAGI is under $100k (phasing out to $0 by $150k); unused losses carry forward. On sale, claimed depreciation is recaptured at up to 25%, and gains may owe capital-gains tax (a 1031 exchange can defer both). Figures are a year-1 estimate at your 24.0% rate — not tax advice; consult a CPA.
Schools (NCES district)
- District
- Dallas ISD
- NCES district ID
- 4816230
- Math proficiency
- 31% ▼ -16.00%
- Reading proficiency
- 36% ▼ -4.00%
- Median HH income
- $42,881
- Composite
- 28.41/100
- National rank
- #6763
- State rank
- #559 of 826 in TX
Livability — Dallas
- Score
- 81/100
- State rank
- #24
- US rank
- #1380
Category grades
Schools grade is shown separately in the Schools card above.
Census & demographics
- Census place
- Dallas, TX
- County
- Dallas County · 2,612,404 people
- City population
- 1,168,437
- Metro
- Dallas-Fort Worth-Arlington, TX
- Population (ZIP)
- 33,840
- Household income
- $53,998
- Rent vs Own
- Severe rent burden
- 1076.0
Population outlook (Dallas County) Hauer SSP2
- Today (2025)
- 2,979,839 people
- By 2030
- 3,191,823 · +7.1%
- By 2040
- 3,619,611 · +21.5%
- By 2050
- 4,026,915 · +35.1%
- By 2075
- 4,957,073 · +66.4%
- By 2100
- 5,508,725 · +84.9%
Race, ethnicity, and origin ACS 2023
- Neighborhood character
- Majority Black (62%)
- Race & ethnicity
- Black 62% Hispanic / Latino 30% Two or more races 8% White 5% Native American 2%
- Hispanic origin (detail)
- Mexican 24%
- Foreign-born
- 13% · Canada
- Languages at home
- 73% English-only · Spanish 25%
Political lean MEDSL · Dallas
- 2024 margin
- Strong D (+22.2) · D 60.2% · R 38.0% · Other 1.8%
- 2008→2024 swing
- +6.9pp toward D · 2008: 15.3pp · 2024: 22.2pp
- All cycles
- 2024: D+22.2 2020: D+31.6 2016: D+26.2 2012: D+15.4 2008: D+15.3
Not yet ingested
- Civics
- —
Market trends
- HPI YoY
- ▼ -72.36%
- Current HPI
- 356.2348
- Rent YoY
- ▼ -2.75%
- Metro
- Dallas-Fort Worth-Arlington, TX
- State GDP YoY
- ▲ 3.95%
- F500 in state
- 110
Industry mix (Fortune 500 HQ in TX)
| Industry | F500 HQs | Revenue |
|---|---|---|
| Energy | 16 | $1,198B |
|
||
| Technology | 5 | $198B |
|
||
| Engineering / Construction | 4 | $72B |
|
||
| Energy Services | 3 | $60B |
|
||
| Utilities | 3 | $41B |
|
||
| Healthcare | 2 | $330B |
|
||
Price history
+24.1% since first listed16 events — show timeline
- 2026-05-14 Pending — NTREIS
- 2026-05-06 Contingent — NTREIS
- 2026-05-06 Relisted — NTREIS
- 2026-04-26 Contingent — NTREIS
- 2026-04-20 Listed $180,000 NTREIS
- 2024-01-20 Rental Removed $1,595 APPFOLIO
- 2024-01-12 Listed for Rent $1,595 APPFOLIO
- 2023-10-17 Rental Removed $1,595 APPFOLIO
- 2023-09-30 Price Changed $1,595 APPFOLIO
- 2023-09-21 Price Changed $1,625 APPFOLIO
- 2023-08-19 Listed for Rent $1,675 APPFOLIO
- 2020-12-31 Sold (Public Records) — Public Records
- 2020-12-07 Listed $145,000 NTREIS
- 2020-12-07 Listing Removed — NTREIS
- 2020-10-14 Sold (Public Records) — Public Records
- 1960-12-02 Sold (Public Records) — Public Records
Property tax history
+7.0%/yrLatest (2025): $4,640 · -0.9% YoY. Source: county tax records.
Cash-flow waterfall
monthlySold comps — $/sqft
last 12 mo · ≤1 miLoading sold comps…