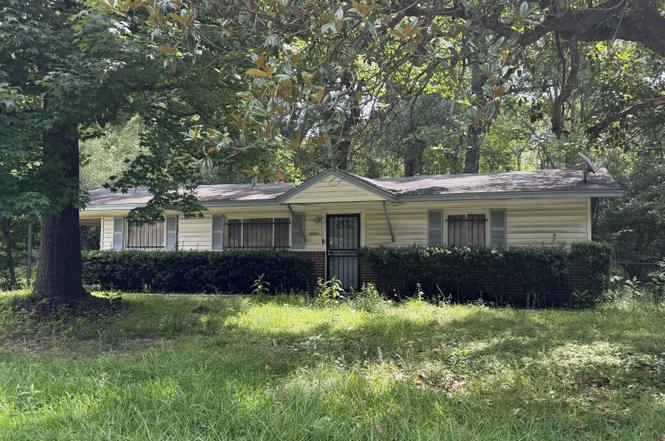
3062 Lakewood Dr · Jackson, MS
Flood risk 6/10 · Moderate
- FEMA flood zone
- X (unshaded)
- Chance of flooding over 30 yrs
- 0.69%
- Est. flood insurance / yr
- $507 – $1,088
Fire risk 1/10 · Minimal
- Est. fire insurance / yr
- $1,241 – $2,305
Heat risk 7/10 · Major
- Hot days now (above 108°F)
- 7 days/yr
- Hot days in 30 yrs
- 19 days/yr
Wind risk 8/10 · Major
- Chance of severe wind over 30 yrs
- 80.0%
Air-quality risk 1/10 · Minimal
- Unhealthy air days now
- 0 days/yr
- Unhealthy air days in 30 yrs
- 0 days/yr
Risk factors via First Street. Map © Google.
Why this score? — see what drove the B- grade
The composite is a weighted blend of 9 inputs, each scored 0–100. Each bar is that input's sub-score; the figure is the points it added to the 100-point composite (weight × sub-score).
- Cash flow +30.0/30.0
- 1% rule +10.0/10.0
- DSCR +10.0/10.0
- ARV discount +7.9/15.0
- Rent growth +3.6/5.0
- Livability +3.4/5.0
- Condition / age +2.5/5.0
- Schools +1.1/10.0
- Appreciation +0.0/10.0
$65,000
🖨 Deal sheet 📄 Offer letter ✓ Due diligence
Listing remarks
Investment Opportunity! Add this income-producing rental property to your portfolio with a tenant already in place, providing immediate rental income from day one. This well-maintained home offers a great opportunity for both seasoned and first-time investors looking for a turnkey investment. Looking to expand your portfolio? This property is one of eight investment homes currently available for purchase. Buy individually or inquire about purchasing multiple properties as a package to maximize your investment potential. Don't miss this opportunity to secure a cash-flowing asset with built-in income and additional portfolio expansion possibilities. Contact your agent today for more informati
Key facts
- 0.32 acre lot
- Garage
- Built 1956
Property features AI
Exterior
- Parking: Attached garage; 1-car carport
- Utilities: Public water; Public sewer; Cable available
- Home design: Single family house; One level
- Construction: Built (year source: public records)
- Exterior features: Shingle roof; Siding exterior; Conventional foundation; Lot of about 0.32 acres
Interior
- Bathrooms: 1 full bathroom
- Interior features: Central heating; Central air; Cable available
Neighborhood map
What this means for you Summary
Snapshot
- This is a 3-bed/1.0-bath single-family listed at $65k.
Deal economics
- At list price, monthly cash flow is $476 ($6k/yr) — positive.
- The deal already cash-flows at list — no discount required.
- Meets the 1% rule at list price ($1k rent vs $65k).
- Cap rate 15.1% vs local median 9.9% in Jackson — top-decile yield for the area; either an underpriced asset or a hidden risk that comps aren't pricing in. Stress-test before assuming the spread holds.
Location & tenants
- Location reads 68/100 on livability (#66 in MS) — a middle-class / working-renter tenant base. Strengths: commute A+, cost of living A+, housing A+; Watch: amenities F, employment F, health & safety F.
- Jackson Public School District (urban): math 9% / reading 18% proficiency, ranked #112 of 130 in MS (top 86%) — low school quality limits family demand, transient renter base, plan for 1-2y turnover; 88% free/reduced lunch — lower-income household profile, screen leases tightly.
- Zoned schools: North Jackson Elementary School (math 7% / reading 25%, grade F, #270 of 375 statewide, top 72%, 383 students, 100% FRL).
- Market conditions: Rents rising fast (+4.2%/yr); 302 active listings in the ZIP; 35 comparable units currently listed for rent nearby; rentals at typical pace (median 24d on market — plan ~3-4 weeks tenant-placement turnaround); 43% of comp listings sitting > 30 days — soft ceiling on asking rent; 167 units permitted in Hinds County in 2024 (0 in 5+ unit buildings).
Forward outlook
- Local home prices are declining (-3.0%/yr); year-one equity from $449 of loan paydown is wiped out by about $2k of value loss. Plan a longer hold.
- Hinds County population projected to shrink 6% by 2050 — rents likely to lag national; underwrite the cash flow, not the appreciation.
- At projected returns (-3.0% appreciation + 4.2% rent growth), your $18k cash investment doubles in ~4 years — after that, you're playing with house money.
Negotiation context
- Only 2 days on market — expect competitive offers; lowballing is unlikely to land.
- 2 sale attempts with the ask held roughly flat each time — persistent listings suggest the price (not the market) is what's stuck; bring a comps-based counter.
Risks & watch-outs
- Watch-outs: built in 1956 — expect roof / HVAC / electrical / plumbing capex.
- Climate carrying-cost: major flood risk; severe wind risk, 80% chance of damaging wind over 30y; extreme-heat days projected 7→19/yr by 2055 (HVAC capex compounding) — expect insurance premiums to compound above CPI over the hold.
Questions for the listing agent
- Built in 1956 — when were the roof, HVAC, electrical panel, plumbing, and water heater last replaced?
- Is there a deadline driving the sale (1031 exchange, divorce, estate, relocation)? That informs how much negotiation room exists.
- Schools are F-rated, which usually means shorter tenancies and higher turnover. Who's the typical renter profile here, and what's been the actual vacancy rate?
- What's the average days-on-market for RENTAL listings here right now (not sales)? A rising rental-DOM trend means longer vacancies and softer asking-rent achievability than the comps imply.
- What's the recent tenant-quality profile in this submarket — average credit score on applications, eviction rate, late-payment / NSF rate, and stable-employment percentage? A property-management company in the area should have these aggregated.
- How much new for-sale + rental construction is in the pipeline within 1–3 miles? Heavy new supply typically softens prices + rents 12–24 months out; constrained supply supports both.
Investment metrics
- 1% rule
- 1.85% ✓
- Cap rate
- 15.08%
- Cash-on-cash
- 31.40%
- DSCR
- 2.40
- GRM
- 4.5
CMA / ARV
- ARV (on-the-fly)
- $65,520
- Comps found
- 12
Show comp detail 12 sales within ~0.75 mi
| Address | Dist | Beds/Ba | Sqft | Sold | Price | $/sf | Match |
|---|---|---|---|---|---|---|---|
| 1340 Woody Dr | 0.14mi | 3/1.0 | 1,208 (+3%) | 1mo | $59,900 | $50 | 87 |
| 1219 Woody Dr | 0.13mi | 3/1.0 | 1,058 (-10%) | 5mo | $67,000 | $63 | 74 |
| 2920 Lakewood Dr | 0.30mi | 4/2.0 (+1) | 1,125 (-4%) | 1mo | $69,900 | $62 | 70 |
| 702 Cooper Rd | 0.53mi | 3/1.0 | 1,241 (+6%) | 4mo | $91,000 | $73 | 62 |
| 1010 Deryll St | 0.63mi | 3/2.0 | 1,143 (-2%) | 3mo | $49,900 | $44 | 61 |
| 983 Branch St | 0.45mi | 3/2.0 | 1,252 (+7%) | 4mo | $60,000 | $48 | 60 |
| 1026 Branch St | 0.53mi | 3/2.0 | 1,236 (+6%) | 3mo | $55,000 | $44 | 59 |
| 3144 Fleetwood Dr | 0.70mi | 3/2.0 | 1,204 (+3%) | 1mo | $59,900 | $50 | 58 |
| 677 Woody Dr | 0.64mi | 3/2.0 | 1,248 (+7%) | 2mo | $70,000 | $56 | 54 |
| 2842 Teresa Dr | 0.51mi | 3/1.0 | 1,008 (-14%) | 2mo | $35,000 | $35 | 52 |
| 1062 Westway St | 0.68mi | 3/1.5 | 1,066 (-9%) | 2mo | $119,500 | $112 | 50 |
| 2877 Teresa Dr | 0.45mi | 3/1.5 | 1,006 (-14%) | 4mo | $105,000 | $104 | 50 |
Match score weights: distance 35% · size 25% · config 20% · recency 20%. Top-matched comps best support the ARV.
Projected returns pro-forma
-3.0% appreciation · 4.23% rent growth · sell at horizon
- IRR
- 27.7%
- Equity multiple
- 2.17×
- Total profit
- $21,336
- Equity at exit
- $9,692
- IRR
- 36.0%
- Equity multiple
- 4.52×
- Total profit
- $64,105
- Equity at exit
- $5,620
Cash invested: $18,200 (down + closing). Projections, not guarantees.
Landlord ↔ Tenant lean methodology
- Overall (STATE)
- 90 Strongly Landlord-Friendly
- State Mississippi
- 90 Strongly Landlord-Friendly · R+11
- County
- — inherits STATE
- City
- — inherits STATE
ZIP-level market 39212
- Home prices YoY
- -11.7%
- Rents YoY
- 4.2%
- Active inventory
- 302
- Price-to-rent
- 4.5×
Monthly cashflow live
- Estimated rent
- $1,202 high interval (Pro) →
- Mortgage (P&I)
- −$341
- Tax from tax record
- −$106 /mo · $1,269/yr
- Insurance
- −$27
- HOA
- −$0
- Vacancy / Maint / Mgmt
- −$253
- Net cashflow
- $476
Break-even live
UW: 25.0% down · 7.5% · 30yr · 1.5% tax · 5.0% vac · 8.0% maint · 8.0% mgmt
Financing live
Cash to close
- Down payment
- $16,250
- Closing costs
- $1,950
- Reserves months
- —
- Total cash needed
- —
Loan-product check · same deal, 3 products live
Conventional
25% down · 7.5% · 30yr
- Down + closing
- —
- Monthly P&I
- —
- Monthly cashflow
- —
- DSCR
- —
- Eligible?
- —
Personal DTI + credit; lowest rate.
DSCR
20% down · 8.5% · 30yr
- Down + closing
- —
- Monthly P&I
- —
- Monthly cashflow
- —
- DSCR
- —
- Eligible?
- —
No personal income docs; deal must DSCR.
Hard money
10% down · 12.0% · 12mo
- Down + closing
- —
- Monthly P&I
- —
- Monthly cashflow
- —
- DSCR
- —
- Eligible?
- —
Short-term bridge; refi at stabilization.
Rent comps 35 comps
| Address | Beds | Baths | Sqft | Rent | $/sqft | DOM | Units | Dist |
|---|---|---|---|---|---|---|---|---|
| 3049 Lakewood Dr Jackson, MS | 3.0 | 1.0 | 1200 | $975 | $0.81 | 43d | 1 | 0.05mi |
| 1219 Woody Dr Jackson, MS | 3.0 | 1.0 | 1058 | $1,150 | $1.09 | 23d | 1 | 0.15mi |
| 3030 Oak Forest Dr Jackson, MS | 3.0 | 2.0 | 1200 | $1,100 | $0.92 | 13d | 1 | 0.16mi |
| 3030 Oak Forest Dr Jackson, MS | 3.0 | 1.5 | 1200 | $1,100 | $0.92 | 43d | 1 | 0.16mi |
| 3122 Oak Forest Dr Jackson, MS | 3.0 | 2.0 | 1421 | $1,100 | $0.77 | 43d | 1 | 0.16mi |
| 3162 Oak Forest Dr Jackson, MS | 3.0 | 1.5 | 1280 | $1,236 | $0.97 | 43d | 1 | 0.21mi |
| 3151 Shirley Dr Jackson, MS | 4.0 | 2.0 | 1474 | $1,306 | $0.89 | 13d | 1 | 0.32mi |
| 1223 Marydale Dr Jackson, MS | 3.0 | 1.0 | 1300 | $950 | $0.73 | 43d | 1 | 0.40mi |
| 2873 Teresa Dr Jackson, MS | 3.0 | 1.0 | 1100 | $1,100 | $1.00 | 43d | 1 | 0.43mi |
| 3308 Ramona St Jackson, MS | 3.0 | 1.0 | 1104 | $1,150 | $1.04 | 21d | 1 | 0.44mi |
| 427 McDowell Park Cir Jackson, MS | 3.0 | 1.5 | 1308 | $1,200 | $0.92 | 13d | 1 | 0.60mi |
| 1010 Deryll St Jackson, MS | 3.0 | 2.0 | 1143 | $1,050 | $0.92 | 13d | 1 | 0.66mi |
| 1018 Deryll St Jackson, MS | 3.0 | 1.0 | 1056 | $900 | $0.85 | 23d | 1 | 0.67mi |
| 3152 Bilgray Dr Jackson, MS | 3.0 | 1.5 | 1200 | $1,100 | $0.92 | 13d | 1 | 0.70mi |
| 1126 Barbara Ann Dr Jackson, MS | 3.0 | 1.0 | 1343 | $1,000 | $0.74 | 43d | 1 | 0.72mi |
| 1126 Barbara Ann Dr Jackson, MS | 3.0 | 1.0 | 1343 | $1,000 | $0.74 | 13d | 1 | 0.72mi |
| 1054 Deryll St Jackson, MS | 3.0 | 1.5 | 1132 | $1,050 | $0.93 | 13d | 1 | 0.74mi |
| 1513 Maria Dr Jackson, MS | 3.0 | 2.0 | 1120 | $1,200 | $1.07 | 13d | 1 | 0.81mi |
| 1513 Maria Dr Jackson, MS | 3.0 | 2.0 | 1120 | $1,200 | $1.07 | 23d | 1 | 0.81mi |
| 3341 Suncrest Dr Jackson, MS | 4.0 | 1.0 | 1292 | $1,225 | $0.95 | 43d | 1 | 0.83mi |
| 2786 Brookwood Dr Jackson, MS | 3.0 | 1.0 | 1003 | $1,100 | $1.10 | 43d | 1 | 0.86mi |
| 3511 Sykes Park Dr Jackson, MS | 3.0 | 2.0 | 1225 | $1,426 | $1.16 | 13d | 1 | 0.89mi |
| 103 Sykes Park Cir Jackson, MS | 3.0 | 2.0 | 1500 | $1,250 | $0.83 | 43d | 1 | 0.96mi |
| 422 Cooper Rd Jackson, MS | 3.0 | 1.0 | 1049 | $1,426 | $1.36 | 23d | 1 | 0.97mi |
| 2858 Fairhill Dr Jackson, MS | 2.0 | 1.0 | 900 | $825 | $0.92 | 43d | 1 | 1.07mi |
| 2242 Castle Hill Dr Jackson, MS | 4.0 | 2.0 | 1500 | $1,475 | $0.98 | 23d | 1 | 1.12mi |
| 2242 Castle Hill Dr Jackson, MS | 4.0 | 2.0 | 1500 | $1,475 | $0.98 | 13d | 1 | 1.12mi |
| 316 Woody Dr Jackson, MS | 3.0 | 1.0 | 1185 | $1,250 | $1.05 | 13d | 1 | 1.15mi |
| 316 Woody Dr Jackson, MS | 3.0 | 1.0 | 1185 | $1,250 | $1.05 | 43d | 1 | 1.15mi |
| 843 Reaves St Jackson, MS | 3.0 | 2.0 | 1408 | $1,084 | $0.77 | 43d | 1 | 1.19mi |
| 267 Woody Dr Jackson, MS | 3.0 | 1.5 | 1165 | $1,100 | $0.94 | 43d | 1 | 1.22mi |
| 1533 Raymond Rd Jackson, MS | 2.0 | 1.0 | 1135 | $1,010 | $0.89 | 43d | 1 | 1.34mi |
| 270 Wildwood Ct Jackson, MS | 3.0 | 1.0 | 1200 | $1,200 | $1.00 | 21d | 1 | 1.38mi |
| 201 W Santa Clair St Jackson, MS | 2.0 | 1.0 | 1182 | $950 | $0.80 | 13d | 1 | 1.40mi |
| 201 W Santa Clair St Jackson, MS | 2.0 | 1.0 | 1182 | $950 | $0.80 | 23d | 1 | 1.40mi |
Listing history 3 events
-
2026-06-18days on market $65,000 Active 2 DOM
-
2026-06-17remarks 699-char remark
-
2026-06-17$65,000 Active 1 DOM
ⓘ Source: listings_history table (triggers on properties + properties_extension) + one-shot
backfill from property_details.listing_events for pre-trigger history.
Tax reassessment forecast MS · Resets to sale price
- Current annual tax
- $1,269 · $106/mo
- Projected year-2 tax
- $1,269 · $106/mo
- Expected delta
- $0/yr ($0/mo · 0.0%)
ⓘ Screening estimate from a state-policy table — verify with the county assessor before closing.
Climate risk First Street
- Flood 6/10 Major FEMA zone X (unshaded) · 69% chance over 30 yrs
- Wildfire 1/10 Low
- Heat 7/10 Severe 7 d/yr ≥108°F today · 19 d/yr by 30 yrs out
- Wind 8/10 Severe 80% chance of damaging wind over 30 yrs
- Air quality 1/10 Low 0 unhealthy d/yr today · 0 by 30 yrs out
Nearby sold comps map
Loading sold comps map…
Walkable amenities ~0.75 mi
Loading nearby amenities…
Taxation est. · year 1
- Rental income
- $14,429
- − Mortgage interest
- −$3,641
- − Property taxes
- −$1,269
- − Insurance
- −$325
- − Repairs & maintenance
- −$1,154
- − Management
- −$1,154
- − Depreciation
- −$1,891
- Taxable income
- $4,994
- Est. tax owed @ 24.0%
- −$1,199
- After-tax cash flow
- $4,516/yr
For passive investors: Depreciation is non-cash, so a rental often shows a tax loss while cash-flowing — sheltering income. Rental losses are passive: they offset passive income freely, and up to $25,000/yr can offset ordinary (W-2) income if you actively participate and your MAGI is under $100k (phasing out to $0 by $150k); unused losses carry forward. On sale, claimed depreciation is recaptured at up to 25%, and gains may owe capital-gains tax (a 1031 exchange can defer both). Figures are a year-1 estimate at your 24.0% rate — not tax advice; consult a CPA.
Schools (NCES district)
- District
- Jackson Public School District
- NCES district ID
- 2802190
- Math proficiency
- 9% ▼ -14.00%
- Reading proficiency
- 18% ▼ -7.00%
- Median HH income
- $33,234
- Composite
- 10.89/100
- National rank
- #9755
- State rank
- #112 of 130 in MS
Livability — Jackson
- Score
- 68/100
- State rank
- #66
- US rank
- #9695
Category grades
Schools grade is shown separately in the Schools card above.
Census & demographics
- Census place
- Jackson, MS
- County
- Hinds County · 167,040 people
- City population
- 140,204
- Metro
- Jackson, MS
- Population (ZIP)
- 25,659
- Household income
- $50,722
- Rent vs Own
- Severe rent burden
- 1314.0
Population outlook (Hinds County) Hauer SSP2
- Today (2025)
- 242,528 people
- By 2030
- 241,113 · -0.6%
- By 2040
- 235,557 · -2.9%
- By 2050
- 226,946 · -6.4%
- By 2075
- 199,995 · -17.5%
- By 2100
- 164,165 · -32.3%
Race, ethnicity, and origin ACS 2023
- Neighborhood character
- Predominantly Black (86%)
- Race & ethnicity
- Black 86% White 9% Hispanic / Latino 3% Two or more races 3%
- Common ancestry
- Serbian 1% Lithuanian 1%
- Foreign-born
- 1% · Canada
- Languages at home
- 97% English-only · Spanish 2%
Political lean MEDSL · Hinds
- 2024 margin
- Solid D (+46.1) · D 72.4% · R 26.3% · Other 1.4%
- 2008→2024 swing
- +7.1pp toward D · 2008: 39.0pp · 2024: 46.1pp
- All cycles
- 2024: D+46.1 2020: D+48.3 2016: D+43.7 2012: D+45.1 2008: D+39.0
Not yet ingested
- Civics
- —
Market trends
- HPI YoY
- ▼ -23.01%
- Current HPI
- 174.4025
- Rent YoY
- ▲ 4.23%
- Metro
- Jackson, MS
- State GDP YoY
- —
- F500 in state
- 0
Price history
-12.8% since first listed6 events — show timeline
- 2026-06-16 Listed $65,000 MLSU
- 2026-01-31 Listing Removed — MLSU
- 2025-08-11 Listed $74,500 MLSU
- 2000-10-13 Sold (Public Records) — Public Records
- 1989-04-20 Sold (Public Records) — Public Records
- 1987-03-20 Sold (Public Records) — Public Records
Property tax history
+7.6%/yrLatest (2025): $1,269 · +3.1% YoY. Source: county tax records.
Cash-flow waterfall
monthlySold comps — $/sqft
last 12 mo · ≤1 miLoading sold comps…