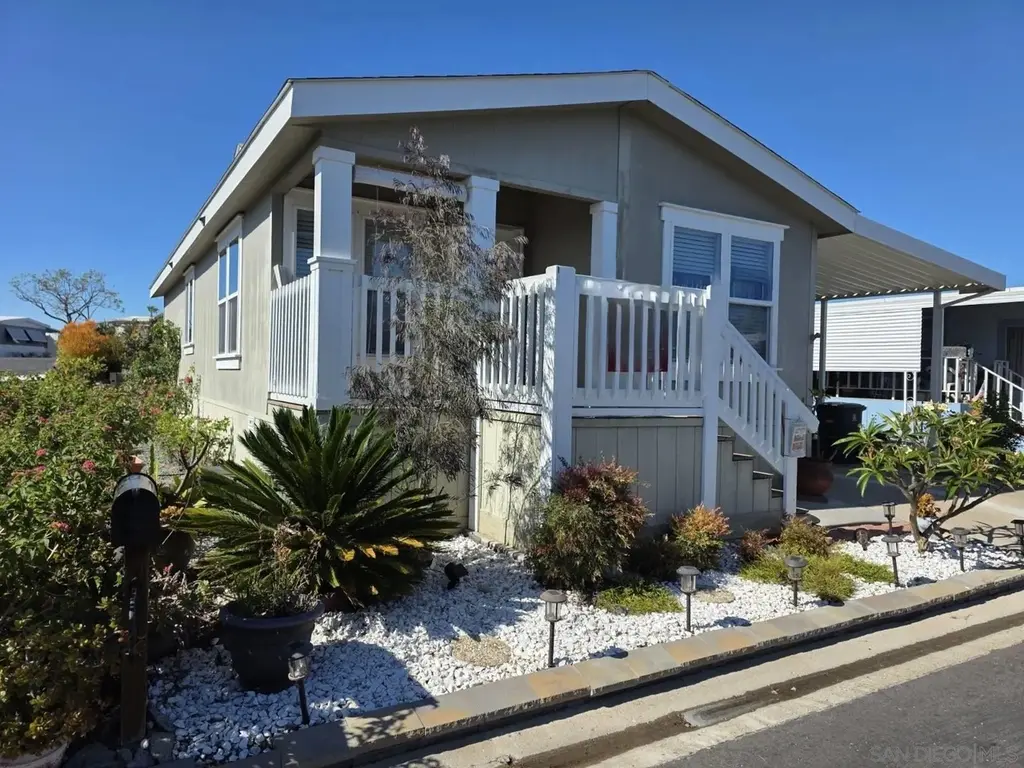
1925 Otay Lakes Rd #78 · Chula Vista, CA
Flood risk 1/10 · Minimal
- FEMA flood zone
- X (unshaded)
- Chance of flooding over 30 yrs
- 0.0%
- Est. flood insurance / yr
- $507 – $1,088
Fire risk 4/10 · Minor
- Est. fire insurance / yr
- $659 – $1,223
Heat risk 4/10 · Minor
- Hot days now (above 90°F)
- 4 days/yr
- Hot days in 30 yrs
- 11 days/yr
Wind risk 1/10 · Minimal
- Chance of severe wind over 30 yrs
- —
Air-quality risk 3/10 · Minor
- Unhealthy air days now
- 3 days/yr
- Unhealthy air days in 30 yrs
- 3 days/yr
Risk factors via First Street. Map © Google.
Why this score? — see what drove the C+ grade
The composite is a weighted blend of 9 inputs, each scored 0–100. Each bar is that input's sub-score; the figure is the points it added to the 100-point composite (weight × sub-score).
- Cash flow +30.0/30.0
- DSCR +10.0/10.0
- 1% rule +7.4/10.0
- Schools +3.9/10.0
- Livability +3.8/5.0
- Rent growth +2.7/5.0
- Condition / age +2.5/5.0
- ARV discount +0.0/15.0
- Appreciation +0.0/10.0
$255,000
🖨 Deal sheet 📄 Offer letter ✓ Due diligence
Listing remarks
This well-kept Skyline home, with an open layout, offers the comfort of 2-bedrooms and 2 bathrooms. Its other features include a refrigerator, microwave, & dishwasher in the kitchen, a laundry room with washer and dryer hookups, and even a covered carport. With a spacious living area, private primary suite, and plenty of natural light, this move-in ready home offers comfortable, low-maintenance living. * The above information including square footage is based on data received from the seller and/or from public sources. This information is deemed reliable but has not been independently verified and cannot be guaranteed. Prospective buyers are advised to verify information to their own s
Key facts
- 2 parking spots
- Community pool
- Built 2010
Property features AI
Finance
- HOA & community: Located in a senior community (Otay Lakes Lodge)
Exterior
- Parking: 2 parking spaces
- Utilities: Public water; Public sewer
- Home design: Manufactured home; Single-story
- Construction: Cement siding; Composition roof
- Exterior features: Chain link fencing; Community pool
Interior
- Kitchen: Includes dishwasher, disposal, microwave, refrigerator
- Bedrooms: 2 possible bedrooms
- Bathrooms: 2 full bathrooms
- Heating & cooling: Central air; Forced air heating; Natural gas heating
- Interior features: Dishwasher, Disposal, Microwave, Refrigerator
- Laundry & utility: Washer hookup
Neighborhood map
What this means for you Summary
Snapshot
- This is a 2-bed/2.0-bath manufactured listed at $255k.
Deal economics
- At list price, monthly cash flow is $975 ($12k/yr) — positive.
- The deal already cash-flows at list — no discount required.
- Meets the 1% rule at list price ($3k rent vs $255k).
- Cap rate 10.9% vs local median 2.7% in Chula Vista — top-decile yield for the area; either an underpriced asset or a hidden risk that comps aren't pricing in. Stress-test before assuming the spread holds.
Location & tenants
- Location reads 75/100 on livability (#127 in CA, #4,345 nationally) — a middle-class / working-renter tenant base. Strengths: amenities A+, commute A+, employment A+; Watch: health & safety C-, cost of living F.
- Sweetwater Union High (suburban): math 36% / reading 52% proficiency, ranked #187 of 517 in CA (top 36%) — families likely to look elsewhere, expect single-tenant / working-renter base with shorter leases.
- Market conditions: Rents flat; 171 active listings in the ZIP; 20 comparable units currently listed for rent nearby; rentals leasing fast (median 2d on market — plan ~1-2 weeks tenant-placement turnaround); high-income renter base; 11,759 units permitted in San Diego County in 2024 (7,244 in 5+ unit buildings).
Forward outlook
- Local home prices are declining (-3.0%/yr); year-one equity from $2k of loan paydown is wiped out by about $8k of value loss. Plan a longer hold.
- San Diego County population projected at +20% by 2050 — long-run rental-demand tailwind backs the buy-and-hold thesis.
- At projected returns (-3.0% appreciation + 0.9% rent growth), your $71k cash investment doubles in ~9 years — after that, you're playing with house money.
Negotiation context
- Only 7 days on market — expect competitive offers; lowballing is unlikely to land.
Questions for the listing agent
- Is there a deadline driving the sale (1031 exchange, divorce, estate, relocation)? That informs how much negotiation room exists.
- Schools are B-rated — typically a magnet for longer-tenancy family renters. What's the average tenant stay here, and is there a school-zone premium baked into asking?
- What's the average days-on-market for RENTAL listings here right now (not sales)? A rising rental-DOM trend means longer vacancies and softer asking-rent achievability than the comps imply.
- What's the recent tenant-quality profile in this submarket — average credit score on applications, eviction rate, late-payment / NSF rate, and stable-employment percentage? A property-management company in the area should have these aggregated.
- How much new for-sale + rental construction is in the pipeline within 1–3 miles? Heavy new supply typically softens prices + rents 12–24 months out; constrained supply supports both.
Investment metrics
- 1% rule
- 1.24% ✓
- Cap rate
- 10.88%
- Cash-on-cash
- 16.38%
- DSCR
- 1.73
- GRM
- 6.7
CMA / ARV
- ARV (on-the-fly)
- $180,480
- Comps found
- 2
Show comp detail 2 sales within ~0.75 mi
| Address | Dist | Beds/Ba | Sqft | Sold | Price | $/sf | Match |
|---|---|---|---|---|---|---|---|
| 1925 OTAY LAKES Rd #6 | 0.00mi | 2/1.0 | 1,008 (+5%) | 9mo | $137,000 | $136 | 80 |
| 1925 Otay Lakes Rd #140 | 0.09mi | 2/2.0 | 1,040 (+8%) | 11mo | $195,550 | $188 | 73 |
Match score weights: distance 35% · size 25% · config 20% · recency 20%. Top-matched comps best support the ARV.
Projected returns pro-forma
-3.0% appreciation · 0.88% rent growth · sell at horizon
- IRR
- 5.2%
- Equity multiple
- 1.20×
- Total profit
- $14,046
- Equity at exit
- $38,021
- IRR
- 12.8%
- Equity multiple
- 1.92×
- Total profit
- $65,765
- Equity at exit
- $22,048
Cash invested: $71,400 (down + closing). Projections, not guarantees.
Landlord ↔ Tenant lean methodology
- Overall (STATE)
- 18 Strongly Tenant-Friendly
- State California
- 18 Strongly Tenant-Friendly · D+13
- County
- — inherits STATE
- City
- — inherits STATE
ZIP-level market 91913
- Home prices YoY
- -30.1%
- Rents YoY
- 0.9%
- Active inventory
- 171
- Price-to-rent
- 6.7×
Monthly cashflow live
- Estimated rent
- $3,166 high interval (Pro) →
- Mortgage (P&I)
- −$1,337
- Tax from tax record
- −$83 /mo · $991/yr
- Insurance
- −$106
- HOA
- −$0
- Vacancy / Maint / Mgmt
- −$665
- Net cashflow
- $975
Break-even live
UW: 25.0% down · 7.5% · 30yr · 1.5% tax · 5.0% vac · 8.0% maint · 8.0% mgmt
Financing live
Cash to close
- Down payment
- $63,750
- Closing costs
- $7,650
- Reserves months
- —
- Total cash needed
- —
Loan-product check · same deal, 3 products live
Conventional
25% down · 7.5% · 30yr
- Down + closing
- —
- Monthly P&I
- —
- Monthly cashflow
- —
- DSCR
- —
- Eligible?
- —
Personal DTI + credit; lowest rate.
DSCR
20% down · 8.5% · 30yr
- Down + closing
- —
- Monthly P&I
- —
- Monthly cashflow
- —
- DSCR
- —
- Eligible?
- —
No personal income docs; deal must DSCR.
Hard money
10% down · 12.0% · 12mo
- Down + closing
- —
- Monthly P&I
- —
- Monthly cashflow
- —
- DSCR
- —
- Eligible?
- —
Short-term bridge; refi at stabilization.
Rent comps 20 comps
| Address | Beds | Baths | Sqft | Rent | $/sqft | DOM | Units | Dist |
|---|---|---|---|---|---|---|---|---|
| 2035 Lakeridge Cir #101 Chula Vista, CA | 2.0 | 2.0 | 1045 | $2,995 | $2.87 | 1d | 1 | 0.58mi |
| 2085 Lakeridge Cir #202 Chula Vista, CA | 2.0 | 2.0 | 956 | $3,095 | $3.24 | 24d | 1 | 0.61mi |
| 767 Brookstone Rd #301 Chula Vista, CA | 2.0 | 2.0 | 1045 | $3,295 | $3.15 | 16d | 1 | 0.67mi |
| 1867 Platte River Ln #1 Chula Vista, CA | 2.0 | 2.0 | 1032 | $3,000 | $2.91 | 1d | 1 | 0.68mi |
| 1298 Fools Gold Way #4 Chula Vista, CA | 2.0 | 2.0 | 1071 | $3,100 | $2.89 | 1d | 1 | 0.79mi |
| 1305 Mother Lode Way #1 Chula Vista, CA | 2.0 | 2.0 | 1071 | $2,900 | $2.71 | 1d | 1 | 0.82mi |
| 1250 Santa Cora Ave Chula Vista, CA | 1.0–3.0 | 1.0–2.0 | 952 | $3,234 | $3.40 | 1d | 35 | 0.88mi |
| 1338 Nicolette Ave #1032 Chula Vista, CA | 2.0 | 2.0 | 1066 | $2,800 | $2.63 | 22d | 1 | 0.94mi |
| 1344 Paizay Pl #732 Chula Vista, CA | 2.0 | 2.0 | 1066 | $2,695 | $2.53 | 2d | 1 | 0.96mi |
| 1885 Rennes Pl #2224 Chula Vista, CA | 2.0 | 2.0 | 975 | $2,995 | $3.07 | 1d | 1 | 0.96mi |
| 1051 Waterville Lake Rd Unit 2 Chula Vista, CA | 2.0 | 1.5 | 1000 | $3,875 | $3.88 | 1d | 1 | 0.98mi |
| 1051 Waterville Lake Rd Unit 3 Chula Vista, CA | 2.0 | 1.5 | 1000 | $3,875 | $3.88 | 3d | 1 | 0.98mi |
| 1355 Nicolette Ave #1323 Chula Vista, CA | 2.0 | 2.0 | 1066 | $2,700 | $2.53 | 1d | 1 | 0.99mi |
| 1439 Trouville Ln Chula Vista, CA | 2.0 | 2.0 | 1008 | $2,850 | $2.83 | 3d | 1 | 1.17mi |
| 1439 Trouville Ln #6 Chula Vista, CA | 2.0 | 2.0 | 1008 | $2,850 | $2.83 | 19d | 1 | 1.17mi |
| 1924 E Palomar St Chula Vista, CA | 2.0–3.0 | 3.0 | 1209 | $3,150 | $2.60 | 1d | 6 | 1.19mi |
| 1445 Town Center Dr Chula Vista, CA | 2.0 | 1.0–2.0 | 926 | $3,960 | $4.28 | 1d | 20 | 1.33mi |
| 1629 Santa Venetia St Chula Vista, CA | 1.0–3.0 | 1.0–2.0 | 1115 | $3,430 | $3.08 | 1d | 27 | 1.39mi |
| 1625 Santa Venetia St Chula Vista, CA | 1.0–3.0 | 1.0–2.0 | 1008 | $3,352 | $3.33 | 1d | 24 | 1.45mi |
| 1390 Santa Alicia Ave Chula Vista, CA | 1.0–3.0 | 1.0–2.5 | 1050 | $3,278 | $3.12 | 1d | 15 | 1.49mi |
Listing history 7 events
-
2026-06-18days on market $255,000 Active 7 DOM
-
2026-06-17days on market $255,000 Active 6 DOM
-
2026-06-16days on market $255,000 Active 5 DOM
-
2026-06-15days on market $255,000 Active 4 DOM
-
2026-06-13days on market $255,000 Active 2 DOM
-
2026-06-13remarks 695-char remark
-
2026-06-13$255,000 Active 1 DOM
ⓘ Source: listings_history table (triggers on properties + properties_extension) + one-shot
backfill from property_details.listing_events for pre-trigger history.
Tax reassessment forecast CA · Resets to sale price
- Current annual tax
- $991 · $83/mo
- Projected year-2 tax
- $1,938 · $162/mo
- Expected delta
- +$947/yr (+$79/mo · 95.6%)
ⓘ Screening estimate from a state-policy table — verify with the county assessor before closing.
Climate risk First Street
- Flood 1/10 Low FEMA zone X (unshaded) · 0% chance over 30 yrs
- Wildfire 4/10 Moderate
- Heat 4/10 Moderate 4 d/yr ≥90°F today · 11 d/yr by 30 yrs out
- Wind 1/10 Low
- Air quality 3/10 Moderate 3 unhealthy d/yr today · 3 by 30 yrs out
Nearby sold comps map
Loading sold comps map…
Walkable amenities ~0.75 mi
Loading nearby amenities…
Taxation est. · year 1
- Rental income
- $37,986
- − Mortgage interest
- −$14,284
- − Property taxes
- −$991
- − Insurance
- −$1,275
- − Repairs & maintenance
- −$3,039
- − Management
- −$3,039
- − Depreciation
- −$7,418
- Taxable income
- $7,940
- Est. tax owed @ 24.0%
- −$1,906
- After-tax cash flow
- $9,790/yr
For passive investors: Depreciation is non-cash, so a rental often shows a tax loss while cash-flowing — sheltering income. Rental losses are passive: they offset passive income freely, and up to $25,000/yr can offset ordinary (W-2) income if you actively participate and your MAGI is under $100k (phasing out to $0 by $150k); unused losses carry forward. On sale, claimed depreciation is recaptured at up to 25%, and gains may owe capital-gains tax (a 1031 exchange can defer both). Figures are a year-1 estimate at your 24.0% rate — not tax advice; consult a CPA.
Schools (NCES district)
- District
- Sweetwater Union High
- NCES district ID
- 0638640
- Math proficiency
- 36% ▲ 3.00%
- Reading proficiency
- 52% ▼ -2.00%
- Median HH income
- $59,051
- Composite
- 38.61/100
- National rank
- #4158
- State rank
- #187 of 517 in CA
Livability — Chula Vista
- Score
- 75/100
- State rank
- #127
- US rank
- #4345
Category grades
Schools grade is shown separately in the Schools card above.
Census & demographics
- Census place
- Chula Vista, CA
- County
- San Diego County · 3,178,799 people
- City population
- 255,708
- Metro
- San Diego-Chula Vista-Carlsbad, CA
- Population (ZIP)
- 57,721
- Household income
- $129,337
- Rent vs Own
- Severe rent burden
- 1806.0
Population outlook (San Diego County) Hauer SSP2
- Today (2025)
- 3,678,185 people
- By 2030
- 3,856,546 · +4.8%
- By 2040
- 4,171,407 · +13.4%
- By 2050
- 4,421,607 · +20.2%
- By 2075
- 4,831,599 · +31.4%
- By 2100
- 4,832,502 · +31.4%
Race, ethnicity, and origin ACS 2023
- Neighborhood character
- Diverse neighborhood (Simpson 0.69)
- Race & ethnicity
- Hispanic / Latino 47% Asian 25% Two or more races 24% White 14% Black 8%
- Hispanic origin (detail)
- Mexican 42% Puerto Rican 2%
- Common ancestry
- Italian 1% Hispanic 1% Iranian 1%
- Foreign-born
- 31% · Canada, China, South Korea
- Languages at home
- 49% English-only · Spanish 34% Tagalog/Filipino 11% Other Asian/Pacific 2%
Political lean MEDSL · San Diego
- 2024 margin
- D (+16.8) · D 56.9% · R 40.1% · Other 2.9%
- 2008→2024 swing
- +6.6pp toward D · 2008: 10.2pp · 2024: 16.8pp
- All cycles
- 2024: D+16.8 2020: D+22.8 2016: D+17.8 2012: D+5.1 2008: D+10.2
Not yet ingested
- Civics
- —
Market trends
- HPI YoY
- ▼ -151.26%
- Current HPI
- 350.4967
- Rent YoY
- ▲ 0.88%
- Metro
- San Diego-Chula Vista-Carlsbad, CA
- State GDP YoY
- ▲ 3.21%
- F500 in state
- 116
Industry mix (Fortune 500 HQ in CA)
| Industry | F500 HQs | Revenue |
|---|---|---|
| Technology | 27 | $1,492B |
|
||
| Financial Services | 3 | $174B |
|
||
| Retail | 3 | $44B |
|
||
| Insurance | 3 | $26B |
|
||
| Media / Entertainment | 2 | $115B |
|
||
| Pharmaceuticals / Biotech | 2 | $62B |
|
||
Price history
1 event — show timeline
- 2026-06-11 Listed $255,000 SDMLS
Cash-flow waterfall
monthlySold comps — $/sqft
last 12 mo · ≤1 miLoading sold comps…