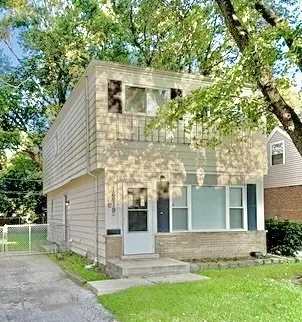
16919 Western Ave · Hazel Crest, IL
Flood risk 1/10 · Minimal
- FEMA flood zone
- X (unshaded)
- Chance of flooding over 30 yrs
- 0.0%
- Est. flood insurance / yr
- $507 – $1,088
Fire risk 1/10 · Minimal
- Est. fire insurance / yr
- $804 – $1,492
Heat risk 3/10 · Minor
- Hot days now (above 102°F)
- 7 days/yr
- Hot days in 30 yrs
- 15 days/yr
Wind risk 2/10 · Minimal
- Chance of severe wind over 30 yrs
- —
Air-quality risk 3/10 · Minor
- Unhealthy air days now
- 4 days/yr
- Unhealthy air days in 30 yrs
- 4 days/yr
Risk factors via First Street. Map © Google.
Why this score? — see what drove the B grade
The composite is a weighted blend of 9 inputs, each scored 0–100. Each bar is that input's sub-score; the figure is the points it added to the 100-point composite (weight × sub-score).
- Cash flow +29.4/30.0
- ARV discount +12.2/15.0
- 1% rule +10.0/10.0
- DSCR +10.0/10.0
- Livability +3.8/5.0
- Rent growth +2.5/5.0
- Condition / age +2.5/5.0
- Schools +0.7/10.0
- Appreciation +0.0/10.0
$159,000
🖨 Deal sheet 📄 Offer letter ✓ Due diligence
Listing remarks MLS
Large home being sold as is. Seller looking for quick sale. Property in move in condition minimal repairs needed. 4 bedrooms, 1.5 baths recent updates, very large fenced yard for family fun. directly across from school and near parks. Own for less than rent!! Seller will not provide survey, termite or warranty of any kind
Key facts
- Spacious shed
- Open-concept kitchen
- Ample parking
Tags
Property features AI
Finance
- Other: Property not currently leased; Possession at closing
- HOA & community: No master association fee required
Exterior
- Parking: Off-street parking for 2 vehicles; Driveway with side apron; owned parking
- Utilities: Public water; Public sewer
- Home design: Detached single-family home; 2-story layout; Fee simple ownership; Property over 100 years old; Built before 1978
- Construction: Brick and frame construction
- Exterior features: 25 x 125 lot dimensions; Lot less than 0.25 acre
Interior
- Kitchen: Kitchen on main level with ceramic tile flooring (15 x 13)
- Bedrooms: 4 bedrooms (Master and three additional bedrooms on the second floor)
- Flooring: Hardwood flooring in living room, master bedroom and additional bedrooms; Ceramic tile in kitchen and laundry
- Bathrooms: 1 full bathroom; 1 half bathroom
- Heating & cooling: Natural gas forced-air heating; Central air conditioning
- Interior features: 6 total rooms
- Laundry & utility: Main-level laundry room with ceramic tile flooring (6 x 7)
Neighborhood map
What this means for you Summary
Snapshot
- This is a 3-bed/1.5-bath single-family listed at $159k.
Deal economics
- At list price, monthly cash flow is $566 ($7k/yr) — positive.
- The deal already cash-flows at list — no discount required.
- Meets the 1% rule at list price ($2k rent vs $159k).
Location & tenants
- Location reads 75/100 on livability (#229 in IL, #4,242 nationally) — a middle-class / working-renter tenant base. Strengths: commute A+, cost of living A+, housing A+; Watch: health & safety C-, schools D-, crime F.
- Thornton Twp Hsd 205 (suburban): math 7% / reading 8% proficiency, ranked #594 of 620 in IL (top 96%) — low school quality limits family demand, transient renter base, plan for 1-2y turnover.
- Market conditions: 80 active listings in the ZIP; 11 comparable units currently listed for rent nearby; rentals leasing fast (median 2d on market — plan ~1-2 weeks tenant-placement turnaround); 6,272 units permitted in Cook County in 2024 (4,658 in 5+ unit buildings).
Forward outlook
- Local home prices are declining (-3.0%/yr); year-one equity from $1k of loan paydown is wiped out by about $5k of value loss. Plan a longer hold.
- At projected returns (-3.0% appreciation + 3.0% rent growth), your $45k cash investment doubles in ~8 years — after that, you're playing with house money.
Negotiation context
- Only 8 days on market — expect competitive offers; lowballing is unlikely to land.
- 4 sale attempts since 18y ago; this cycle's ask has dropped $32k (17%) from the opening price — seller is motivated, your offer sets the floor, not the list.
- Current owner paid $35k; list at $159k implies a 354% gain — meaningful room to come down on a strong offer.
Risks & watch-outs
- Watch-outs: property tax is 3.3% of price; built in 1919 — expect roof / HVAC / electrical / plumbing capex.
Questions for the listing agent
- Built in 1919 — when were the roof, HVAC, electrical panel, plumbing, and water heater last replaced?
- Property tax is high relative to price — has the assessment been appealed recently, and will the sale trigger a re-assessment?
- Is there a deadline driving the sale (1031 exchange, divorce, estate, relocation)? That informs how much negotiation room exists.
- Schools are D-rated, which usually means shorter tenancies and higher turnover. Who's the typical renter profile here, and what's been the actual vacancy rate?
- Crime grade is F in this area — have there been break-ins, vandalism, or insurance claims at this property in the last 3 years? What carrier currently insures it and at what premium?
- What's the average days-on-market for RENTAL listings here right now (not sales)? A rising rental-DOM trend means longer vacancies and softer asking-rent achievability than the comps imply.
- What's the recent tenant-quality profile in this submarket — average credit score on applications, eviction rate, late-payment / NSF rate, and stable-employment percentage? A property-management company in the area should have these aggregated.
- How much new for-sale + rental construction is in the pipeline within 1–3 miles? Heavy new supply typically softens prices + rents 12–24 months out; constrained supply supports both.
Investment metrics
- 1% rule
- 1.52% ✓
- Cap rate
- 10.57%
- Cash-on-cash
- 15.26%
- DSCR
- 1.68
- GRM
- 5.5
CMA / ARV
- ARV (on-the-fly)
- $177,415
- Comps found
- 12
Show comp detail 12 sales within ~0.75 mi
| Address | Dist | Beds/Ba | Sqft | Sold | Price | $/sf | Match |
|---|---|---|---|---|---|---|---|
| 16918 S Orchard Ridge Ave | 0.03mi | 4/1.5 (+1) | 1,295 (0%) | 4mo | $128,000 | $99 | 90 |
| 17089 Crane Ave | 0.27mi | 4/1.5 (+1) | 1,295 (0%) | 4mo | $50,000 | $39 | 79 |
| 16726 Head Ave | 0.33mi | 3/2.0 | 1,227 (-5%) | 5mo | $205,000 | $167 | 70 |
| 17026 Bulger Ave | 0.36mi | 3/1.0 | 1,392 (+8%) | 1mo | $171,390 | $123 | 68 |
| 16557 Plymouth Dr | 0.62mi | 3/1.0 | 1,300 (+0%) | 4mo | $198,000 | $152 | 65 |
| 16727 Head Ave | 0.34mi | 3/1.5 | 1,150 (-11%) | 1mo | $157,000 | $137 | 65 |
| 16876 Head Ave | 0.23mi | 4/2.0 (+1) | 1,147 (-11%) | 1mo | $185,000 | $161 | 63 |
| 17218 Hillside Ave | 0.55mi | 3/2.0 | 1,421 (+10%) | 0mo | $220,000 | $155 | 56 |
| 16614 Plymouth Dr | 0.61mi | 3/1.5 | 1,117 (-14%) | 4mo | $75,000 | $67 | 45 |
| 17510 Western Ave | 0.74mi | 2/1.0 (-1) | 1,215 (-6%) | 5mo | $130,000 | $107 | 44 |
| 16628 Winchester Ave | 0.63mi | 2/1.0 (-1) | 1,134 (-12%) | 1mo | $84,000 | $74 | 42 |
| 17107 Longfellow Ave | 0.68mi | 3/2.5 | 1,456 (+12%) | 6mo | $205,000 | $141 | 39 |
Match score weights: distance 35% · size 25% · config 20% · recency 20%. Top-matched comps best support the ARV.
Projected returns pro-forma
-3.0% appreciation · 3.0% rent growth · sell at horizon
- IRR
- 6.0%
- Equity multiple
- 1.24×
- Total profit
- $10,476
- Equity at exit
- $23,707
- IRR
- 15.5%
- Equity multiple
- 2.26×
- Total profit
- $56,306
- Equity at exit
- $13,747
Cash invested: $44,520 (down + closing). Projections, not guarantees.
Landlord ↔ Tenant lean methodology
- Overall (STATE)
- 43 Moderately Tenant-Leaning
- State Illinois
- 43 Moderately Tenant-Leaning · D+7
- County
- — inherits STATE
- City
- — inherits STATE
ZIP-level market 60429
- Home prices YoY
- -14.0%
- Active inventory
- 80
- Price-to-rent
- 5.5×
Monthly cashflow live
- Estimated rent
- $2,416 high interval (Pro) →
- Mortgage (P&I)
- −$834
- Tax from tax record
- −$442 /mo · $5,310/yr
- Insurance
- −$66
- HOA
- −$0
- Vacancy / Maint / Mgmt
- −$507
- Net cashflow
- $566
Break-even live
UW: 25.0% down · 7.5% · 30yr · 1.5% tax · 5.0% vac · 8.0% maint · 8.0% mgmt
Financing live
Cash to close
- Down payment
- $39,750
- Closing costs
- $4,770
- Reserves months
- —
- Total cash needed
- —
Loan-product check · same deal, 3 products live
Conventional
25% down · 7.5% · 30yr
- Down + closing
- —
- Monthly P&I
- —
- Monthly cashflow
- —
- DSCR
- —
- Eligible?
- —
Personal DTI + credit; lowest rate.
DSCR
20% down · 8.5% · 30yr
- Down + closing
- —
- Monthly P&I
- —
- Monthly cashflow
- —
- DSCR
- —
- Eligible?
- —
No personal income docs; deal must DSCR.
Hard money
10% down · 12.0% · 12mo
- Down + closing
- —
- Monthly P&I
- —
- Monthly cashflow
- —
- DSCR
- —
- Eligible?
- —
Short-term bridge; refi at stabilization.
Rent comps 11 comps
| Address | Beds | Baths | Sqft | Rent | $/sqft | DOM | Units | Dist |
|---|---|---|---|---|---|---|---|---|
| 16901 Orchard Ridge Ave Hazel Crest, IL | 4.0 | 2.0 | 1406 | $2,700 | $1.92 | 1d | 1 | 0.08mi |
| 2308 170th St Hazel Crest, IL | 3.0 | 2.0 | 1020 | $2,400 | $2.35 | 1d | 1 | 0.12mi |
| 16751 Crane Ave Hazel Crest, IL | 3.0 | 1.0 | 1200 | $1,800 | $1.50 | 1d | 1 | 0.29mi |
| 2173 171st St Hazel Crest, IL | 3.0 | 1.5 | 1159 | $2,350 | $2.03 | 1d | 1 | 0.35mi |
| 2107 171st St Unit 2107 Hazel Crest, IL | 3.0 | 1.5 | 1158 | $2,300 | $1.99 | 1d | 1 | 0.43mi |
| 17561 Hillside Ave Homewood, IL | 3.0 | 1.0 | 1174 | $2,300 | $1.96 | 1d | 1 | 0.85mi |
| 17561 Hillside Ave Homewood, IL | 3.0 | 1.0 | 1174 | $2,500 | $2.13 | 17d | 1 | 0.85mi |
| 17306 Holmes Ave Hazel Crest, IL | 3.0 | 2.0 | 1535 | $2,195 | $1.43 | 5d | 1 | 0.88mi |
| 2722 Larkspur Ln Hazel Crest, IL | 3.0 | 1.5 | 1441 | $2,650 | $1.84 | 12d | 1 | 0.94mi |
| 2223 Hawthorne Rd Homewood, IL | 3.0 | 2.0 | 1552 | $2,300 | $1.48 | 24d | 1 | 0.96mi |
| 16125 Marshfield Ave Markham, IL | 3.0 | 1.0 | 1043 | $2,400 | $2.30 | 1d | 1 | 1.38mi |
Listing history 39 events
-
2026-06-18price $159,000 Active 8 DOM
-
2026-06-18days on market $162,000 Active 8 DOM
-
2026-06-17days on market $162,000 Active 7 DOM
-
2026-06-16days on market $162,000 Active 6 DOM
-
2026-06-15days on market $162,000 Active 5 DOM
-
2026-06-13days on market $162,000 Active 3 DOM
-
2026-06-13days on market $162,000 Active 2 DOM
-
2026-06-09days on market $162,000 Active 207 DOM
-
2026-06-08days on market $162,000 Active 206 DOM
-
2026-06-07days on market $162,000 Active 205 DOM
-
2026-06-04days on market $162,000 Active 202 DOM
-
2026-06-03days on market $162,000 Active 201 DOM
-
2026-06-02days on market $162,000 Active 200 DOM
-
2026-06-01days on market $162,000 Active 199 DOM
-
2026-05-31days on market $162,000 Active 198 DOM
-
2026-05-22price $162,000
-
2026-04-24price $165,000
-
2026-03-27price $168,000
-
2026-02-27price $171,000
-
2026-01-30price $176,000
-
2026-01-09price $183,000
-
2025-11-14$191,000 Active
-
2022-06-20price $1,195
-
2013-02-07soldstatus $35,000 Closed Sale 323-char remark
Show marketing remark (323 chars)
Large home being sold as is. Seller looking for quick sale. Property in move in condition minimal repairs needed. 4 bedrooms, 1.5 baths recent updates, very large fenced yard for family fun. directly across from school and near parks. Own for less than rent!! Seller will not provide survey, termite or warranty of any kind
-
2012-12-18status Pending 323-char remark
Show marketing remark (323 chars)
Large home being sold as is. Seller looking for quick sale. Property in move in condition minimal repairs needed. 4 bedrooms, 1.5 baths recent updates, very large fenced yard for family fun. directly across from school and near parks. Own for less than rent!! Seller will not provide survey, termite or warranty of any kind
-
2012-11-17price $35,000 Price Change 323-char remark
Show marketing remark (323 chars)
Large home being sold as is. Seller looking for quick sale. Property in move in condition minimal repairs needed. 4 bedrooms, 1.5 baths recent updates, very large fenced yard for family fun. directly across from school and near parks. Own for less than rent!! Seller will not provide survey, termite or warranty of any kind
-
2012-10-18price $25,000 Price Change 323-char remark
Show marketing remark (323 chars)
Large home being sold as is. Seller looking for quick sale. Property in move in condition minimal repairs needed. 4 bedrooms, 1.5 baths recent updates, very large fenced yard for family fun. directly across from school and near parks. Own for less than rent!! Seller will not provide survey, termite or warranty of any kind
-
2012-08-24$27,000 New 323-char remark
Show marketing remark (323 chars)
Large home being sold as is. Seller looking for quick sale. Property in move in condition minimal repairs needed. 4 bedrooms, 1.5 baths recent updates, very large fenced yard for family fun. directly across from school and near parks. Own for less than rent!! Seller will not provide survey, termite or warranty of any kind
-
2009-07-01soldstatus $30,000 Closed Sale 193-char remark
Show marketing remark (193 chars)
sUPER LARGE 4 BEDROOM 2 STORY AT AN ATTRACTIVE PRICE. PROOF OF FUNDS (IF CASH) OR LETTER FROM BANK/MTG COMPANY REFLECTING MTG COMMITMENT A MUST - NO EXCEPTIONS. EARNEST MONEY = CERTIFIED FUNDS.
-
2009-06-01historical 193-char remark
Show marketing remark (193 chars)
sUPER LARGE 4 BEDROOM 2 STORY AT AN ATTRACTIVE PRICE. PROOF OF FUNDS (IF CASH) OR LETTER FROM BANK/MTG COMPANY REFLECTING MTG COMMITMENT A MUST - NO EXCEPTIONS. EARNEST MONEY = CERTIFIED FUNDS.
-
2009-05-06price $31,500 193-char remark
Show marketing remark (193 chars)
sUPER LARGE 4 BEDROOM 2 STORY AT AN ATTRACTIVE PRICE. PROOF OF FUNDS (IF CASH) OR LETTER FROM BANK/MTG COMPANY REFLECTING MTG COMMITMENT A MUST - NO EXCEPTIONS. EARNEST MONEY = CERTIFIED FUNDS.
-
2009-04-03price $34,500 193-char remark
Show marketing remark (193 chars)
sUPER LARGE 4 BEDROOM 2 STORY AT AN ATTRACTIVE PRICE. PROOF OF FUNDS (IF CASH) OR LETTER FROM BANK/MTG COMPANY REFLECTING MTG COMMITMENT A MUST - NO EXCEPTIONS. EARNEST MONEY = CERTIFIED FUNDS.
-
2009-04-02status 193-char remark
Show marketing remark (193 chars)
sUPER LARGE 4 BEDROOM 2 STORY AT AN ATTRACTIVE PRICE. PROOF OF FUNDS (IF CASH) OR LETTER FROM BANK/MTG COMPANY REFLECTING MTG COMMITMENT A MUST - NO EXCEPTIONS. EARNEST MONEY = CERTIFIED FUNDS.
-
2009-03-17historical 193-char remark
Show marketing remark (193 chars)
sUPER LARGE 4 BEDROOM 2 STORY AT AN ATTRACTIVE PRICE. PROOF OF FUNDS (IF CASH) OR LETTER FROM BANK/MTG COMPANY REFLECTING MTG COMMITMENT A MUST - NO EXCEPTIONS. EARNEST MONEY = CERTIFIED FUNDS.
-
2009-03-04price $39,900 193-char remark
Show marketing remark (193 chars)
sUPER LARGE 4 BEDROOM 2 STORY AT AN ATTRACTIVE PRICE. PROOF OF FUNDS (IF CASH) OR LETTER FROM BANK/MTG COMPANY REFLECTING MTG COMMITMENT A MUST - NO EXCEPTIONS. EARNEST MONEY = CERTIFIED FUNDS.
-
2009-01-29price $44,500 193-char remark
Show marketing remark (193 chars)
sUPER LARGE 4 BEDROOM 2 STORY AT AN ATTRACTIVE PRICE. PROOF OF FUNDS (IF CASH) OR LETTER FROM BANK/MTG COMPANY REFLECTING MTG COMMITMENT A MUST - NO EXCEPTIONS. EARNEST MONEY = CERTIFIED FUNDS.
-
2008-12-31$49,900 193-char remark
Show marketing remark (193 chars)
sUPER LARGE 4 BEDROOM 2 STORY AT AN ATTRACTIVE PRICE. PROOF OF FUNDS (IF CASH) OR LETTER FROM BANK/MTG COMPANY REFLECTING MTG COMMITMENT A MUST - NO EXCEPTIONS. EARNEST MONEY = CERTIFIED FUNDS.
-
2005-06-07soldstatus $96,000
-
1990-05-25soldstatus $49,000
ⓘ Source: listings_history table (triggers on properties + properties_extension) + one-shot
backfill from property_details.listing_events for pre-trigger history.
Tax reassessment forecast IL · Partial reset (capped growth)
- Current annual tax
- $5,310 · $442/mo
- Projected year-2 tax
- $5,310 · $442/mo
- Expected delta
- $0/yr ($0/mo · 0.0%)
ⓘ Screening estimate from a state-policy table — verify with the county assessor before closing.
Climate risk First Street
- Flood 1/10 Low FEMA zone X (unshaded) · 0% chance over 30 yrs
- Wildfire 1/10 Low
- Heat 3/10 Moderate 7 d/yr ≥102°F today · 15 d/yr by 30 yrs out
- Wind 2/10 Low
- Air quality 3/10 Moderate 4 unhealthy d/yr today · 4 by 30 yrs out
Nearby sold comps map
Loading sold comps map…
Walkable amenities ~0.75 mi
Loading nearby amenities…
Taxation est. · year 1
- Rental income
- $28,992
- − Mortgage interest
- −$8,906
- − Property taxes
- −$5,310
- − Insurance
- −$795
- − Repairs & maintenance
- −$2,319
- − Management
- −$2,319
- − Depreciation
- −$4,625
- Taxable income
- $4,717
- Est. tax owed @ 24.0%
- −$1,132
- After-tax cash flow
- $5,661/yr
For passive investors: Depreciation is non-cash, so a rental often shows a tax loss while cash-flowing — sheltering income. Rental losses are passive: they offset passive income freely, and up to $25,000/yr can offset ordinary (W-2) income if you actively participate and your MAGI is under $100k (phasing out to $0 by $150k); unused losses carry forward. On sale, claimed depreciation is recaptured at up to 25%, and gains may owe capital-gains tax (a 1031 exchange can defer both). Figures are a year-1 estimate at your 24.0% rate — not tax advice; consult a CPA.
Schools (NCES district)
- District
- Thornton Twp Hsd 205
- NCES district ID
- 1738970
- Math proficiency
- 7% ▬ 0.00%
- Reading proficiency
- 8% ▼ -2.00%
- Median HH income
- $43,392
- Composite
- 6.92/100
- National rank
- #9976
- State rank
- #594 of 620 in IL
Livability — Hazel Crest
- Score
- 75/100
- State rank
- #229
- US rank
- #4242
Category grades
Schools grade is shown separately in the Schools card above.
Census & demographics
- Census place
- Hazel Crest, IL
- City population
- 14,602
- Population (ZIP)
- 14,602
Population outlook (Cook County) Hauer SSP2
- Today (2025)
- 5,347,519 people
- By 2030
- 5,357,703 · +0.2%
- By 2040
- 5,324,924 · -0.4%
- By 2050
- 5,230,762 · -2.2%
- By 2075
- 4,785,735 · -10.5%
- By 2100
- 4,188,836 · -21.7%
Race, ethnicity, and origin ACS 2023
- Neighborhood character
- Predominantly Black (83%)
- Race & ethnicity
- Black 83% White 7% Hispanic / Latino 7% Two or more races 4%
- Hispanic origin (detail)
- Mexican 6%
- Common ancestry
- Romanian 1% Iranian 1%
- Foreign-born
- 5% · Canada
- Languages at home
- 93% English-only · Spanish 6%
Political lean MEDSL · Cook
- 2024 margin
- Solid D (+42.0) · D 70.4% · R 28.4% · Other 1.2%
- 2008→2024 swing
- -11.4pp toward R · 2008: 53.4pp · 2024: 42.0pp
- All cycles
- 2024: D+42.0 2020: D+50.3 2016: D+53.0 2012: D+49.4 2008: D+53.4
Not yet ingested
- Civics
- —
Market trends
- HPI YoY
- ▼ -46.04%
- Current HPI
- 282.3552
- Rent YoY
- —
- Metro
- —
- State GDP YoY
- ▲ 1.59%
- F500 in state
- 60
Industry mix (Fortune 500 HQ in IL)
| Industry | F500 HQs | Revenue |
|---|---|---|
| Insurance | 4 | $201B |
|
||
| Consumer Goods | 4 | $87B |
|
||
| Industrial Machinery | 3 | $64B |
|
||
| Healthcare | 2 | $55B |
|
||
| Retail / Pharmacy | 1 | $148B |
|
||
| Agriculture / Food | 1 | $86B |
|
||
Price history
+230.6% since first listed24 events — show timeline
- 2026-05-22 Price Changed $162,000 MRED as Distributed by MLS Grid
- 2026-04-24 Price Changed $165,000 MRED as Distributed by MLS Grid
- 2026-03-27 Price Changed $168,000 MRED as Distributed by MLS Grid
- 2026-02-27 Price Changed $171,000 MRED as Distributed by MLS Grid
- 2026-01-30 Price Changed $176,000 MRED as Distributed by MLS Grid
- 2026-01-09 Price Changed $183,000 MRED as Distributed by MLS Grid
- 2025-11-14 Listed $191,000 MRED as Distributed by MLS Grid
- 2022-06-20 Price Changed $1,195 RENT.
- 2013-02-07 Sold (MLS) $35,000 MRED as Distributed by MLS Grid
- 2012-12-18 Pending — MRED as Distributed by MLS Grid
- 2012-11-17 Price Changed $35,000 MRED as Distributed by MLS Grid
- 2012-10-18 Price Changed $25,000 MRED as Distributed by MLS Grid
- 2012-08-24 Listed $27,000 MRED as Distributed by MLS Grid
- 2009-07-01 Sold (MLS) $30,000 MRED as Distributed by MLS Grid
- 2009-06-01 Listing Removed — MRED as Distributed by MLS Grid
- 2009-05-06 Price Changed $31,500 MRED as Distributed by MLS Grid
- 2009-04-03 Price Changed $34,500 MRED as Distributed by MLS Grid
- 2009-04-02 Relisted — MRED as Distributed by MLS Grid
- 2009-03-17 Listing Removed — MRED as Distributed by MLS Grid
- 2009-03-04 Price Changed $39,900 MRED as Distributed by MLS Grid
- 2009-01-29 Price Changed $44,500 MRED as Distributed by MLS Grid
- 2008-12-31 Listed $49,900 MRED as Distributed by MLS Grid
- 2005-06-07 Sold (Public Records) $96,000 Public Records
- 1990-05-25 Sold (Public Records) $49,000 Public Records
Property tax history
+2.5%/yrLatest (2023): $5,310 · -2.0% YoY. Source: county tax records.
Cash-flow waterfall
monthlySold comps — $/sqft
last 12 mo · ≤1 miLoading sold comps…