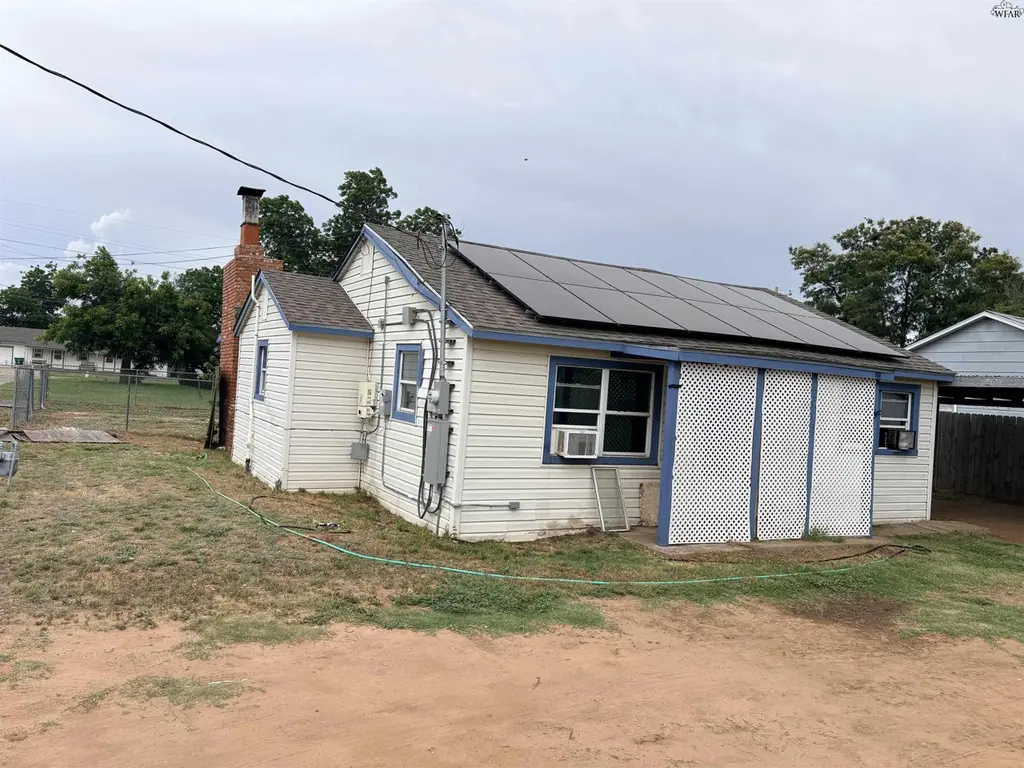
2603 14th St · Vernon, TX
Flood risk 1/10 · Minimal
- FEMA flood zone
- X
- Chance of flooding over 30 yrs
- 0.0%
- Est. flood insurance / yr
- $507 – $1,088
Fire risk 6/10 · Moderate
- Est. fire insurance / yr
- $1,222 – $2,270
Heat risk 7/10 · Major
- Hot days now (above 108°F)
- 7 days/yr
- Hot days in 30 yrs
- 20 days/yr
Wind risk 3/10 · Minor
- Chance of severe wind over 30 yrs
- 6.0%
Air-quality risk 1/10 · Minimal
- Unhealthy air days now
- 0 days/yr
- Unhealthy air days in 30 yrs
- 0 days/yr
Risk factors via First Street. Map © Google.
Why this score? — see what drove the B- grade
The composite is a weighted blend of 9 inputs, each scored 0–100. Each bar is that input's sub-score; the figure is the points it added to the 100-point composite (weight × sub-score).
- Cash flow +30.0/30.0
- 1% rule +10.0/10.0
- DSCR +10.0/10.0
- ARV discount +7.5/15.0
- Livability +3.0/5.0
- Rent growth +2.5/5.0
- Condition / age +2.5/5.0
- Schools +2.4/10.0
- Appreciation +0.0/10.0
$94,000
🖨 Deal sheet 📄 Offer letter ✓ Due diligence
Key facts
- Built 1948
- Listed 7 days
Property features AI
Exterior
- Home design: Single-family residence; One-story
- Construction: Wood siding construction
- Exterior features: Composition roof
Interior
- Flooring: Carpet
- Heating & cooling: Central heating (electric); Central air conditioning
- Interior features: Carpet flooring; Fireplace in family room; Central heating; Electric heating; Central air conditioning
Neighborhood map
What this means for you Summary
Snapshot
- This is a 2-bed/1.0-bath single-family listed at $94k.
Deal economics
- At list price, monthly cash flow is $679 ($8k/yr) — positive.
- The deal already cash-flows at list — no discount required.
- Meets the 1% rule at list price ($2k rent vs $94k).
Location & tenants
- Location reads 60/100 on livability (#1,078 in TX) — a middle-class / working-renter tenant base. Strengths: cost of living A+, housing A+; Watch: health & safety C-, crime D, amenities F.
- Vernon ISD (town): math 27% / reading 29% proficiency, ranked #673 of 826 in TX (top 82%) — low school quality limits family demand, transient renter base, plan for 1-2y turnover.
- Zoned schools: Vernon Middle (math 24% / reading 27%, grade F, #1,236 of 1,662 statewide, top 76%, 371 students, 72% FRL); Vernon H S (math 37% / reading 32%, grade F, #963 of 1,632 statewide, top 61%, 532 students, 60% FRL).
- Market conditions: 26 active listings in the ZIP; 19 units permitted in Wilbarger County in 2024 (15 in 5+ unit buildings).
Forward outlook
- Local home prices are declining (-3.0%/yr); year-one equity from $650 of loan paydown is wiped out by about $3k of value loss. Plan a longer hold.
- Wilbarger County population projected to shrink 9% by 2050 — rents likely to lag national; underwrite the cash flow, not the appreciation.
- At projected returns (-3.0% appreciation + 3.0% rent growth), your $26k cash investment doubles in ~4 years — after that, you're playing with house money.
Negotiation context
- Only 8 days on market — expect competitive offers; lowballing is unlikely to land.
- 2 sale attempts since 5y ago with the ask held roughly flat each time — persistent listings suggest the price (not the market) is what's stuck; bring a comps-based counter.
Risks & watch-outs
- Watch-outs: built in 1948 — expect roof / HVAC / electrical / plumbing capex.
- Climate carrying-cost: major wildfire risk; extreme-heat days projected 7→20/yr by 2055 (HVAC capex compounding) — expect insurance premiums to compound above CPI over the hold.
Questions for the listing agent
- Built in 1948 — when were the roof, HVAC, electrical panel, plumbing, and water heater last replaced?
- Is there a deadline driving the sale (1031 exchange, divorce, estate, relocation)? That informs how much negotiation room exists.
- Schools are F-rated, which usually means shorter tenancies and higher turnover. Who's the typical renter profile here, and what's been the actual vacancy rate?
- Crime grade is D in this area — have there been break-ins, vandalism, or insurance claims at this property in the last 3 years? What carrier currently insures it and at what premium?
- What's the average days-on-market for RENTAL listings here right now (not sales)? A rising rental-DOM trend means longer vacancies and softer asking-rent achievability than the comps imply.
- What's the recent tenant-quality profile in this submarket — average credit score on applications, eviction rate, late-payment / NSF rate, and stable-employment percentage? A property-management company in the area should have these aggregated.
- How much new for-sale + rental construction is in the pipeline within 1–3 miles? Heavy new supply typically softens prices + rents 12–24 months out; constrained supply supports both.
Investment metrics
- 1% rule
- 1.78% ✓
- Cap rate
- 14.95%
- Cash-on-cash
- 30.94%
- DSCR
- 2.38
- GRM
- 4.7
CMA / ARV
No comps found within radius.
Projected returns pro-forma
-3.0% appreciation · 3.0% rent growth · sell at horizon
- IRR
- 25.7%
- Equity multiple
- 2.06×
- Total profit
- $28,004
- Equity at exit
- $14,016
- IRR
- 33.4%
- Equity multiple
- 4.04×
- Total profit
- $80,116
- Equity at exit
- $8,127
Cash invested: $26,320 (down + closing). Projections, not guarantees.
Landlord ↔ Tenant lean methodology
- Overall (STATE)
- 87 Strongly Landlord-Friendly
- State Texas
- 87 Strongly Landlord-Friendly · R+5
- County
- — inherits STATE
- City
- — inherits STATE
ZIP-level market 76384
- Active inventory
- 26
- Price-to-rent
- 4.7×
Monthly cashflow live
- Estimated rent
- $1,672 medium interval (Pro) →
- Mortgage (P&I)
- −$493
- Tax from tax record
- −$110 /mo · $1,322/yr
- Insurance
- −$39
- HOA
- −$0
- Vacancy / Maint / Mgmt
- −$351
- Net cashflow
- $679
Break-even live
UW: 25.0% down · 7.5% · 30yr · 1.5% tax · 5.0% vac · 8.0% maint · 8.0% mgmt
Financing live
Cash to close
- Down payment
- $23,500
- Closing costs
- $2,820
- Reserves months
- —
- Total cash needed
- —
Loan-product check · same deal, 3 products live
Conventional
25% down · 7.5% · 30yr
- Down + closing
- —
- Monthly P&I
- —
- Monthly cashflow
- —
- DSCR
- —
- Eligible?
- —
Personal DTI + credit; lowest rate.
DSCR
20% down · 8.5% · 30yr
- Down + closing
- —
- Monthly P&I
- —
- Monthly cashflow
- —
- DSCR
- —
- Eligible?
- —
No personal income docs; deal must DSCR.
Hard money
10% down · 12.0% · 12mo
- Down + closing
- —
- Monthly P&I
- —
- Monthly cashflow
- —
- DSCR
- —
- Eligible?
- —
Short-term bridge; refi at stabilization.
Listing history 7 events
-
2026-06-18days on market $94,000 Active 8 DOM
-
2026-06-17days on market $94,000 Active 7 DOM
-
2026-06-16days on market $94,000 Active 6 DOM
-
2026-06-15days on market $94,000 Active 5 DOM
-
2026-06-15days on market $94,000 Active 4 DOM
-
2026-06-13days on market $94,000 Active 3 DOM
-
2026-06-12$94,000 Active 2 DOM
ⓘ Source: listings_history table (triggers on properties + properties_extension) + one-shot
backfill from property_details.listing_events for pre-trigger history.
Tax reassessment forecast TX · Resets to sale price
- Current annual tax
- $1,322 · $110/mo
- Projected year-2 tax
- $1,720 · $143/mo
- Expected delta
- +$398/yr (+$33/mo · 30.1%)
ⓘ Screening estimate from a state-policy table — verify with the county assessor before closing.
Climate risk First Street
- Flood 1/10 Low FEMA zone X · 0% chance over 30 yrs
- Wildfire 6/10 Major
- Heat 7/10 Severe 7 d/yr ≥108°F today · 20 d/yr by 30 yrs out
- Wind 3/10 Moderate 6% chance of damaging wind over 30 yrs
- Air quality 1/10 Low 0 unhealthy d/yr today · 0 by 30 yrs out
Nearby sold comps map
Loading sold comps map…
Walkable amenities ~0.75 mi
Loading nearby amenities…
Taxation est. · year 1
- Rental income
- $20,063
- − Mortgage interest
- −$5,265
- − Property taxes
- −$1,322
- − Insurance
- −$470
- − Repairs & maintenance
- −$1,605
- − Management
- −$1,605
- − Depreciation
- −$2,735
- Taxable income
- $7,061
- Est. tax owed @ 24.0%
- −$1,695
- After-tax cash flow
- $6,448/yr
For passive investors: Depreciation is non-cash, so a rental often shows a tax loss while cash-flowing — sheltering income. Rental losses are passive: they offset passive income freely, and up to $25,000/yr can offset ordinary (W-2) income if you actively participate and your MAGI is under $100k (phasing out to $0 by $150k); unused losses carry forward. On sale, claimed depreciation is recaptured at up to 25%, and gains may owe capital-gains tax (a 1031 exchange can defer both). Figures are a year-1 estimate at your 24.0% rate — not tax advice; consult a CPA.
Schools (NCES district)
- District
- Vernon ISD
- NCES district ID
- 4844110
- Math proficiency
- 27% ▼ -3.00%
- Reading proficiency
- 29% ▲ 1.00%
- Median HH income
- $41,161
- Composite
- 23.7/100
- National rank
- #7832
- State rank
- #673 of 826 in TX
Livability — Vernon
- Score
- 60/100
- State rank
- #1078
- US rank
- #19117
Category grades
Schools grade is shown separately in the Schools card above.
Census & demographics
- Census place
- Vernon, TX
- City population
- 12,239
- Population (ZIP)
- 12,239
Population outlook (Wilbarger County) Hauer SSP2
- Today (2025)
- 12,496 people
- By 2030
- 12,234 · -2.1%
- By 2040
- 11,769 · -5.8%
- By 2050
- 11,375 · -9.0%
- By 2075
- 10,532 · -15.7%
- By 2100
- 9,071 · -27.4%
Race, ethnicity, and origin ACS 2023
- Neighborhood character
- Diverse neighborhood (Simpson 0.60)
- Race & ethnicity
- White 54% Hispanic / Latino 31% Two or more races 17% Black 6% Asian 3%
- Hispanic origin (detail)
- Mexican 26%
- Common ancestry
- Italian 3% Slovak 1% Lithuanian 1%
- Foreign-born
- 5% · Canada, Philippines
- Languages at home
- 81% English-only · Spanish 17% Other Asian/Pacific 1%
Political lean MEDSL · Wilbarger
- 2024 margin
- Solid R (+60.6) · D 19.3% · R 79.9%
- 2008→2024 swing
- -14.3pp toward R · 2008: -46.3pp · 2024: -60.6pp
- All cycles
- 2024: R+60.6 2020: R+56.8 2016: R+57.5 2012: R+49.9 2008: R+46.3
Not yet ingested
- Civics
- —
Market trends
- HPI YoY
- ▼ -99.65%
- Current HPI
- 110.9147
- Rent YoY
- —
- Metro
- —
- State GDP YoY
- ▲ 3.95%
- F500 in state
- 110
Industry mix (Fortune 500 HQ in TX)
| Industry | F500 HQs | Revenue |
|---|---|---|
| Energy | 16 | $1,198B |
|
||
| Technology | 5 | $198B |
|
||
| Engineering / Construction | 4 | $72B |
|
||
| Energy Services | 3 | $60B |
|
||
| Utilities | 3 | $41B |
|
||
| Healthcare | 2 | $330B |
|
||
Price history
+59.3% since first listed5 events — show timeline
- 2026-06-10 Listed $94,000 WFAOR
- 2022-02-07 Sold (Public Records) — Public Records
- 2022-02-07 Sold (MLS) — WFAOR
- 2021-11-04 Listed $59,000 WFAOR
- 2017-12-04 Sold (Public Records) — Public Records
Property tax history
+4.7%/yrLatest (2025): $1,322 · +17.2% YoY. Source: county tax records.
Cash-flow waterfall
monthlySold comps — $/sqft
last 12 mo · ≤1 miLoading sold comps…