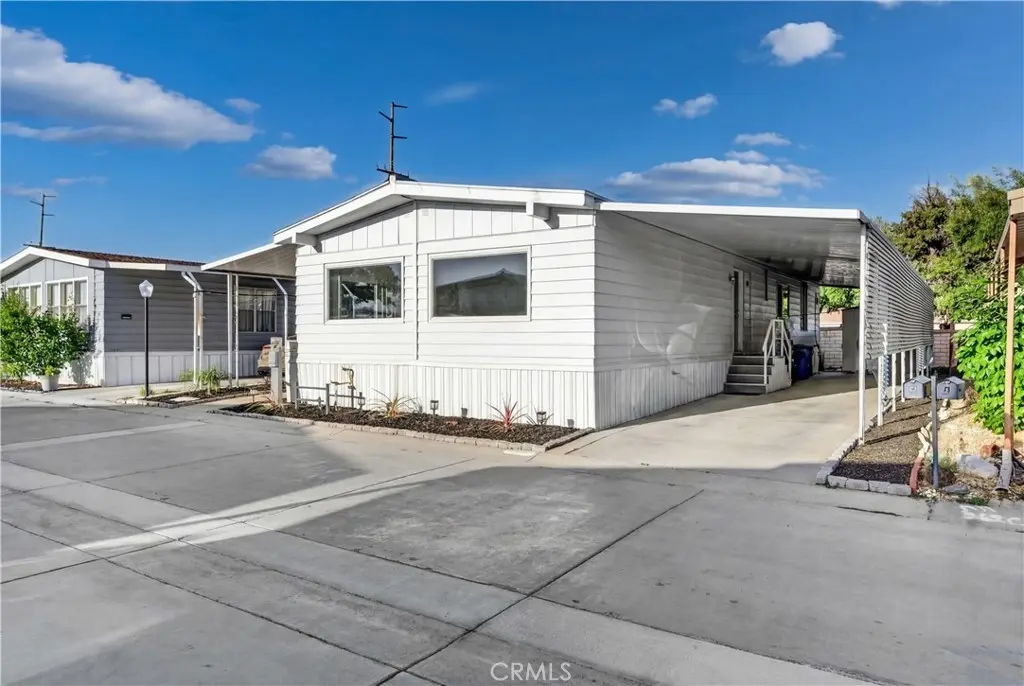
27701 Murrieta #5 · Menifee, CA
Flood risk 1/10 · Minimal
- FEMA flood zone
- X (unshaded)
- Chance of flooding over 30 yrs
- 0.0%
- Est. flood insurance / yr
- $507 – $1,088
Fire risk 7/10 · Major
- Est. fire insurance / yr
- $659 – $1,223
Heat risk 7/10 · Major
- Hot days now (above 105°F)
- 6 days/yr
- Hot days in 30 yrs
- 16 days/yr
Wind risk 1/10 · Minimal
- Chance of severe wind over 30 yrs
- —
Air-quality risk 5/10 · Moderate
- Unhealthy air days now
- 9 days/yr
- Unhealthy air days in 30 yrs
- 11 days/yr
Risk factors via First Street. Map © Google.
Why this score? — see what drove the B- grade
The composite is a weighted blend of 9 inputs, each scored 0–100. Each bar is that input's sub-score; the figure is the points it added to the 100-point composite (weight × sub-score).
- Cash flow +30.0/30.0
- 1% rule +10.0/10.0
- DSCR +10.0/10.0
- Schools +4.5/10.0
- Rent growth +4.0/5.0
- ARV discount +3.2/15.0
- Livability +3.2/5.0
- Condition / age +2.5/5.0
- Appreciation +0.0/10.0
$145,000
🖨 Deal sheet 📄 Offer letter ✓ Due diligence
Listing remarks
This well-priced, modernized 1,440 sq. ft. manufactured home is situated in a peaceful 55+ community. It boasts fresh interior and exterior paint, mostly new doors, modern updated flooring, new vanities in both the primary and secondary baths, a new shower in the secondary bath, updated lighting and plumbing fixtures, and a dedicated laundry room. The layout includes a spacious primary bedroom, a second bedroom, a large kitchen, separate dining area, generous living room, and an expansive porch. The community offers a clubhouse, pool, and activities, and is conveniently located near shopping, dining, and about 30 minutes from Temecula wineries, Old Town, and Pechanga Resort. Please note, so
Key facts
- New doors
- New shower
- Fresh interior paint
Tags
Property features AI
Finance
- Other: Sprinklers: none
- Financial info: Monthly land lease of $712.50 (park lease)
- HOA & community: Part of an association; Senior community; Association amenities include pool, spa, clubhouse, permitted pets and security
Exterior
- Parking: Park name: Hillside
- Security: Community security (association amenity)
- Utilities: Public sewer; District/public water; Natural gas connected; Electricity connected
- Home design: Single-story home; Mobile home remains on site
- Construction: Year built (public records); Mobile home dimensions approximately 40' x 24'
- Exterior features: Community pool; Street lighting
Interior
- Kitchen: Kitchen included
- Bedrooms: All bedrooms located on the ground floor
- Bathrooms: 2 full bathrooms; Master bathroom with double sinks; Bathtub and walk-in shower
- Heating & cooling: Central furnace heating
- Interior features: Unfurnished; Front porch entry; Single-level (one story); Entry on main level
- Laundry & utility: Separate laundry room
Neighborhood map
What this means for you Summary
Snapshot
- This is a 2-bed/2.0-bath manufactured listed at $145k.
Deal economics
- At list price, monthly cash flow is $867 ($10k/yr) — positive.
- The deal already cash-flows at list — no discount required.
- Meets the 1% rule at list price ($2k rent vs $145k).
- Recommended offer: $143k (1.5% below list) — sets the bar for market timing.
- Cap rate 13.5% vs local median 3.6% in Menifee — top-decile yield for the area; either an underpriced asset or a hidden risk that comps aren't pricing in. Stress-test before assuming the spread holds.
Location & tenants
- Location reads 64/100 on livability (#407 in CA) — a middle-class / working-renter tenant base. Strengths: housing A+, crime A, employment A-; Watch: schools D+, health & safety D+, amenities D.
- Menifee Union Elementary (suburban): math 43% / reading 56% proficiency, ranked #434 of 1,400 in CA (top 31%) — families likely to look elsewhere, expect single-tenant / working-renter base with shorter leases.
- Market conditions: Rents rising fast (+6.1%/yr); 197 active listings in the ZIP; 29 comparable units currently listed for rent nearby; rentals leasing fast (median 2d on market — plan ~1-2 weeks tenant-placement turnaround); 9,195 units permitted in Riverside County in 2024 (1,512 in 5+ unit buildings).
- At $2,366/mo this rent would consume 49% of the median local household income ($58k/yr) (locally 1163% of renters already pay >50% of income on rent) — very limited rent-growth headroom before tenants either downsize or default.
Forward outlook
- Local home prices are declining (-3.0%/yr); year-one equity from $1k of loan paydown is wiped out by about $4k of value loss. Plan a longer hold.
- Riverside County population projected at +22% by 2050 — long-run rental-demand tailwind backs the buy-and-hold thesis.
- At projected returns (-3.0% appreciation + 6.1% rent growth), your $41k cash investment doubles in ~5 years — after that, you're playing with house money.
Negotiation context
- It's been on market 15 days — a 2% lower offer ($143k) is reasonable based on typical stale-listing flexibility.
- 9 sale attempts since 15y ago with the ask held roughly flat each time — persistent listings suggest the price (not the market) is what's stuck; bring a comps-based counter.
- Current owner paid $38k; list at $145k implies a 282% gain — meaningful room to come down on a strong offer.
Risks & watch-outs
- Climate carrying-cost: major wildfire risk; extreme-heat days projected 6→16/yr by 2055 (HVAC capex compounding) — expect insurance premiums to compound above CPI over the hold.
Questions for the listing agent
- Built in 1974 — when were the roof, HVAC, electrical panel, plumbing, and water heater last replaced?
- Is there a deadline driving the sale (1031 exchange, divorce, estate, relocation)? That informs how much negotiation room exists.
- Schools are D-rated, which usually means shorter tenancies and higher turnover. Who's the typical renter profile here, and what's been the actual vacancy rate?
- What's the average days-on-market for RENTAL listings here right now (not sales)? A rising rental-DOM trend means longer vacancies and softer asking-rent achievability than the comps imply.
- What's the recent tenant-quality profile in this submarket — average credit score on applications, eviction rate, late-payment / NSF rate, and stable-employment percentage? A property-management company in the area should have these aggregated.
- How much new for-sale + rental construction is in the pipeline within 1–3 miles? Heavy new supply typically softens prices + rents 12–24 months out; constrained supply supports both.
Investment metrics
- 1% rule
- 1.63% ✓
- Cap rate
- 13.47%
- Cash-on-cash
- 25.63%
- DSCR
- 2.14
- GRM
- 5.1
CMA / ARV
- ARV (on-the-fly)
- $132,480
- Comps found
- 12
Show comp detail 12 sales within ~0.75 mi
| Address | Dist | Beds/Ba | Sqft | Sold | Price | $/sf | Match |
|---|---|---|---|---|---|---|---|
| 27701 Murrieta #82 | 0.12mi | 2/2.0 | 1,440 (0%) | 1mo | $100,000 | $69 | 94 |
| 27701 Murrieta #56 | 0.12mi | 3/2.0 (+1) | 1,440 (0%) | 2mo | $100,000 | $69 | 88 |
| 27701 Murrieta Rd #255 | 0.12mi | 2/2.0 | 1,344 (-7%) | 0mo | $45,000 | $33 | 83 |
| 27701 Murrieta Rd #111 | 0.12mi | 3/2.0 (+1) | 1,508 (+5%) | 2mo | $115,000 | $76 | 80 |
| 27250 Murrieta #120 | 0.57mi | 2/2.0 | 1,440 (0%) | 1mo | $200,000 | $139 | 73 |
| 27250 Murrieta Rd #109 | 0.57mi | 2/2.0 | 1,440 (0%) | 1mo | $170,600 | $118 | 72 |
| 27250 Murrieta #217 | 0.57mi | 3/2.0 (+1) | 1,488 (+3%) | 2mo | $215,000 | $144 | 61 |
| 27250 Murrieta Rd #359 | 0.57mi | 2/2.0 | 1,320 (-8%) | 1mo | $55,000 | $42 | 58 |
| 27250 Murrieta #85 | 0.57mi | 2/2.0 | 1,570 (+9%) | 0mo | $145,000 | $92 | 58 |
| 27250 Murrieta Rd #332 | 0.57mi | 2/2.0 | 1,570 (+9%) | 1mo | $160,000 | $102 | 57 |
| 27250 Murrieta #126 | 0.53mi | 3/2.0 (+1) | 1,568 (+9%) | 0mo | $225,000 | $143 | 55 |
| 27250 Murrieta Rd #216 | 0.57mi | 2/2.0 | 1,296 (-10%) | 2mo | $110,000 | $85 | 55 |
Match score weights: distance 35% · size 25% · config 20% · recency 20%. Top-matched comps best support the ARV.
Projected returns pro-forma
-3.0% appreciation · 6.1% rent growth · sell at horizon
- IRR
- 22.7%
- Equity multiple
- 1.97×
- Total profit
- $39,386
- Equity at exit
- $21,620
- IRR
- 32.7%
- Equity multiple
- 4.42×
- Total profit
- $138,847
- Equity at exit
- $12,537
Cash invested: $40,600 (down + closing). Projections, not guarantees.
Landlord ↔ Tenant lean methodology
- Overall (STATE)
- 18 Strongly Tenant-Friendly
- State California
- 18 Strongly Tenant-Friendly · D+13
- County
- — inherits STATE
- City
- — inherits STATE
ZIP-level market 92586
- Home prices YoY
- -19.1%
- Rents YoY
- 6.1%
- Active inventory
- 197
- Price-to-rent
- 5.1×
Monthly cashflow live
- Estimated rent
- $2,366 high interval (Pro) →
- Mortgage (P&I)
- −$760
- Tax est. 1.5%
- −$181 /mo · $2,175/yr
- Insurance
- −$60
- HOA
- −$0
- Vacancy / Maint / Mgmt
- −$497
- Net cashflow
- $867
Break-even live
UW: 25.0% down · 7.5% · 30yr · 1.5% tax · 5.0% vac · 8.0% maint · 8.0% mgmt
Financing live
Cash to close
- Down payment
- $36,250
- Closing costs
- $4,350
- Reserves months
- —
- Total cash needed
- —
Loan-product check · same deal, 3 products live
Conventional
25% down · 7.5% · 30yr
- Down + closing
- —
- Monthly P&I
- —
- Monthly cashflow
- —
- DSCR
- —
- Eligible?
- —
Personal DTI + credit; lowest rate.
DSCR
20% down · 8.5% · 30yr
- Down + closing
- —
- Monthly P&I
- —
- Monthly cashflow
- —
- DSCR
- —
- Eligible?
- —
No personal income docs; deal must DSCR.
Hard money
10% down · 12.0% · 12mo
- Down + closing
- —
- Monthly P&I
- —
- Monthly cashflow
- —
- DSCR
- —
- Eligible?
- —
Short-term bridge; refi at stabilization.
Rent comps 29 comps
| Address | Beds | Baths | Sqft | Rent | $/sqft | DOM | Units | Dist |
|---|---|---|---|---|---|---|---|---|
| 25861 McCall Blvd Menifee, CA | 2.0 | 2.0 | 1378 | $2,350 | $1.71 | 1d | 1 | 0.21mi |
| 28033 Radford Dr Menifee, CA | 2.0 | 2.0 | 1520 | $2,400 | $1.58 | 10d | 1 | 0.29mi |
| 29196 Crestone Dr Sun City, CA | 2.0 | 2.0 | 1393 | $1,995 | $1.43 | 19d | 1 | 0.39mi |
| 28055 Grosse Point Dr Menifee, CA | 1.0 | 1.0 | 1767 | $1,495 | $0.85 | 1d | 1 | 0.40mi |
| 26156 Birkdale Rd Menifee, CA | 2.0 | 2.0 | 1285 | $2,000 | $1.56 | 1d | 1 | 0.40mi |
| 28375 Paseo Grande Dr Menifee, CA | 2.0 | 2.0 | 1285 | $2,395 | $1.86 | 1d | 1 | 0.46mi |
| 26217 Birkdale Rd Menifee, CA | 1.0 | 1.0 | 876 | $2,150 | $2.45 | 1d | 1 | 0.46mi |
| 25650 Hartwick Rd Menifee, CA | 3.0 | 2.0 | 1603 | $2,650 | $1.65 | 22d | 1 | 0.50mi |
| 28323 Murrieta Rd Menifee, CA | 2.0 | 2.0 | 1098 | $2,350 | $2.14 | 20d | 1 | 0.51mi |
| 27305 Uppercrest Ct Menifee, CA | 3.0 | 2.0 | 1318 | $2,353 | $1.79 | 22d | 1 | 0.56mi |
| 25615 Union Hill Dr Menifee, CA | 3.0 | 2.0 | 1350 | $2,550 | $1.89 | 15d | 1 | 0.63mi |
| 28461 Portsmouth Dr Menifee, CA | 3.0 | 2.0 | 1450 | $2,685 | $1.85 | 1d | 1 | 0.75mi |
| 25781 Interlechen Dr Menifee, CA | 3.0 | 2.0 | 1554 | $2,800 | $1.80 | 1d | 1 | 0.94mi |
| 26542 Sun City Blvd Menifee, CA | 2.0 | 2.0 | 1530 | $2,295 | $1.50 | 10d | 1 | 1.00mi |
| 26772 Maris Ct Menifee, CA | 3.0 | 2.0 | 1715 | $2,800 | $1.63 | 1d | 1 | 1.00mi |
| 28880 Amersfoot Way Menifee, CA | 2.0 | 2.0 | 1386 | $2,400 | $1.73 | 1d | 1 | 1.06mi |
| 28894 Portsmouth Dr Menifee, CA | 2.0 | 2.0 | 1500 | $2,400 | $1.60 | 1d | 1 | 1.13mi |
| 27055 Fan Ln Menifee, CA | 2.0 | 2.0 | 1800 | $2,950 | $1.64 | 1d | 1 | 1.15mi |
| 25946 Ridgemoor Rd Menifee, CA | 3.0 | 2.0 | 1308 | $2,575 | $1.97 | 24d | 1 | 1.17mi |
| 25946 Ridgemoor Rd Menifee, CA | 3.0 | 2.0 | 1308 | $2,575 | $1.97 | 1d | 1 | 1.17mi |
| 28244 Encanto Dr Menifee, CA | 2.0 | 2.0 | 900 | $2,300 | $2.56 | 1d | 1 | 1.28mi |
| 28301 Encanto Dr Unit 10 Menifee, CA | 2.0 | 2.0 | 900 | $2,200 | $2.44 | 17d | 1 | 1.28mi |
| 28301 Encanto Dr Menifee, CA | 2.0 | 1.0–2.0 | 873 | $2,025 | $2.32 | 1d | 5 | 1.35mi |
| 26805 China Dr Menifee, CA | 3.0 | 2.5 | 1773 | $3,000 | $1.69 | 24d | 1 | 1.39mi |
| 29216 Deer Creek Cir Menifee, CA | 1.0 | 1.0 | 949 | $1,200 | $1.26 | 3d | 1 | 1.41mi |
| 25349 Silverwood Ln Menifee, CA | 3.0 | 2.0 | 1598 | $3,495 | $2.19 | 15d | 1 | 1.41mi |
| 29272 Murrieta Rd Unit 1 Menifee, CA | 2.0 | 1.0 | 940 | $1,995 | $2.12 | 1d | 1 | 1.43mi |
| 28377 Encanto Dr Menifee, CA | 1.0–3.0 | 1.0–2.0 | 815 | $2,150 | $2.64 | 1d | 7 | 1.46mi |
| 29250 Murrieta Rd Menifee, CA | 2.0 | 2.0 | 975 | $2,200 | $2.26 | 1d | 1 | 1.47mi |
Listing history 11 events
-
2026-06-18days on market $145,000 Active 15 DOM
-
2026-06-17days on market $145,000 Active 14 DOM
-
2026-06-16days on market $145,000 Active 13 DOM
-
2026-06-13days on market $145,000 Active 12 DOM
-
2026-06-09days on market $145,000 Active 8 DOM
-
2026-06-08days on market $145,000 Active 7 DOM
-
2026-06-07days on market $145,000 Active 6 DOM
-
2026-06-04days on market $145,000 Active 3 DOM
-
2026-06-03days on market $145,000 Active 2 DOM
-
2026-06-02remarks 699-char remark
-
2026-06-02$145,000 Active 1 DOM
ⓘ Source: listings_history table (triggers on properties + properties_extension) + one-shot
backfill from property_details.listing_events for pre-trigger history.
Climate risk First Street
- Flood 1/10 Low FEMA zone X (unshaded) · 0% chance over 30 yrs
- Wildfire 7/10 Severe
- Heat 7/10 Severe 6 d/yr ≥105°F today · 16 d/yr by 30 yrs out
- Wind 1/10 Low
- Air quality 5/10 Major 9 unhealthy d/yr today · 11 by 30 yrs out
Nearby sold comps map
Loading sold comps map…
Walkable amenities ~0.75 mi
Loading nearby amenities…
Taxation est. · year 1
- Rental income
- $28,395
- − Mortgage interest
- −$8,122
- − Property taxes
- −$2,175
- − Insurance
- −$725
- − Repairs & maintenance
- −$2,272
- − Management
- −$2,272
- − Depreciation
- −$4,218
- Taxable income
- $8,611
- Est. tax owed @ 24.0%
- −$2,067
- After-tax cash flow
- $8,341/yr
For passive investors: Depreciation is non-cash, so a rental often shows a tax loss while cash-flowing — sheltering income. Rental losses are passive: they offset passive income freely, and up to $25,000/yr can offset ordinary (W-2) income if you actively participate and your MAGI is under $100k (phasing out to $0 by $150k); unused losses carry forward. On sale, claimed depreciation is recaptured at up to 25%, and gains may owe capital-gains tax (a 1031 exchange can defer both). Figures are a year-1 estimate at your 24.0% rate — not tax advice; consult a CPA.
Schools (NCES district)
- District
- Menifee Union Elementary
- NCES district ID
- 0624540
- Math proficiency
- 43% ▬ 0.00%
- Reading proficiency
- 56% ▲ 3.00%
- Median HH income
- $58,228
- Composite
- 45.17/100
- National rank
- #5790
- State rank
- #434 of 1400 in CA
Livability — Menifee
- Score
- 64/100
- State rank
- #407
- US rank
- #13882
Category grades
Schools grade is shown separately in the Schools card above.
Census & demographics
- Census place
- Menifee, CA
- County
- Riverside County · 2,287,001 people
- City population
- 111,667
- Metro
- Riverside-San Bernardino-Ontario, CA
- Population (ZIP)
- 20,767
- Household income
- $57,708
- Rent vs Own
- Severe rent burden
- 1163.0
Population outlook (Riverside County) Hauer SSP2
- Today (2025)
- 2,664,475 people
- By 2030
- 2,802,692 · +5.2%
- By 2040
- 3,050,904 · +14.5%
- By 2050
- 3,256,783 · +22.2%
- By 2075
- 3,655,058 · +37.2%
- By 2100
- 3,766,594 · +41.4%
Race, ethnicity, and origin ACS 2023
- Neighborhood character
- Diverse neighborhood (Simpson 0.59)
- Race & ethnicity
- White 55% Hispanic / Latino 31% Two or more races 17% Black 6% Asian 3%
- Hispanic origin (detail)
- Mexican 25% Puerto Rican 1%
- Common ancestry
- Lithuanian 3% Italian 2% Romanian 1%
- Foreign-born
- 15% · Canada, Vietnam, China
- Languages at home
- 77% English-only · Spanish 18% Other Asian/Pacific 1% Other Indo-European 1%
Political lean MEDSL · Riverside
- 2024 margin
- Toss-up / Even · D 48.0% · R 49.3% · Other 2.6%
- 2008→2024 swing
- -3.6pp toward R · 2008: 2.3pp · 2024: -1.3pp
- All cycles
- 2024: R+1.3 2020: D+8.0 2016: D+4.3 2012: R+0.4 2008: D+2.3
Not yet ingested
- Civics
- —
Market trends
- HPI YoY
- ▼ -86.18%
- Current HPI
- 364.9577
- Rent YoY
- ▲ 6.10%
- Metro
- Riverside-San Bernardino-Ontario, CA
- State GDP YoY
- ▲ 3.21%
- F500 in state
- 116
Industry mix (Fortune 500 HQ in CA)
| Industry | F500 HQs | Revenue |
|---|---|---|
| Technology | 27 | $1,492B |
|
||
| Financial Services | 3 | $174B |
|
||
| Retail | 3 | $44B |
|
||
| Insurance | 3 | $26B |
|
||
| Media / Entertainment | 2 | $115B |
|
||
| Pharmaceuticals / Biotech | 2 | $62B |
|
||
Price history
+628.6% since first listed24 events — show timeline
- 2026-06-01 Listed $145,000 CRMLS
- 2025-12-04 Listing Removed — CRMLS
- 2025-11-25 Relisted — CRMLS
- 2025-11-19 Relisted — CRMLS
- 2025-11-13 Listed $69,000 CRMLS
- 2025-02-14 Price Changed $134,999 CRMLS
- 2025-01-28 Price Changed $139,000 CRMLS
- 2025-01-09 Price Changed $145,000 CRMLS
- 2024-11-27 Listed $149,000 CRMLS
- 2024-11-25 Coming Soon — CRMLS
- 2024-11-16 Listing Removed — CRMLS
- 2024-09-27 Price Changed $143,900 CRMLS
- 2024-07-11 Price Changed $149,999 CRMLS
- 2024-05-24 Listed $155,000 CRMLS
- 2020-08-10 Sold (MLS) $38,000 CRMLS
- 2020-08-08 Pending — CRMLS
- 2020-07-31 Contingent — CRMLS
- 2020-07-09 Price Changed $50,000 CRMLS
- 2020-06-06 Listed $55,000 CRMLS
- 2012-11-01 Sold (MLS) $14,500 CRMLS
- 2012-10-25 Pending — CRMLS
- 2012-05-29 Relisted — CRMLS
- 2012-05-22 Pending — CRMLS
- 2011-11-08 Listed $19,900 CRMLS
Property tax history
-2.6%/yrLatest (2025): $170 · +2.2% YoY. Source: county tax records.
Cash-flow waterfall
monthlySold comps — $/sqft
last 12 mo · ≤1 miLoading sold comps…