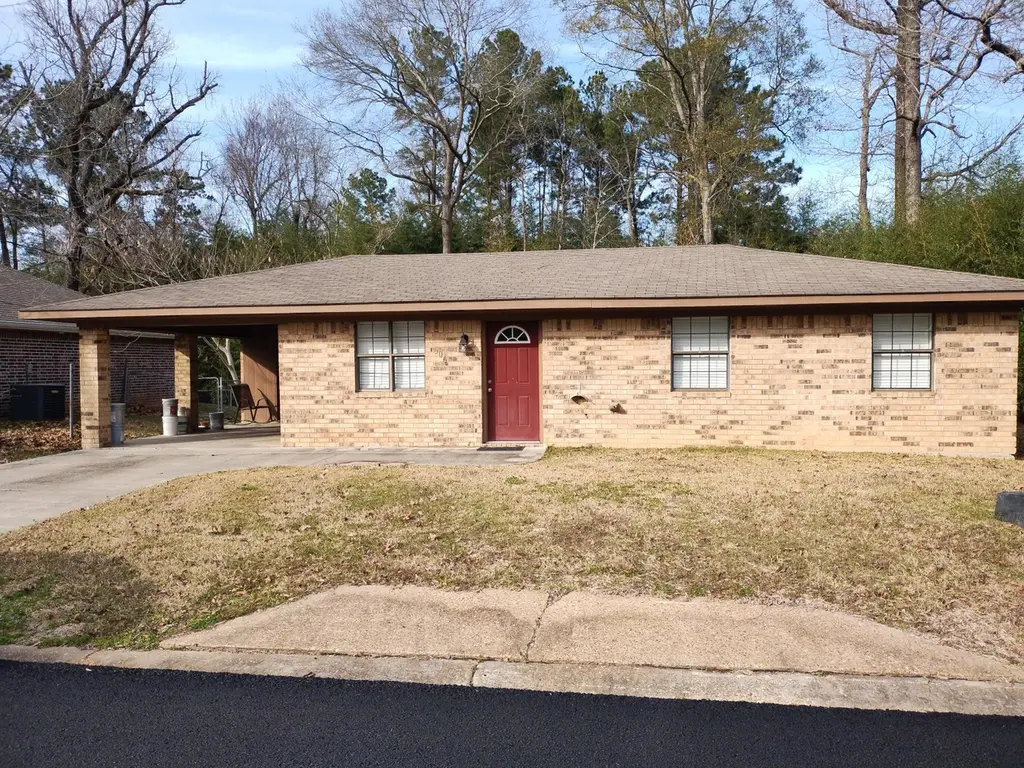
506 Mcfarland St · Leesville, LA
Flood risk 1/10 · Minimal
- FEMA flood zone
- X (unshaded)
- Chance of flooding over 30 yrs
- 0.0%
- Est. flood insurance / yr
- $507 – $1,088
Fire risk 3/10 · Minor
- Est. fire insurance / yr
- $1,269 – $2,357
Heat risk 7/10 · Major
- Hot days now (above 110°F)
- 7 days/yr
- Hot days in 30 yrs
- 20 days/yr
Wind risk 8/10 · Major
- Chance of severe wind over 30 yrs
- 97.0%
Air-quality risk 1/10 · Minimal
- Unhealthy air days now
- 0 days/yr
- Unhealthy air days in 30 yrs
- 0 days/yr
Risk factors via First Street. Map © Google.
Why this score? — see what drove the C grade
The composite is a weighted blend of 9 inputs, each scored 0–100. Each bar is that input's sub-score; the figure is the points it added to the 100-point composite (weight × sub-score).
- Cash flow +22.2/30.0
- ARV discount +8.7/15.0
- DSCR +7.1/10.0
- Rent growth +4.9/5.0
- 1% rule +4.8/10.0
- Livability +3.7/5.0
- Schools +3.6/10.0
- Condition / age +2.5/5.0
- Appreciation +0.0/10.0
$112,000
🖨 Deal sheet 📄 Offer letter ✓ Due diligence
Listing remarks MLS
A LOVELY SMALL 3 BEDROOM HOME with BIG UPGRADES to include Premium Cabinetry in Kitchen with Stainless Steel Double Door Refrigerator, SS Stove and Over-the-Counter Microwave/ Venthood; Tile Tub Surround in the Bath; Premium ''Plank'' Floor Coverings, New doors inside and out , 5 Ceiling Fans, Wide Wood Blinds. ALL on a quiet street AND at an AFFORDABLE PRICE.
Key facts
- 5 ceiling fans
- Ss stove
- 8,712 sq ft lot
Tags
Neighborhood map
What this means for you Summary
Snapshot
- This is a 3-bed/1.0-bath single-family listed at $112k.
Deal economics
- At list price, monthly cash flow is $183 ($2k/yr) — positive.
- The deal already cash-flows at list — no discount required.
- To meet the 1% rule (rent ≥ 1% of price), the offer needs to be $110k (2.1% below list).
- Recommended offer: $99k (12.0% below list) — sets the bar for market timing.
Location & tenants
- Location reads 73/100 on livability (#30 in LA) — a middle-class / working-renter tenant base. Strengths: cost of living A+, health & safety A+, housing A; Watch: crime F, amenities F, commute F.
- Vernon Parish (rural): math 35% / reading 51% proficiency, ranked #18 of 98 in LA (top 18%) — families likely to look elsewhere, expect single-tenant / working-renter base with shorter leases.
- Market conditions: Rents rising fast (+9.6%/yr); 210 active listings in the ZIP; 4 comparable units currently listed for rent nearby; rentals lingering (median 44d on market — plan ~5-8 weeks vacancy on turnover, expect pricing pressure); 100% of comp listings sitting > 30 days — soft ceiling on asking rent; 26 units permitted in Vernon Parish in 2024 (0 in 5+ unit buildings).
Forward outlook
- Local home prices are declining (-3.0%/yr); year-one equity from $774 of loan paydown is wiped out by about $3k of value loss. Plan a longer hold.
- Vernon County population projected at -25% by 2050 — secular population decline; favor cash flow + early exit over multi-decade hold.
- At projected returns (-3.0% appreciation + 8.0% rent growth), your $31k cash investment doubles in ~9 years — after that, you're playing with house money.
Negotiation context
- It's been on market 140 days — a 12% lower offer ($99k) is reasonable based on typical stale-listing flexibility.
- 2 sale attempts since 12y ago with the ask held roughly flat each time — persistent listings suggest the price (not the market) is what's stuck; bring a comps-based counter.
- Current owner paid $51k; list at $112k implies a 120% gain — meaningful room to come down on a strong offer.
Risks & watch-outs
- Climate carrying-cost: severe wind risk, 97% chance of damaging wind over 30y; extreme-heat days projected 7→20/yr by 2055 (HVAC capex compounding) — expect insurance premiums to compound above CPI over the hold.
Questions for the listing agent
- It's been on market 140 days. Have you received any prior offers? Is the seller open to a 12% concession, seller financing, or rate buy-down credit?
- Built in 1970 — when were the roof, HVAC, electrical panel, plumbing, and water heater last replaced?
- Why hasn't it sold? Are there any deal-killer items the seller is aware of (foundation, flood, title, zoning, code violations)?
- Is there a deadline driving the sale (1031 exchange, divorce, estate, relocation)? That informs how much negotiation room exists.
- Schools are B-rated — typically a magnet for longer-tenancy family renters. What's the average tenant stay here, and is there a school-zone premium baked into asking?
- Crime grade is F in this area — have there been break-ins, vandalism, or insurance claims at this property in the last 3 years? What carrier currently insures it and at what premium?
- What's the average days-on-market for RENTAL listings here right now (not sales)? A rising rental-DOM trend means longer vacancies and softer asking-rent achievability than the comps imply.
- What's the recent tenant-quality profile in this submarket — average credit score on applications, eviction rate, late-payment / NSF rate, and stable-employment percentage? A property-management company in the area should have these aggregated.
- How much new for-sale + rental construction is in the pipeline within 1–3 miles? Heavy new supply typically softens prices + rents 12–24 months out; constrained supply supports both.
Investment metrics
- 1% rule
- 0.98% ✗
- Cap rate
- 8.26%
- Cash-on-cash
- 7.01%
- DSCR
- 1.31
- GRM
- 8.5
CMA / ARV
- ARV (median comp)
- $115,071
- List price
- $112,000
- Delta
- -2.67%
- Verdict
- FAIR
- Comps
- 17 within 1.0 mi
Show comp detail 4 sales within ~0.75 mi
| Address | Dist | Beds/Ba | Sqft | Sold | Price | $/sf | Match |
|---|---|---|---|---|---|---|---|
| 1201 S 10th St | 0.11mi | 3/2.0 | 956 (+5%) | 5mo | $107,000 | $112 | 79 |
| 1101 Pinckney Ave | 0.73mi | 2/1.0 (-1) | 895 (-2%) | 21mo | $85,000 | $95 | 41 |
| 2110 Thompson St | 0.67mi | 3/1.5 | 1,028 (+13%) | 16mo | $140,000 | $136 | 32 |
| 2105 Miriam St | 0.75mi | 3/1.0 | 1,000 (+10%) | 23mo | $117,000 | $117 | 30 |
Match score weights: distance 35% · size 25% · config 20% · recency 20%. Top-matched comps best support the ARV.
Projected returns pro-forma
-3.0% appreciation · 8.0% rent growth · sell at horizon
- IRR
- -0.6%
- Equity multiple
- 0.98×
- Total profit
- $-729
- Equity at exit
- $16,700
- IRR
- 13.4%
- Equity multiple
- 2.29×
- Total profit
- $40,600
- Equity at exit
- $9,684
Cash invested: $31,360 (down + closing). Projections, not guarantees.
Landlord ↔ Tenant lean methodology
- Overall (STATE)
- 90 Strongly Landlord-Friendly
- State Louisiana
- 90 Strongly Landlord-Friendly · R+12
- County
- — inherits STATE
- City
- — inherits STATE
ZIP-level market 71446
- Home prices YoY
- -32.1%
- Rents YoY
- 9.6%
- Active inventory
- 210
- Price-to-rent
- 8.5×
Monthly cashflow live
- Estimated rent
- $1,096 medium interval (Pro) →
- Mortgage (P&I)
- −$587
- Tax from tax record
- −$49 /mo · $589/yr
- Insurance
- −$47
- HOA
- −$0
- Vacancy / Maint / Mgmt
- −$230
- Net cashflow
- $183
Break-even live
UW: 25.0% down · 7.5% · 30yr · 1.5% tax · 5.0% vac · 8.0% maint · 8.0% mgmt
Financing live
Cash to close
- Down payment
- $28,000
- Closing costs
- $3,360
- Reserves months
- —
- Total cash needed
- —
Loan-product check · same deal, 3 products live
Conventional
25% down · 7.5% · 30yr
- Down + closing
- —
- Monthly P&I
- —
- Monthly cashflow
- —
- DSCR
- —
- Eligible?
- —
Personal DTI + credit; lowest rate.
DSCR
20% down · 8.5% · 30yr
- Down + closing
- —
- Monthly P&I
- —
- Monthly cashflow
- —
- DSCR
- —
- Eligible?
- —
No personal income docs; deal must DSCR.
Hard money
10% down · 12.0% · 12mo
- Down + closing
- —
- Monthly P&I
- —
- Monthly cashflow
- —
- DSCR
- —
- Eligible?
- —
Short-term bridge; refi at stabilization.
Rent comps 4 comps
| Address | Beds | Baths | Sqft | Rent | $/sqft | DOM | Units | Dist |
|---|---|---|---|---|---|---|---|---|
| 306 W Harriet St Apt 6 Leesville, LA | 2.0 | 1.5 | 840 | $650 | $0.77 | 43d | 1 | 0.49mi |
| 305 W Maggie St Apt 3 Leesville, LA | 2.0 | 1.5 | 840 | $600 | $0.71 | 43d | 1 | 0.51mi |
| 1403 Aaron St Leesville, LA | 3.0 | 1.0 | 926 | $1,050 | $1.13 | 43d | 1 | 0.82mi |
| 10 Katherine Loop Leesville, LA | 3.0 | 2.0 | 1106 | $1,100 | $0.99 | 43d | 1 | 1.50mi |
Listing history 20 events
-
2026-06-19days on market $112,000 Active 140 DOM
-
2026-06-18days on market $112,000 Active 139 DOM
-
2026-06-17days on market $112,000 Active 138 DOM
-
2026-06-16days on market $112,000 Active 137 DOM
-
2026-06-15days on market $112,000 Active 136 DOM
-
2026-06-14days on market $112,000 Active 134 DOM
-
2026-06-12days on market $112,000 Active 133 DOM
-
2026-06-09days on market $112,000 Active 130 DOM
-
2026-06-08days on market $112,000 Active 129 DOM
-
2026-06-07days on market $112,000 Active 128 DOM
-
2026-06-07days on market $112,000 Active 127 DOM
-
2026-06-04days on market $112,000 Active 124 DOM
-
2026-06-02days on market $112,000 Active 123 DOM
-
2026-06-01days on market $112,000 Active 122 DOM
-
2026-05-31days on market $112,000 Active 121 DOM
-
2026-05-31days on market $112,000 Active 120 DOM
-
2026-01-30$112,000 Active 362-char remark
Show marketing remark (362 chars)
A LOVELY SMALL 3 BEDROOM HOME with BIG UPGRADES to include Premium Cabinetry in Kitchen with Stainless Steel Double Door Refrigerator, SS Stove and Over-the-Counter Microwave/ Venthood; Tile Tub Surround in the Bath; Premium ''Plank'' Floor Coverings, New doors inside and out , 5 Ceiling Fans, Wide Wood Blinds. ALL on a quiet street AND at an AFFORDABLE PRICE.
-
2015-01-07soldstatus 397-char remark
Show marketing remark (397 chars)
Looking for an INVESTMENT PROPERTY? How about a starter home, or maybe downsizing? This is the PERFECT home for you! 3BR/1BA located in the heart of town, close to area schools and shopping. Hard wood laminate flooring in living room, hallway, and bedrooms. Ceiling fans throughout. Appliances remain. Plenty of trees offer shady front and back yard. Bamboo screening in back yard. Single carport.
-
2015-01-07soldstatus $51,000
Show marketing remark (397 chars)
Looking for an INVESTMENT PROPERTY? How about a starter home, or maybe downsizing? This is the PERFECT home for you! 3BR/1BA located in the heart of town, close to area schools and shopping. Hard wood laminate flooring in living room, hallway, and bedrooms. Ceiling fans throughout. Appliances remain. Plenty of trees offer shady front and back yard. Bamboo screening in back yard. Single carport.
-
2014-11-12$57,500 397-char remark
Show marketing remark (397 chars)
Looking for an INVESTMENT PROPERTY? How about a starter home, or maybe downsizing? This is the PERFECT home for you! 3BR/1BA located in the heart of town, close to area schools and shopping. Hard wood laminate flooring in living room, hallway, and bedrooms. Ceiling fans throughout. Appliances remain. Plenty of trees offer shady front and back yard. Bamboo screening in back yard. Single carport.
ⓘ Source: listings_history table (triggers on properties + properties_extension) + one-shot
backfill from property_details.listing_events for pre-trigger history.
Tax reassessment forecast LA · Resets to sale price
- Current annual tax
- $589 · $49/mo
- Projected year-2 tax
- $616 · $51/mo
- Expected delta
- +$27/yr (+$2/mo · 4.7%)
ⓘ Screening estimate from a state-policy table — verify with the county assessor before closing.
Climate risk First Street
- Flood 1/10 Low FEMA zone X (unshaded) · 0% chance over 30 yrs
- Wildfire 3/10 Moderate
- Heat 7/10 Severe 7 d/yr ≥110°F today · 20 d/yr by 30 yrs out
- Wind 8/10 Severe 97% chance of damaging wind over 30 yrs
- Air quality 1/10 Low 0 unhealthy d/yr today · 0 by 30 yrs out
Nearby sold comps map
Loading sold comps map…
Walkable amenities ~0.75 mi
Loading nearby amenities…
Taxation est. · year 1
- Rental income
- $13,158
- − Mortgage interest
- −$6,274
- − Property taxes
- −$589
- − Insurance
- −$560
- − Repairs & maintenance
- −$1,053
- − Management
- −$1,053
- − Depreciation
- −$3,258
- Taxable income
- $372
- Est. tax owed @ 24.0%
- −$89
- After-tax cash flow
- $2,109/yr
For passive investors: Depreciation is non-cash, so a rental often shows a tax loss while cash-flowing — sheltering income. Rental losses are passive: they offset passive income freely, and up to $25,000/yr can offset ordinary (W-2) income if you actively participate and your MAGI is under $100k (phasing out to $0 by $150k); unused losses carry forward. On sale, claimed depreciation is recaptured at up to 25%, and gains may owe capital-gains tax (a 1031 exchange can defer both). Figures are a year-1 estimate at your 24.0% rate — not tax advice; consult a CPA.
Schools (NCES district)
- District
- Vernon Parish
- NCES district ID
- 2201830
- Math proficiency
- 35% ▼ -42.00%
- Reading proficiency
- 51% ▼ -32.00%
- Median HH income
- $44,822
- Composite
- 36.42/100
- National rank
- #4674
- State rank
- #18 of 98 in LA
Livability — Leesville
- Score
- 73/100
- State rank
- #30
- US rank
- #5046
Category grades
Schools grade is shown separately in the Schools card above.
Census & demographics
- Census place
- Leesville, LA
- County
- Vernon Parish · 21,275 people
- City population
- 21,275
- Metro
- Fort Polk South, LA
- Population (ZIP)
- 21,275
- Household income
- $55,925
- Rent vs Own
- Severe rent burden
- 659.0
Population outlook (Vernon County) Hauer SSP2
- Today (2025)
- 45,401 people
- By 2030
- 43,015 · -5.3%
- By 2040
- 38,171 · -15.9%
- By 2050
- 34,087 · -24.9%
- By 2075
- 28,267 · -37.7%
- By 2100
- 25,486 · -43.9%
Race, ethnicity, and origin ACS 2023
- Neighborhood character
- Predominantly White (72%)
- Race & ethnicity
- White 72% Black 16% Hispanic / Latino 6% Two or more races 5% Asian 2% Native American 1%
- Hispanic origin (detail)
- Mexican 3% Puerto Rican 1%
- Common ancestry
- Lithuanian 3% Slovak 1% Romanian 1%
- Foreign-born
- 3% · Canada, South Korea, Vietnam
- Languages at home
- 94% English-only · Spanish 3% French/Haitian/Cajun 1%
Political lean MEDSL · Vernon
- 2024 margin
- Solid R (+67.9) · D 15.6% · R 83.4% · Other 1.0%
- 2008→2024 swing
- -14.5pp toward R · 2008: -53.4pp · 2024: -67.9pp
- All cycles
- 2024: R+67.9 2020: R+64.9 2016: R+65.0 2012: R+57.5 2008: R+53.4
Not yet ingested
- Civics
- —
Market trends
- HPI YoY
- ▼ -61.06%
- Current HPI
- 128.8849
- Rent YoY
- ▲ 9.60%
- Metro
- Fort Polk South, LA
- State GDP YoY
- ▲ 3.29%
- F500 in state
- 10
Industry mix (Fortune 500 HQ in LA)
| Industry | F500 HQs | Revenue |
|---|---|---|
| Telecommunications | 2 | $23B |
|
||
| Utilities | 1 | $12B |
|
||
| Wholesale / Distribution | 1 | $5B |
|
||
| Advertising | 1 | $2B |
|
||
Price history
+94.8% since first listed4 events — show timeline
- 2026-01-30 Listed $112,000 GFPAR
- 2015-01-07 Sold (Public Records) $51,000 Public Records
- 2015-01-07 Sold (MLS) — GFPAR
- 2014-11-12 Listed $57,500 GFPAR
Property tax history
-0.6%/yrLatest (2025): $589 · -0.8% YoY. Source: county tax records.
Cash-flow waterfall
monthlySold comps — $/sqft
last 12 mo · ≤1 miLoading sold comps…