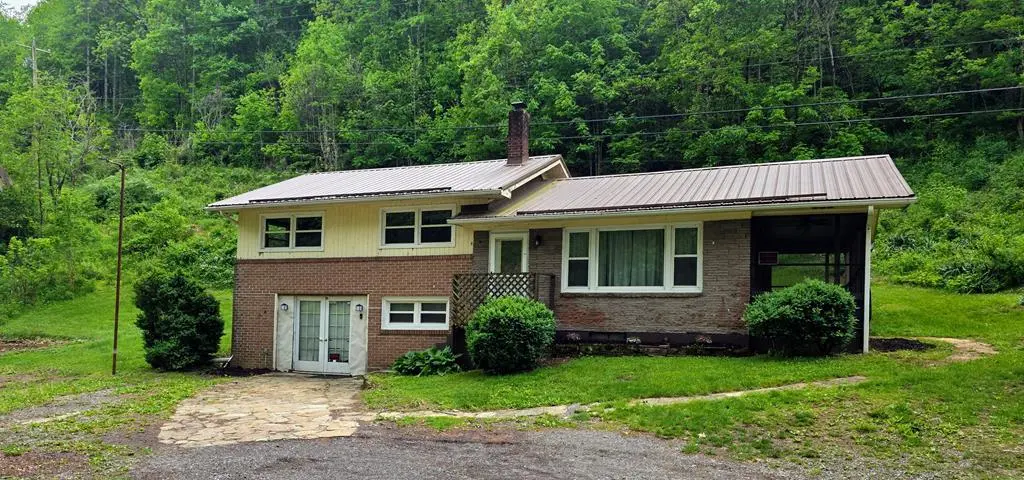
14442 Porterfield Hwy · Abingdon, VA
Flood risk 10/10 · Severe
- FEMA flood zone
- X (unshaded)
- Chance of flooding over 30 yrs
- 0.99%
- Est. flood insurance / yr
- $473 – $860
Fire risk 6/10 · Moderate
- Est. fire insurance / yr
- $666 – $1,236
Heat risk 3/10 · Minor
- Hot days now (above 95°F)
- 7 days/yr
- Hot days in 30 yrs
- 20 days/yr
Wind risk 2/10 · Minimal
- Chance of severe wind over 30 yrs
- —
Air-quality risk 2/10 · Minimal
- Unhealthy air days now
- 0 days/yr
- Unhealthy air days in 30 yrs
- 1 days/yr
Risk factors via First Street. Map © Google.
Why this score? — see what drove the C- grade
The composite is a weighted blend of 9 inputs, each scored 0–100. Each bar is that input's sub-score; the figure is the points it added to the 100-point composite (weight × sub-score).
- Cash flow +19.9/30.0
- ARV discount +6.7/15.0
- DSCR +6.3/10.0
- Schools +6.2/10.0
- 1% rule +4.0/10.0
- Livability +4.0/5.0
- Rent growth +2.5/5.0
- Condition / age +2.5/5.0
- Appreciation +0.0/10.0
$180,000
🖨 Deal sheet 📄 Offer letter ✓ Due diligence
Listing remarks
Welcome to this tri-level home featuring 3 bed, 1 bath and 1,078 finished square feet with additional basement space not included in the square footage. Part of the basement has been encapsulated for added functionality & storage. Major upgrades completed in 2017 include a beautifully remodeled kitchen with granite countertops & new appliances including refrigerator, range, dishwasher & microwave. Additional updates include new windows, roof, water heater, water pump & a whole-house self-cleaning water filtration system. Original hardwood floors add charm & character throughout the home. Enjoy relaxing on the screened-in porch overlooking the peaceful setting.
Key facts
- Remodeled kitchen
- New appliances
- Granite countertops
Tags
Property features AI
Exterior
- Utilities: Spring water source; Septic tank; Propane service
- Home design: Single-family residence; One and one-half level design; 3 total stories; Zoning: A2
- Construction: Brick and wood siding construction
- Exterior features: Metal roof; Shed(s) on the property; Level lot
Interior
- Flooring: Laminate flooring; Wood flooring
- Bathrooms: 1 full bathroom
- Heating & cooling: Heat pump heating; Central air conditioning; Ceiling fans
- Interior features: Gas log fireplace; Unfinished basement
Neighborhood map
What this means for you Summary
Snapshot
- This is a 3-bed/1.0-bath single-family listed at $180k.
Deal economics
- At list price, monthly cash flow is $163 ($2k/yr) — positive.
- The deal already cash-flows at list — no discount required.
- To meet the 1% rule (rent ≥ 1% of price), the offer needs to be $162k (9.9% below list).
- Recommended offer: $162k (9.9% below list) — sets the bar for 1% rule.
- Cap rate 7.7% vs local median 3.1% in Abingdon — top-decile yield for the area; either an underpriced asset or a hidden risk that comps aren't pricing in. Stress-test before assuming the spread holds.
Location & tenants
- Location reads 80/100 on livability (#59 in VA, #1,691 nationally) — a professional / high-income tenant draw. Strengths: cost of living A+, health & safety A+, housing A; Watch: employment D, commute F.
- Washington County Public School District (rural): math 68% / reading 79% proficiency, ranked #15 of 131 in VA (top 12%) — strong family-tenant draw, lease renewals of 3-5y typical.
- Zoned schools: Abingdon Elementary (math 66% / reading 77%, grade A-, #299 of 1,108 statewide, top 27%, 423 students, 70% FRL); E.B. Stanley Middle (math 68% / reading 82%, grade A, #49 of 342 statewide, top 14%, 643 students, 66% FRL); Abingdon High (math 77% / reading 87%, grade A, #40 of 319 statewide, top 15%, 867 students, 65% FRL) — zoned schools average 67% FRL vs 42% district-wide (25 pts higher); higher-poverty schools than district average — tighter screening recommended.
- Market conditions: 161 active listings in the ZIP; 99 units permitted in Washington County in 2024 (0 in 5+ unit buildings).
- This rent runs 31% of the median local income ($63k/yr) — at the standard rent-burdened threshold; future hikes will face affordability resistance.
Forward outlook
- Local home prices are declining (-3.0%/yr); year-one equity from $1k of loan paydown is wiped out by about $5k of value loss. Plan a longer hold.
- Washington County population projected at -14% by 2050 — secular population decline; favor cash flow + early exit over multi-decade hold.
Negotiation context
- It's been on market 40 days — a 3% lower offer ($175k) is reasonable based on typical stale-listing flexibility.
Risks & watch-outs
- Watch-outs: flood insurance adds $56/mo.
- Climate carrying-cost: severe flood risk; major wildfire risk — expect insurance premiums to compound above CPI over the hold.
Questions for the listing agent
- It's been on market 40 days. Have you received any prior offers? Is the seller open to a 10% concession, seller financing, or rate buy-down credit?
- Built in 1960 — when were the roof, HVAC, electrical panel, plumbing, and water heater last replaced?
- What's the actual annual flood-insurance premium (NFIP or private), and is the property in a SFHA with mandatory coverage?
- Is there a deadline driving the sale (1031 exchange, divorce, estate, relocation)? That informs how much negotiation room exists.
- Schools are A-rated — typically a magnet for longer-tenancy family renters. What's the average tenant stay here, and is there a school-zone premium baked into asking?
- What's the average days-on-market for RENTAL listings here right now (not sales)? A rising rental-DOM trend means longer vacancies and softer asking-rent achievability than the comps imply.
- What's the recent tenant-quality profile in this submarket — average credit score on applications, eviction rate, late-payment / NSF rate, and stable-employment percentage? A property-management company in the area should have these aggregated.
- How much new for-sale + rental construction is in the pipeline within 1–3 miles? Heavy new supply typically softens prices + rents 12–24 months out; constrained supply supports both.
Investment metrics
- 1% rule
- 0.90% ✗
- Cap rate
- 7.75%
- Cash-on-cash
- 5.20%
- DSCR
- 1.23
- GRM
- 9.2
CMA / ARV
- ARV (median comp)
- $177,021
- List price
- $180,000
- Delta
- 1.68%
- Verdict
- FAIR
- Comps
- 3 within 1.0 mi
Projected returns pro-forma
-3.0% appreciation · 3.0% rent growth · sell at horizon
- IRR
- -10.3%
- Equity multiple
- 0.63×
- Total profit
- $-18,842
- Equity at exit
- $26,839
- IRR
- -0.9%
- Equity multiple
- 0.94×
- Total profit
- $-3,257
- Equity at exit
- $15,563
Cash invested: $50,400 (down + closing). Projections, not guarantees.
Landlord ↔ Tenant lean methodology
- Overall (STATE)
- 55 Moderately Landlord-Leaning
- State Virginia
- 55 Moderately Landlord-Leaning · D+2
- County
- — inherits STATE
- City
- — inherits STATE
ZIP-level market 24210
- Home prices YoY
- -29.9%
- Active inventory
- 161
- Price-to-rent
- 9.2×
Monthly cashflow live
- Estimated rent
- $1,622 medium interval (Pro) →
- Mortgage (P&I)
- −$944
- Tax from tax record
- −$44 /mo · $525/yr
- Insurance
- −$75
- Flood insurance flood zone
- −$56 /mo · $666/yr
- HOA
- −$0
- Vacancy / Maint / Mgmt
- −$341
- Net cashflow
- $163
Break-even live
UW: 25.0% down · 7.5% · 30yr · 1.5% tax · 5.0% vac · 8.0% maint · 8.0% mgmt
Financing live
Cash to close
- Down payment
- $45,000
- Closing costs
- $5,400
- Reserves months
- —
- Total cash needed
- —
Loan-product check · same deal, 3 products live
Conventional
25% down · 7.5% · 30yr
- Down + closing
- —
- Monthly P&I
- —
- Monthly cashflow
- —
- DSCR
- —
- Eligible?
- —
Personal DTI + credit; lowest rate.
DSCR
20% down · 8.5% · 30yr
- Down + closing
- —
- Monthly P&I
- —
- Monthly cashflow
- —
- DSCR
- —
- Eligible?
- —
No personal income docs; deal must DSCR.
Hard money
10% down · 12.0% · 12mo
- Down + closing
- —
- Monthly P&I
- —
- Monthly cashflow
- —
- DSCR
- —
- Eligible?
- —
Short-term bridge; refi at stabilization.
Listing history 16 events
-
2026-06-19days on market $180,000 Active 40 DOM
-
2026-06-18days on market $180,000 Active 39 DOM
-
2026-06-17days on market $180,000 Active 38 DOM
-
2026-06-16days on market $180,000 Active 37 DOM
-
2026-06-15days on market $180,000 Active 36 DOM
-
2026-06-14days on market $180,000 Active 34 DOM
-
2026-06-13days on market $180,000 Active 33 DOM
-
2026-06-10days on market $180,000 Active 31 DOM
-
2026-06-09days on market $180,000 Active 30 DOM
-
2026-06-08days on market $180,000 Active 29 DOM
-
2026-06-07days on market $180,000 Active 28 DOM
-
2026-06-02days on market $180,000 Active 23 DOM
-
2026-06-01days on market $180,000 Active 22 DOM
-
2026-05-31days on market $180,000 Active 21 DOM
-
2026-05-30days on market $180,000 Active 20 DOM
-
2026-05-10$180,000 Active 1099-char remark
ⓘ Source: listings_history table (triggers on properties + properties_extension) + one-shot
backfill from property_details.listing_events for pre-trigger history.
Tax reassessment forecast VA · Resets to sale price
- Current annual tax
- $525 · $44/mo
- Projected year-2 tax
- $1,476 · $123/mo
- Expected delta
- +$951/yr (+$79/mo · 181.1%)
ⓘ Screening estimate from a state-policy table — verify with the county assessor before closing.
Climate risk First Street
- Flood 10/10 Extreme FEMA zone X (unshaded) · 99% chance over 30 yrs
- Wildfire 6/10 Major
- Heat 3/10 Moderate 7 d/yr ≥95°F today · 20 d/yr by 30 yrs out
- Wind 2/10 Low
- Air quality 2/10 Low 0 unhealthy d/yr today · 1 by 30 yrs out
Nearby sold comps map
Loading sold comps map…
Walkable amenities ~0.75 mi
Loading nearby amenities…
Taxation est. · year 1
- Rental income
- $19,461
- − Mortgage interest
- −$10,083
- − Property taxes
- −$525
- − Insurance
- −$1,566
- − Repairs & maintenance
- −$1,557
- − Management
- −$1,557
- − Depreciation
- −$5,236
- Taxable loss
- −$1,063
- Est. tax savings @ 24.0%
- +$255
- After-tax cash flow
- $2,211/yr
For passive investors: Depreciation is non-cash, so a rental often shows a tax loss while cash-flowing — sheltering income. Rental losses are passive: they offset passive income freely, and up to $25,000/yr can offset ordinary (W-2) income if you actively participate and your MAGI is under $100k (phasing out to $0 by $150k); unused losses carry forward. On sale, claimed depreciation is recaptured at up to 25%, and gains may owe capital-gains tax (a 1031 exchange can defer both). Figures are a year-1 estimate at your 24.0% rate — not tax advice; consult a CPA.
Schools (NCES district)
- District
- Washington County Public School District
- NCES district ID
- 5103900
- Math proficiency
- 68% ▼ -23.00%
- Reading proficiency
- 79% ▼ -7.00%
- Median HH income
- $42,412
- Composite
- 61.5/100
- National rank
- #754
- State rank
- #15 of 131 in VA
Livability — Abingdon
- Score
- 80/100
- State rank
- #59
- US rank
- #1691
Category grades
Schools grade is shown separately in the Schools card above.
Census & demographics
- County
- Washington County · 16,814 people
- City population
- 16,814
- Metro
- Kingsport-Bristol, TN-VA
- Population (ZIP)
- 16,814
- Household income
- $62,734
- Rent vs Own
- Severe rent burden
- 341.0
Population outlook (Washington County) Hauer SSP2
- Today (2025)
- 53,266 people
- By 2030
- 52,284 · -1.8%
- By 2040
- 49,415 · -7.2%
- By 2050
- 45,683 · -14.2%
- By 2075
- 37,258 · -30.1%
- By 2100
- 27,983 · -47.5%
Race, ethnicity, and origin ACS 2023
- Neighborhood character
- Predominantly White (92%)
- Race & ethnicity
- White 92% Black 3% Two or more races 3% Hispanic / Latino 3%
- Common ancestry
- Slovak 2% Italian 2% Serbian 2%
- Foreign-born
- 3% · Canada
- Languages at home
- 95% English-only · Spanish 3% Arabic 1%
Political lean MEDSL · Washington
- 2024 margin
- Solid R (+53.3) · D 23.0% · R 76.3%
- 2008→2024 swing
- -20.6pp toward R · 2008: -32.7pp · 2024: -53.3pp
- All cycles
- 2024: R+53.3 2020: R+52.5 2016: R+53.5 2012: R+43.2 2008: R+32.7
Not yet ingested
- Civics
- —
Market trends
- HPI YoY
- ▼ -78.33%
- Current HPI
- 183.4586
- Rent YoY
- —
- Metro
- Kingsport-Bristol, TN-VA
- State GDP YoY
- ▲ 2.40%
- F500 in state
- 50
Industry mix (Fortune 500 HQ in VA)
| Industry | F500 HQs | Revenue |
|---|---|---|
| Aerospace / Defense | 4 | $236B |
|
||
| Technology / Defense | 3 | $32B |
|
||
| Financial Services | 2 | $176B |
|
||
| Utilities | 2 | $27B |
|
||
| Insurance | 2 | $25B |
|
||
| Technology | 2 | $15B |
|
||
Price history
1 event — show timeline
- 2026-05-10 Listed $180,000 SWVAR
Property tax history
+1.9%/yrLatest (2025): $525 · +23.6% YoY. Source: county tax records.
Cash-flow waterfall
monthlySold comps — $/sqft
last 12 mo · ≤1 miLoading sold comps…