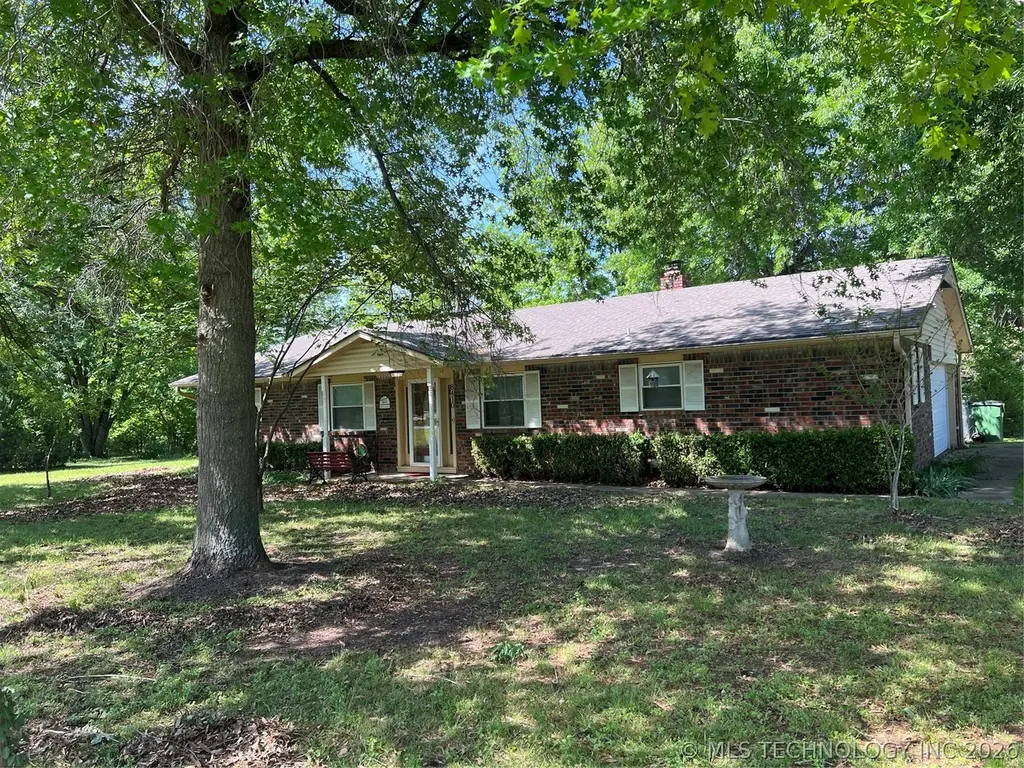
8410 S 49th West Ave · Sapulpa, OK
Flood risk 1/10 · Minimal
- FEMA flood zone
- X (unshaded)
- Chance of flooding over 30 yrs
- 0.0%
- Est. flood insurance / yr
- $507 – $1,088
Fire risk 6/10 · Moderate
- Est. fire insurance / yr
- $2,463 – $4,575
Heat risk 6/10 · Moderate
- Hot days now (above 112°F)
- 7 days/yr
- Hot days in 30 yrs
- 18 days/yr
Wind risk 2/10 · Minimal
- Chance of severe wind over 30 yrs
- 4.0%
Air-quality risk 2/10 · Minimal
- Unhealthy air days now
- 1 days/yr
- Unhealthy air days in 30 yrs
- 1 days/yr
Risk factors via First Street. Map © Google.
Why this score? — see what drove the B grade
The composite is a weighted blend of 9 inputs, each scored 0–100. Each bar is that input's sub-score; the figure is the points it added to the 100-point composite (weight × sub-score).
- Cash flow +26.2/30.0
- ARV discount +15.0/15.0
- DSCR +8.9/10.0
- Appreciation +7.7/10.0
- 1% rule +6.3/10.0
- Livability +3.4/5.0
- Rent growth +2.5/5.0
- Condition / age +2.5/5.0
- Schools +2.0/10.0
$199,900
🖨 Deal sheet (PDF) 📄 Offer letter ✓ Due diligence
Listing remarks MLS
Minutes to Tulsa Hills Mall. Corner lot, fenced, pond, 1 acre m/l, 3 bedrooms, 2 baths, 2 car garage. Newer carpet, paint, appliances & countertop. Seller offering 13 month HWA Home Warranty.
Key facts
- Pond
- Spacious workshop
- 1 acre
Tags
Property features AI
Finance
- HOA & community: Community features include gutters and sidewalks
Exterior
- Parking: Attached garage; Garage faces side; 2 garage spaces
- Security: Smoke detector(s); No safety shelter
- Utilities: Electricity available; Natural gas available; Septic tank; Rural water
- Home design: Single-story home; Faces east; Slab foundation
- Construction: Brick and wood frame construction; Asphalt fiberglass roof; Built per public records
- Exterior features: Concrete driveway; Landscaped yard; Rain gutters; Covered patio and porch; Porch; Workshop; Chain link fencing; Corner lot with mature trees, pond on lot, wooded
Interior
- Kitchen: Country-style kitchen; Dishwasher; Microwave; Oven; Range; Plumbed for ice maker
- Bedrooms: Master bedroom with private bath and walk-in closet (First floor); Bedroom with walk-in closet (First floor); Bedroom without bath with walk-in closet (First floor); Additional bedroom (First floor)
- Flooring: Carpet; Tile
- Bathrooms: Two full bathrooms; Hall bathroom with bathtub (First floor); Master bathroom with bathtub (First floor)
- Heating & cooling: Central heating (gas); Central air conditioning
- Interior features: Vinyl insulated windows; Insulated doors with storm door(s); Accessible doors; Laminate counters; Ceiling fan(s); Electric oven and range connections
- Laundry & utility: Utility room inside (First floor); Washer hookup; Electric dryer hookup; Gas water heater
Neighborhood map
What this means for you Summary
Snapshot
- This is a 3-bed/2.0-bath single-family listed at $200k.
Deal economics
- At list price, monthly cash flow is $511 ($6k/yr) — positive.
- The deal already cash-flows at list — no discount required.
- Meets the 1% rule at list price ($2k rent vs $200k).
- Cap rate 9.4% vs local median 2.8% in Sapulpa — top-decile yield for the area; either an underpriced asset or a hidden risk that comps aren't pricing in. Stress-test before assuming the spread holds.
Location & tenants
- Location reads 67/100 on livability (#88 in OK) — a middle-class / working-renter tenant base. Strengths: cost of living A+, housing A+, crime B+; Watch: schools F, amenities F, commute F.
- Sapulpa (suburban): math 23% / reading 24% proficiency, ranked #129 of 270 in OK (top 48%) — low school quality limits family demand, transient renter base, plan for 1-2y turnover.
- Market conditions: 23 active listings in the ZIP; 1 comparable units currently listed for rent nearby; 193 units permitted in Creek County in 2024 (76 in 5+ unit buildings).
Forward outlook
- In year one you build about $12k of equity ($1k loan paydown + $11k appreciation (5.5% local appreciation)).
- At projected returns (5.5% appreciation + 3.0% rent growth), your $56k cash investment doubles in ~3 years — after that, you're playing with house money.
- By year 3, paydown + projected appreciation supports a ~$31k cash-out refi (75% LTV) — recoverable capital for the next deal without selling this one.
Negotiation context
- Only 7 days on market — expect competitive offers; lowballing is unlikely to land.
- 3 sale attempts since 29y ago with the ask held roughly flat each time — persistent listings suggest the price (not the market) is what's stuck; bring a comps-based counter.
- Current owner paid $134k; 49% above their basis — modest negotiation headroom, anchor on the comps not their cost.
Risks & watch-outs
- Climate carrying-cost: major wildfire risk; extreme-heat days projected 7→18/yr by 2055 (HVAC capex compounding) — expect insurance premiums to compound above CPI over the hold.
Questions for the listing agent
- Is there a deadline driving the sale (1031 exchange, divorce, estate, relocation)? That informs how much negotiation room exists.
- Schools are F-rated, which usually means shorter tenancies and higher turnover. Who's the typical renter profile here, and what's been the actual vacancy rate?
- What's the average days-on-market for RENTAL listings here right now (not sales)? A rising rental-DOM trend means longer vacancies and softer asking-rent achievability than the comps imply.
- What's the recent tenant-quality profile in this submarket — average credit score on applications, eviction rate, late-payment / NSF rate, and stable-employment percentage? A property-management company in the area should have these aggregated.
- How much new for-sale + rental construction is in the pipeline within 1–3 miles? Heavy new supply typically softens prices + rents 12–24 months out; constrained supply supports both.
Investment metrics
- 1% rule
- 1.13% ✓
- Cap rate
- 9.36%
- Cash-on-cash
- 10.96%
- DSCR
- 1.49
- GRM
- 7.4
CMA / ARV
- ARV (on-the-fly)
- $265,490
- Comps found
- 2
Show comp detail 2 sales within ~0.75 mi
| Address | Dist | Beds/Ba | Sqft | Sold | Price | $/sf | Match |
|---|---|---|---|---|---|---|---|
| 8410 S 49th West Ave | 0.00mi | 3/2.0 | 1,390 (0%) | 0mo | $200,000 | $144 | 100 |
| 5418 W 85th St S | 0.33mi | 3/2.0 | 1,490 (+7%) | 20mo | $285,000 | $191 | 55 |
Match score weights: distance 35% · size 25% · config 20% · recency 20%. Top-matched comps best support the ARV.
Projected returns pro-forma
5.49% appreciation · 3.0% rent growth · sell at horizon
- IRR
- 23.3%
- Equity multiple
- 2.50×
- Total profit
- $84,181
- Equity at exit
- $119,237
- IRR
- 22.4%
- Equity multiple
- 5.00×
- Total profit
- $223,847
- Equity at exit
- $210,888
Cash invested: $55,972 (down + closing). Projections, not guarantees.
Landlord ↔ Tenant lean methodology
- Overall (STATE)
- 83 Strongly Landlord-Friendly
- State Oklahoma
- 83 Strongly Landlord-Friendly · R+20
- County
- — inherits STATE
- City
- — inherits STATE
ZIP-level market 74131
- Home prices YoY
- 2.4%
- Active inventory
- 23
- Price-to-rent
- 7.4×
Monthly cashflow live
- Estimated rent
- $2,250 medium interval (Pro) →
- Mortgage (P&I)
- −$1,048
- Tax from tax record
- −$135 /mo · $1,619/yr
- Insurance
- −$83
- HOA
- −$0
- Vacancy / Maint / Mgmt
- −$472
- Net cashflow
- $511
Break-even live
Sensitivity live
| Price | -10% $624 | -5% $568 | +0% $511 | +5% $454 | +10% $398 |
|---|---|---|---|---|---|
| Rent | -10% $333 | -5% $422 | +0% $511 | +5% $600 | +10% $689 |
| Rate | -1.0pp $612 | -0.5pp $562 | base $511 | +0.5pp $459 | +1.0pp $406 |
UW: 25.0% down · 7.5% · 30yr · 1.5% tax · 5.0% vac · 8.0% maint · 8.0% mgmt
Financing live
Cash to close
- Down payment
- $49,975
- Closing costs
- $5,997
- Reserves months
- —
- Total cash needed
- —
Loan-product check · same deal, 3 products live
Conventional
25% down · 7.5% · 30yr
- Down + closing
- —
- Monthly P&I
- —
- Monthly cashflow
- —
- DSCR
- —
- Eligible?
- —
Personal DTI + credit; lowest rate.
DSCR
20% down · 8.5% · 30yr
- Down + closing
- —
- Monthly P&I
- —
- Monthly cashflow
- —
- DSCR
- —
- Eligible?
- —
No personal income docs; deal must DSCR.
Hard money
10% down · 12.0% · 12mo
- Down + closing
- —
- Monthly P&I
- —
- Monthly cashflow
- —
- DSCR
- —
- Eligible?
- —
Short-term bridge; refi at stabilization.
Rent comps 1 comps
| Address | Beds | Baths | Sqft | Rent | $/sqft | DOM | Units | Dist |
|---|---|---|---|---|---|---|---|---|
| 3401 Redbud Ln Tulsa, OK | 3.0 | 2.5 | 1708 | $2,250 | $1.32 | 2d | 5 | 1.00mi |
Listing history 9 events
-
2026-04-29status Pending
-
2026-04-22$199,900 Active
-
2009-11-06soldstatus $134,000
-
2009-10-27soldstatus $134,000 197-char remark
Show marketing remark (197 chars)
Minutes to Tulsa Hills Mall. Corner lot, fenced, pond, 1 acre m/l, 3 bedrooms, 2 baths, 2 car garage. Newer carpet, paint, appliances & countertop. Seller offering 13 month HWA Home Warranty.
-
2009-10-01historical 197-char remark
Show marketing remark (197 chars)
Minutes to Tulsa Hills Mall. Corner lot, fenced, pond, 1 acre m/l, 3 bedrooms, 2 baths, 2 car garage. Newer carpet, paint, appliances & countertop. Seller offering 13 month HWA Home Warranty.
-
2009-09-15$135,000 197-char remark
Show marketing remark (197 chars)
Minutes to Tulsa Hills Mall. Corner lot, fenced, pond, 1 acre m/l, 3 bedrooms, 2 baths, 2 car garage. Newer carpet, paint, appliances & countertop. Seller offering 13 month HWA Home Warranty.
-
1997-09-11historical
-
1997-09-02soldstatus $97,500
-
1997-03-25$97,500
ⓘ Source: listings_history table (triggers on properties + properties_extension) + one-shot
backfill from property_details.listing_events for pre-trigger history.
Tax reassessment forecast OK · Resets to sale price
- Current annual tax
- $1,619 · $135/mo
- Projected year-2 tax
- $1,799 · $150/mo
- Expected delta
- +$180/yr (+$15/mo · 11.1%)
ⓘ Screening estimate from a state-policy table — verify with the county assessor before closing.
Climate risk First Street
- Flood 1/10 Low FEMA zone X (unshaded) · 0% chance over 30 yrs
- Wildfire 6/10 Major
- Heat 6/10 Major 7 d/yr ≥112°F today · 18 d/yr by 30 yrs out
- Wind 2/10 Low 4% chance of damaging wind over 30 yrs
- Air quality 2/10 Low 1 unhealthy d/yr today · 1 by 30 yrs out
Nearby sold comps map
Loading sold comps map…
Walkable amenities ~0.75 mi
Loading nearby amenities…
Taxation est. · year 1
- Rental income
- $27,000
- − Mortgage interest
- −$11,198
- − Property taxes
- −$1,619
- − Insurance
- −$1,000
- − Repairs & maintenance
- −$2,160
- − Management
- −$2,160
- − Depreciation
- −$5,815
- Taxable income
- $3,049
- Est. tax owed @ 24.0%
- −$732
- After-tax cash flow
- $5,400/yr
For passive investors: Depreciation is non-cash, so a rental often shows a tax loss while cash-flowing — sheltering income. Rental losses are passive: they offset passive income freely, and up to $25,000/yr can offset ordinary (W-2) income if you actively participate and your MAGI is under $100k (phasing out to $0 by $150k); unused losses carry forward. On sale, claimed depreciation is recaptured at up to 25%, and gains may owe capital-gains tax (a 1031 exchange can defer both). Figures are a year-1 estimate at your 24.0% rate — not tax advice; consult a CPA.
Schools (NCES district)
- District
- Sapulpa
- NCES district ID
- 4026910
- Math proficiency
- 23% ▼ -12.00%
- Reading proficiency
- 24% ▼ -12.00%
- Median HH income
- $44,536
- Composite
- 20.29/100
- National rank
- #8616
- State rank
- #129 of 270 in OK
Livability — Sapulpa
- Score
- 67/100
- State rank
- #88
- US rank
- #10676
Category grades
Schools grade is shown separately in the Schools card above.
Census & demographics
- City population
- 32,292
- Population (ZIP)
- 2,317
Population outlook (Creek County) Hauer SSP2
- Today (2025)
- 72,706 people
- By 2030
- 73,032 · +0.4%
- By 2040
- 72,788 · +0.1%
- By 2050
- 71,558 · -1.6%
- By 2075
- 69,248 · -4.8%
- By 2100
- 62,722 · -13.7%
Race, ethnicity, and origin ACS 2023
- Neighborhood character
- Predominantly White (72%)
- Race & ethnicity
- White 72% Native American 13% Hispanic / Latino 9% Two or more races 8% Black 2%
- Hispanic origin (detail)
- Mexican 8%
- Common ancestry
- Italian 4% Slovak 2% Lithuanian 1%
- Foreign-born
- 4% · Canada
- Languages at home
- 92% English-only · Spanish 8%
Political lean MEDSL · Creek
- 2024 margin
- Solid R (+55.7) · D 21.2% · R 77.0% · Other 1.8%
- 2008→2024 swing
- -14.1pp toward R · 2008: -41.6pp · 2024: -55.7pp
- All cycles
- 2024: R+55.7 2020: R+54.8 2016: R+54.5 2012: R+45.4 2008: R+41.6
Not yet ingested
- Civics
- —
Market trends
- HPI YoY
- ▲ 5.49%
- Current HPI
- 231.6145
- Rent YoY
- —
- Metro
- —
- State GDP YoY
- ▲ 1.55%
- F500 in state
- 6
Industry mix (Fortune 500 HQ in OK)
| Industry | F500 HQs | Revenue |
|---|---|---|
| Energy | 3 | $48B |
|
||
Price history
+105.0% since first listed9 events — show timeline
- 2026-04-29 Pending — MLS Technology, Inc.
- 2026-04-22 Listed $199,900 MLS Technology, Inc.
- 2009-11-06 Sold (Public Records) $134,000 Public Records
- 2009-10-27 Sold (MLS) $134,000 MLS Technology, Inc.
- 2009-10-01 Listing Removed — MLS Technology, Inc.
- 2009-09-15 Listed $135,000 MLS Technology, Inc.
- 1997-09-11 Listing Removed — MLS Technology, Inc.
- 1997-09-02 Sold (Public Records) $97,500 Public Records
- 1997-03-25 Listed $97,500 MLS Technology, Inc.
Property tax history
+0.5%/yrLatest (2025): $1,619 · +0.1% YoY. Source: county tax records.
Cash-flow waterfall
monthlySold comps — $/sqft
last 12 mo · ≤1 miLoading sold comps…