14311 Nectarine St · Brookridge, FL
Flood risk 5/10 · Moderate
- FEMA flood zone
- X (unshaded)
- Chance of flooding over 30 yrs
- 0.24%
- Est. flood insurance / yr
- $507 – $1,088
Fire risk 5/10 · Moderate
- Est. fire insurance / yr
- $947 – $1,759
Heat risk 10/10 · Severe
- Hot days now (above 109°F)
- 7 days/yr
- Hot days in 30 yrs
- 27 days/yr
Wind risk 9/10 · Severe
- Chance of severe wind over 30 yrs
- 99.0%
Air-quality risk 2/10 · Minimal
- Unhealthy air days now
- 2 days/yr
- Unhealthy air days in 30 yrs
- 2 days/yr
Risk factors via First Street. Map © Google.
Why this score? — see what drove the D- grade
The composite is a weighted blend of 9 inputs, each scored 0–100. Each bar is that input's sub-score; the figure is the points it added to the 100-point composite (weight × sub-score).
- Cash flow +14.4/30.0
- DSCR +4.4/10.0
- Schools +4.2/10.0
- 1% rule +3.6/10.0
- Livability +3.5/5.0
- Rent growth +2.5/5.0
- Condition / age +2.5/5.0
- ARV discount +0.4/15.0
- Appreciation +0.0/10.0
$164,900
🖨 Deal sheet (PDF) 📄 Offer letter ✓ Due diligence
Listing remarks MLS
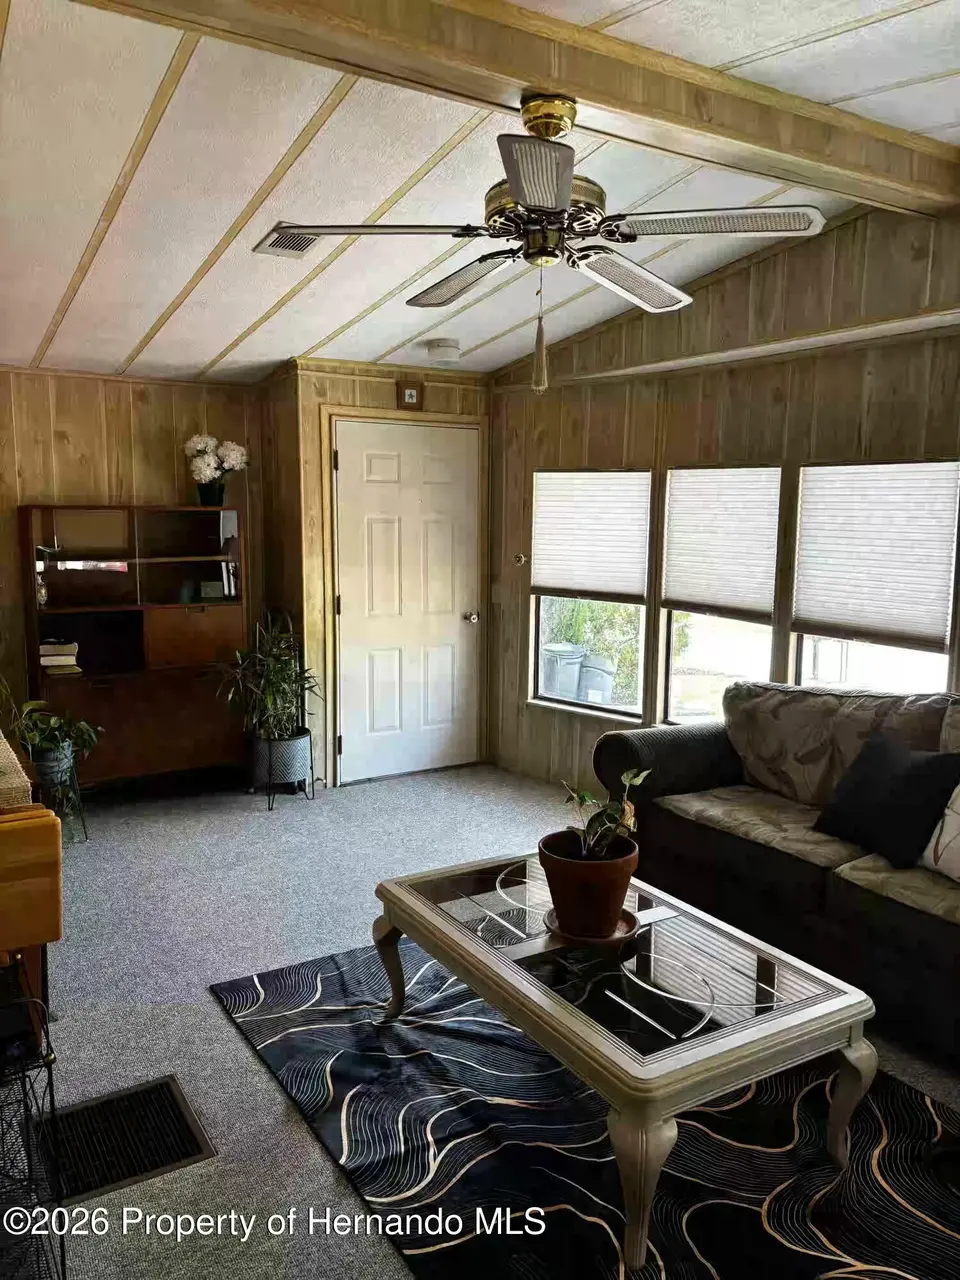
1983 2 bedroom 2 full bath
Key facts
- Brookridge community
- Close to club house
- Close to pool
Tags
Property features AI
Finance
- Other: Planned Development Project - Multi Family (zoning PDP (MF)); Subdivision: Brookridge Comm Unit 2
- HOA & community: Homeowners association (monthly fee $55); Association includes security; Community amenities: clubhouse, dog park, fitness center, golf course, gated entry, RV/boat storage, tennis courts, pool; Senior community
Exterior
- Parking: Attached covered carport (1 space)
- Security: 24-hour security; Gated community with guard; Smoke detectors
- Utilities: Public water; Public sewer; 150 amp electric service (underground); Cable connected; Electricity connected; Sewer connected; Water connected; Natural gas not available
- Home design: Manufactured home (double wide); One story; South-facing
- Construction: Vinyl siding
- Exterior features: Glass-enclosed patio; Patio; Cleared lot with few trees; Paved private road (private maintained)
Interior
- Kitchen: Dryer; Dishwasher; Electric range; Microwave; Refrigerator; Electric water heater
- Flooring: Carpet; Laminate; Vinyl
- Bathrooms: 2 full bathrooms
- Heating & cooling: Central heating; Electric heating; Heat pump; Central air; Electric cooling; Ceiling fans
- Interior features: Ceiling fans; Kitchen island; Vaulted ceilings; Walk-in closet(s); Furnished
- Laundry & utility: Washer; Washer hookup; Electric dryer hookup; Laundry sink
Neighborhood map
What this means for you Summary
Snapshot
- This is a 2-bed/2.0-bath manufactured listed at $165k.
Deal economics
- At list price, monthly cash flow is $34 ($406/yr) — positive.
- The deal already cash-flows at list — no discount required.
- To meet the 1% rule (rent ≥ 1% of price), the offer needs to be $142k (13.7% below list).
- Recommended offer: $142k (13.7% below list) — sets the bar for 1% rule.
Location & tenants
- Location reads 70/100 on livability (#421 in FL) — a middle-class / working-renter tenant base. Strengths: cost of living A+, housing A+, crime B+; Watch: employment C-, health & safety C-, amenities F.
- Hernando (suburban): math 50% / reading 50% proficiency, ranked #38 of 73 in FL (top 52%) — acceptable for families but not a draw, mixed tenant base, ~2y average lease.
- Zoned schools: Pine Grove Elementary School (math 60% / reading 45%, grade C-, #976 of 2,144 statewide, top 46%, 991 students, 60% FRL); West Hernando Middle School (math 36% / reading 37%, grade F, #405 of 571 statewide, top 72%, 695 students, 58% FRL); Central High School (math 34% / reading 44%, grade F, #312 of 667 statewide, top 48%, 1,426 students, 53% FRL) — zoned schools at 57% FRL track the district average.
- Market conditions: 695 active listings in the ZIP; 10 comparable units currently listed for rent nearby; rentals at typical pace (median 26d on market — plan ~3-4 weeks tenant-placement turnaround); 2,505 units permitted in Hernando County in 2024 (318 in 5+ unit buildings).
Forward outlook
- Local home prices are declining (-3.0%/yr); year-one equity from $1k of loan paydown is wiped out by about $5k of value loss. Plan a longer hold.
- Hernando County population projected at +11% by 2050 — modest demand growth; plan on rents tracking national, not racing it.
Negotiation context
- It's been on market 30 days — a 2% lower offer ($162k) is reasonable based on typical stale-listing flexibility.
- 3 sale attempts since 2y ago with the ask held roughly flat each time — persistent listings suggest the price (not the market) is what's stuck; bring a comps-based counter.
Risks & watch-outs
- Climate carrying-cost: moderate flood risk; severe wind risk, 99% chance of damaging wind over 30y; moderate wildfire risk; extreme-heat days projected 7→27/yr by 2055 (HVAC capex compounding) — expect insurance premiums to compound above CPI over the hold.
Questions for the listing agent
- What does the HOA fee cover, when was the last increase, and are there any pending special assessments or reserve-fund shortfalls?
- Is there a deadline driving the sale (1031 exchange, divorce, estate, relocation)? That informs how much negotiation room exists.
- Schools are F-rated, which usually means shorter tenancies and higher turnover. Who's the typical renter profile here, and what's been the actual vacancy rate?
- The area grade is low — what's the realistic commute time and amenity access for the typical tenant pool here? Any planned neighborhood developments (good or bad) we should know about?
- What's the average days-on-market for RENTAL listings here right now (not sales)? A rising rental-DOM trend means longer vacancies and softer asking-rent achievability than the comps imply.
- What's the recent tenant-quality profile in this submarket — average credit score on applications, eviction rate, late-payment / NSF rate, and stable-employment percentage? A property-management company in the area should have these aggregated.
- How much new for-sale + rental construction is in the pipeline within 1–3 miles? Heavy new supply typically softens prices + rents 12–24 months out; constrained supply supports both.
Investment metrics
- 1% rule
- 0.86% ✗
- Cap rate
- 6.54%
- Cash-on-cash
- 0.88%
- DSCR
- 1.04
- GRM
- 9.7
CMA / ARV
- ARV (on-the-fly)
- $142,480
- Comps found
- 12
Show comp detail 12 sales within ~0.75 mi
| Address | Dist | Beds/Ba | Sqft | Sold | Price | $/sf | Match |
|---|---|---|---|---|---|---|---|
| 14366 Starcross St | 0.10mi | 2/2.0 | 1,104 (+1%) | 2mo | $80,000 | $72 | 92 |
| 8057 Dinsmore St | 0.15mi | 2/2.0 | 1,152 (+5%) | 2mo | $85,000 | $74 | 83 |
| 14371 Nectarine St | 0.11mi | 2/2.0 | 1,178 (+8%) | 1mo | $205,000 | $174 | 82 |
| 14386 Starcross St | 0.13mi | 2/2.0 | 1,192 (+9%) | 4mo | $163,000 | $137 | 76 |
| 8304 Weatherford Ave | 0.37mi | 2/2.0 | 1,056 (-4%) | 1mo | $109,000 | $103 | 76 |
| 7443 Morelli Ave | 0.41mi | 2/2.0 | 1,120 (+2%) | 3mo | $144,000 | $129 | 75 |
| 7464 Dinsmore St | 0.19mi | 2/2.0 | 1,200 (+10%) | 2mo | $175,000 | $146 | 74 |
| 14470 Miranna St | 0.36mi | 2/3.0 | 1,012 (-8%) | 3mo | $165,000 | $163 | 64 |
| 14883 Rialto Ave | 0.74mi | 2/2.0 | 1,144 (+4%) | 0mo | $148,000 | $129 | 58 |
| 7429 Morelli Ave | 0.43mi | 2/2.0 | 960 (-12%) | 4mo | $118,000 | $123 | 56 |
| 14233 Rialto Ave | 0.69mi | 2/2.0 | 960 (-12%) | 4mo | $125,000 | $130 | 44 |
| 15472 Brookridge Blvd | 0.72mi | 3/2.0 (+1) | 960 (-12%) | 3mo | $166,000 | $173 | 38 |
Match score weights: distance 35% · size 25% · config 20% · recency 20%. Top-matched comps best support the ARV.
Projected returns pro-forma
-3.0% appreciation · 3.0% rent growth · sell at horizon
- IRR
- -14.9%
- Equity multiple
- 0.47×
- Total profit
- $-24,573
- Equity at exit
- $24,587
- IRR
- -6.3%
- Equity multiple
- 0.60×
- Total profit
- $-18,658
- Equity at exit
- $14,258
Cash invested: $46,172 (down + closing). Projections, not guarantees.
Landlord ↔ Tenant lean methodology
- Overall (STATE)
- 87 Strongly Landlord-Friendly
- State Florida
- 87 Strongly Landlord-Friendly · R+3
- County
- — inherits STATE
- City
- — inherits STATE
ZIP-level market 34613
- Home prices YoY
- -17.2%
- Active inventory
- 695
- Price-to-rent
- 9.7×
Monthly cashflow live
- Estimated rent
- $1,422 high interval (Pro) →
- Mortgage (P&I)
- −$865
- Tax from tax record
- −$101 /mo · $1,217/yr
- Insurance
- −$69
- HOA
- −$55
- Vacancy / Maint / Mgmt
- −$299
- Net cashflow
- $34
Break-even live
Sensitivity live
| Price | -10% $127 | -5% $81 | +0% $34 | +5% $-13 | +10% $-59 |
|---|---|---|---|---|---|
| Rent | -10% $-79 | -5% $-22 | +0% $34 | +5% $90 | +10% $146 |
| Rate | -1.0pp $117 | -0.5pp $76 | base $34 | +0.5pp $-9 | +1.0pp $-52 |
UW: 25.0% down · 7.5% · 30yr · 1.5% tax · 5.0% vac · 8.0% maint · 8.0% mgmt
Financing live
Cash to close
- Down payment
- $41,225
- Closing costs
- $4,947
- Reserves months
- —
- Total cash needed
- —
Loan-product check · same deal, 3 products live
Conventional
25% down · 7.5% · 30yr
- Down + closing
- —
- Monthly P&I
- —
- Monthly cashflow
- —
- DSCR
- —
- Eligible?
- —
Personal DTI + credit; lowest rate.
DSCR
20% down · 8.5% · 30yr
- Down + closing
- —
- Monthly P&I
- —
- Monthly cashflow
- —
- DSCR
- —
- Eligible?
- —
No personal income docs; deal must DSCR.
Hard money
10% down · 12.0% · 12mo
- Down + closing
- —
- Monthly P&I
- —
- Monthly cashflow
- —
- DSCR
- —
- Eligible?
- —
Short-term bridge; refi at stabilization.
Rent comps 10 comps
| Address | Beds | Baths | Sqft | Rent | $/sqft | DOM | Units | Dist |
|---|---|---|---|---|---|---|---|---|
| 14342 Starcross St Brooksville, FL | 2.0 | 1.0 | 900 | $1,025 | $1.14 | 23d | 1 | 0.03mi |
| 14697 Brookridge Blvd Brooksville, FL | 2.0 | 2.0 | 1056 | $1,350 | $1.28 | 26d | 1 | 0.28mi |
| 8407 Weatherford Ave Brooksville, FL | 2.0 | 2.0 | 1104 | $1,500 | $1.36 | 19d | 1 | 0.53mi |
| 15466 Brookridge Blvd Brooksville, FL | 2.0 | 2.0 | 828 | $1,225 | $1.48 | 26d | 1 | 0.69mi |
| 7124 Barclay Ave Unit A Spring Hill, FL | 2.0 | 2.0 | 927 | $1,500 | $1.62 | 26d | 1 | 0.69mi |
| 9919 Scepter Ave Brooksville, FL | 3.0 | 2.0 | 1188 | $1,250 | $1.05 | 6d | 1 | 0.96mi |
| 8917 Southern Charm Cir Brooksville, FL | 3.0 | 2.0 | 1437 | $1,695 | $1.18 | 5d | 1 | 0.97mi |
| 8871 Southern Charm Cir Brooksville, FL | 3.0 | 2.0 | 1482 | $2,050 | $1.38 | 26d | 1 | 1.01mi |
| 14373 Irving St Spring Hill, FL | 2.0 | 1.0 | 828 | $1,750 | $2.11 | 26d | 1 | 1.19mi |
| 14373 Irving St Unit B Brooksville, FL | 2.0 | 1.0 | 900 | $1,750 | $1.94 | 1d | 1 | 1.19mi |
HOA detail
- Monthly dues
- $55 · $660/yr
Listing history 24 events
-
2026-06-21days on market $164,900 Active 30 DOM
-
2026-06-18days on market $164,900 Active 27 DOM
-
2026-06-17days on market $164,900 Active 26 DOM
-
2026-06-16days on market $164,900 Active 25 DOM
-
2026-06-15days on market $164,900 Active 24 DOM
-
2026-06-13days on market $164,900 Active 22 DOM
-
2026-06-13days on market $164,900 Active 21 DOM
-
2026-06-09days on market $164,900 Active 18 DOM
-
2026-06-08days on market $164,900 Active 17 DOM
-
2026-06-07days on market $164,900 Active 16 DOM
-
2026-06-04days on market $164,900 Active 13 DOM
-
2026-06-03days on market $164,900 Active 12 DOM
-
2026-06-02days on market $164,900 Active 11 DOM
-
2026-06-01days on market $164,900 Active 10 DOM
-
2026-05-31days on market $164,900 Active 9 DOM
-
2026-05-22$164,900 Active
-
2024-04-05soldstatus $159,000 Closed 26-char remark
Show marketing remark (26 chars)
1983 2 bedroom 2 full bath
-
2024-04-05soldstatus $159,000 26-char remark
Show marketing remark (26 chars)
1983 2 bedroom 2 full bath
-
2024-02-27historical 26-char remark
Show marketing remark (26 chars)
1983 2 bedroom 2 full bath
-
2024-02-26$159,000 26-char remark
Show marketing remark (26 chars)
1983 2 bedroom 2 full bath
-
2024-02-26$159,000 26-char remark
Show marketing remark (26 chars)
1983 2 bedroom 2 full bath
-
2000-01-28soldstatus $39,000
-
1998-02-04soldstatus $38,500
-
1996-11-07soldstatus $37,000
ⓘ Source: listings_history table (triggers on properties + properties_extension) + one-shot
backfill from property_details.listing_events for pre-trigger history.
Tax reassessment forecast FL · Resets to sale price
- Current annual tax
- $1,217 · $101/mo
- Projected year-2 tax
- $1,369 · $114/mo
- Expected delta
- +$152/yr (+$13/mo · 12.5%)
ⓘ Screening estimate from a state-policy table — verify with the county assessor before closing.
Climate risk First Street
- Flood 5/10 Major FEMA zone X (unshaded) · 24% chance over 30 yrs
- Wildfire 5/10 Major
- Heat 10/10 Extreme 7 d/yr ≥109°F today · 27 d/yr by 30 yrs out
- Wind 9/10 Extreme 99% chance of damaging wind over 30 yrs
- Air quality 2/10 Low 2 unhealthy d/yr today · 2 by 30 yrs out
Nearby sold comps map
Loading sold comps map…
Walkable amenities ~0.75 mi
Loading nearby amenities…
Taxation est. · year 1
- Rental income
- $17,069
- − Mortgage interest
- −$9,237
- − Property taxes
- −$1,217
- − Insurance
- −$824
- − Repairs & maintenance
- −$1,366
- − Management
- −$1,366
- − HOA
- −$660
- − Depreciation
- −$4,797
- Taxable loss
- −$2,397
- Est. tax savings @ 24.0%
- +$575
- After-tax cash flow
- $982/yr
For passive investors: Depreciation is non-cash, so a rental often shows a tax loss while cash-flowing — sheltering income. Rental losses are passive: they offset passive income freely, and up to $25,000/yr can offset ordinary (W-2) income if you actively participate and your MAGI is under $100k (phasing out to $0 by $150k); unused losses carry forward. On sale, claimed depreciation is recaptured at up to 25%, and gains may owe capital-gains tax (a 1031 exchange can defer both). Figures are a year-1 estimate at your 24.0% rate — not tax advice; consult a CPA.
Schools (NCES district)
- District
- Hernando
- NCES district ID
- 1200810
- Math proficiency
- 50% ▼ -8.00%
- Reading proficiency
- 50% ▼ -4.00%
- Median HH income
- $41,985
- Composite
- 42.03/100
- National rank
- #3329
- State rank
- #38 of 73 in FL
Livability — Brookridge
- Score
- 70/100
- State rank
- #421
- US rank
- #7529
Category grades
Schools grade is shown separately in the Schools card above.
Census & demographics
- Census place
- Brookridge, FL
- County
- Hernando County · 169,677 people
- Metro
- Tampa-St. Petersburg-Clearwater, FL
- Population (ZIP)
- 19,337
- Household income
- $58,596
- Rent vs Own
- Severe rent burden
- 307.0
Population outlook (Hernando County) Hauer SSP2
- Today (2025)
- 189,218 people
- By 2030
- 194,367 · +2.7%
- By 2040
- 203,398 · +7.5%
- By 2050
- 209,589 · +10.8%
- By 2075
- 218,452 · +15.4%
- By 2100
- 205,923 · +8.8%
Race, ethnicity, and origin ACS 2023
- Neighborhood character
- Predominantly White (88%)
- Race & ethnicity
- White 88% Hispanic / Latino 6% Two or more races 4% Black 2% Asian 1%
- Hispanic origin (detail)
- Mexican 1% Puerto Rican 2% Cuban 1%
- Common ancestry
- Romanian 4% Lithuanian 3% Slovak 2%
- Foreign-born
- 8% · Canada, Vietnam
- Languages at home
- 92% English-only · Spanish 3% French/Haitian/Cajun 1% Russian/Polish/Slavic 1%
Political lean MEDSL · Hernando
- 2024 margin
- Solid R (+37.0) · D 31.1% · R 68.2%
- 2008→2024 swing
- -33.5pp toward R · 2008: -3.6pp · 2024: -37.0pp
- All cycles
- 2024: R+37.0 2020: R+30.2 2016: R+29.0 2012: R+8.5 2008: R+3.6
Not yet ingested
- Civics
- —
Market trends
- HPI YoY
- ▼ -57.51%
- Current HPI
- 276.2229
- Rent YoY
- —
- Metro
- Tampa-St. Petersburg-Clearwater, FL
- State GDP YoY
- ▲ 3.28%
- F500 in state
- 36
Industry mix (Fortune 500 HQ in FL)
| Industry | F500 HQs | Revenue |
|---|---|---|
| Industrial Technology | 2 | $29B |
|
||
| Insurance | 2 | $17B |
|
||
| Retail | 1 | $60B |
|
||
| Technology Distribution | 1 | $58B |
|
||
| Homebuilding | 1 | $35B |
|
||
| Technology Manufacturing | 1 | $35B |
|
||
Price history
+345.7% since first listed9 events — show timeline
- 2026-05-22 Listed $164,900 HCAR
- 2024-04-05 Sold (MLS) $159,000 St. Augustine and St. Johns County Board of REALTORS®
- 2024-04-05 Sold (MLS) $159,000 HCAR
- 2024-02-27 Listing Removed — HCAR
- 2024-02-26 Listed $159,000 St. Augustine and St. Johns County Board of REALTORS®
- 2024-02-26 Listed $159,000 HCAR
- 2000-01-28 Sold (Public Records) $39,000 Public Records
- 1998-02-04 Sold (Public Records) $38,500 Public Records
- 1996-11-07 Sold (Public Records) $37,000 Public Records
Property tax history
+13.3%/yrLatest (2025): $1,217 · +122.3% YoY. Source: county tax records.
Cash-flow waterfall
monthlySold comps — $/sqft
last 12 mo · ≤1 miLoading sold comps…