916 Harris Ave · Oklahoma City, OK
Flood risk 1/10 · Minimal
- FEMA flood zone
- X (unshaded)
- Chance of flooding over 30 yrs
- 0.0%
- Est. flood insurance / yr
- $507 – $1,088
Fire risk 1/10 · Minimal
- Est. fire insurance / yr
- $2,463 – $4,575
Heat risk 6/10 · Moderate
- Hot days now (above 107°F)
- 7 days/yr
- Hot days in 30 yrs
- 19 days/yr
Wind risk 2/10 · Minimal
- Chance of severe wind over 30 yrs
- 3.0%
Air-quality risk 2/10 · Minimal
- Unhealthy air days now
- 1 days/yr
- Unhealthy air days in 30 yrs
- 2 days/yr
Risk factors via First Street. Map © Google.
Why this score? — see what drove the B- grade
The composite is a weighted blend of 9 inputs, each scored 0–100. Each bar is that input's sub-score; the figure is the points it added to the 100-point composite (weight × sub-score).
- Cash flow +30.0/30.0
- 1% rule +10.0/10.0
- DSCR +10.0/10.0
- ARV discount +7.5/15.0
- Rent growth +4.3/5.0
- Livability +4.0/5.0
- Condition / age +2.5/5.0
- Schools +1.3/10.0
- Appreciation +0.0/10.0
$45,000
🖨 Deal sheet 📄 Offer letter ✓ Due diligence
Listing remarks
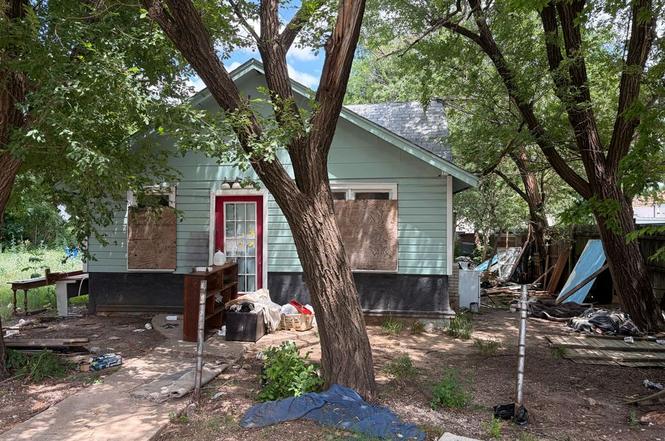
INVESTOR SPECIAL LAND VALUE / TEAR DOWN / REBUILD Attention cash buyers and savvy investors this is the opportunity you've been waiting for in one of OKC's most in-demand rental corridors. Located just minutes from Bethany, OK and the Putnam City corridor, this lot sits in an area with proven, consistent rental demand where quality housing inventory remains tight. The structure on this property has no salvageable value and is being sold as a dilapidated shell. The real value here is the concrete pad and the lot itself a clean, ready-to-develop 8,102 sq ft parcel in an established neighborhood. Demolish and build new, or scrape and park your next rental investment. Neighboring properties
Key facts
- Tear down
- Concrete pad
- Ready to develop
Tags
Property features AI
Exterior
- Home design: House
- Construction: Living area about 1,384
- Exterior features: Lot of approximately 8,102 sqft
Neighborhood map
What this means for you Summary
Snapshot
- This is a 2-bed/1.0-bath other listed at $45k.
Deal economics
- At list price, monthly cash flow is $559 ($7k/yr) — positive.
- The deal already cash-flows at list — no discount required.
- Meets the 1% rule at list price ($1k rent vs $45k).
- Cap rate 21.2% vs local median 3.7% in Oklahoma City — top-decile yield for the area; either an underpriced asset or a hidden risk that comps aren't pricing in. Stress-test before assuming the spread holds.
Location & tenants
- Location reads 80/100 on livability (#3 in OK, #1,635 nationally) — a professional / high-income tenant draw. Strengths: amenities A+, commute A+, cost of living A+; Watch: schools F, crime F.
- Putnam City (urban): math 12% / reading 16% proficiency, ranked #227 of 270 in OK (top 84%) — low school quality limits family demand, transient renter base, plan for 1-2y turnover; 65% free/reduced lunch — lower-income household profile, screen leases tightly.
- Market conditions: Rents rising fast (+7.3%/yr); 216 active listings in the ZIP; 22 comparable units currently listed for rent nearby; rentals at typical pace (median 24d on market — plan ~3-4 weeks tenant-placement turnaround); 5,365 units permitted in Oklahoma County in 2024 (569 in 5+ unit buildings).
Forward outlook
- Local home prices are declining (-3.0%/yr); year-one equity from $311 of loan paydown is wiped out by about $1k of value loss. Plan a longer hold.
- Oklahoma County population projected at +41% by 2050 — long-run rental-demand tailwind backs the buy-and-hold thesis.
- At projected returns (-3.0% appreciation + 7.3% rent growth), your $13k cash investment doubles in ~3 years — after that, you're playing with house money.
Negotiation context
- Only 4 days on market — expect competitive offers; lowballing is unlikely to land.
Risks & watch-outs
- Watch-outs: built in 1939 — expect roof / HVAC / electrical / plumbing capex.
- Climate carrying-cost: extreme-heat days projected 7→19/yr by 2055 (HVAC capex compounding) — expect insurance premiums to compound above CPI over the hold.
Questions for the listing agent
- Built in 1939 — when were the roof, HVAC, electrical panel, plumbing, and water heater last replaced?
- Is there a deadline driving the sale (1031 exchange, divorce, estate, relocation)? That informs how much negotiation room exists.
- Schools are F-rated, which usually means shorter tenancies and higher turnover. Who's the typical renter profile here, and what's been the actual vacancy rate?
- Crime grade is F in this area — have there been break-ins, vandalism, or insurance claims at this property in the last 3 years? What carrier currently insures it and at what premium?
- What's the average days-on-market for RENTAL listings here right now (not sales)? A rising rental-DOM trend means longer vacancies and softer asking-rent achievability than the comps imply.
- What's the recent tenant-quality profile in this submarket — average credit score on applications, eviction rate, late-payment / NSF rate, and stable-employment percentage? A property-management company in the area should have these aggregated.
- How much new for-sale + rental construction is in the pipeline within 1–3 miles? Heavy new supply typically softens prices + rents 12–24 months out; constrained supply supports both.
Investment metrics
- 1% rule
- 2.35% ✓
- Cap rate
- 21.21%
- Cash-on-cash
- 53.27%
- DSCR
- 3.37
- GRM
- 3.5
CMA / ARV
No comps found within radius.
Projected returns pro-forma
-3.0% appreciation · 7.29% rent growth · sell at horizon
- IRR
- 55.9%
- Equity multiple
- 3.63×
- Total profit
- $33,087
- Equity at exit
- $6,710
- IRR
- 62.5%
- Equity multiple
- 8.62×
- Total profit
- $96,010
- Equity at exit
- $3,891
Cash invested: $12,600 (down + closing). Projections, not guarantees.
Landlord ↔ Tenant lean methodology
- Overall (STATE)
- 83 Strongly Landlord-Friendly
- State Oklahoma
- 83 Strongly Landlord-Friendly · R+20
- County
- — inherits STATE
- City
- — inherits STATE
ZIP-level market 73107
- Rents YoY
- 7.3%
- Active inventory
- 216
- Price-to-rent
- 3.5×
Monthly cashflow live
- Estimated rent
- $1,058 high interval (Pro) →
- Mortgage (P&I)
- −$236
- Tax from tax record
- −$21 /mo · $257/yr
- Insurance
- −$19
- HOA
- −$0
- Vacancy / Maint / Mgmt
- −$222
- Net cashflow
- $559
Break-even live
UW: 25.0% down · 7.5% · 30yr · 1.5% tax · 5.0% vac · 8.0% maint · 8.0% mgmt
Financing live
Cash to close
- Down payment
- $11,250
- Closing costs
- $1,350
- Reserves months
- —
- Total cash needed
- —
Loan-product check · same deal, 3 products live
Conventional
25% down · 7.5% · 30yr
- Down + closing
- —
- Monthly P&I
- —
- Monthly cashflow
- —
- DSCR
- —
- Eligible?
- —
Personal DTI + credit; lowest rate.
DSCR
20% down · 8.5% · 30yr
- Down + closing
- —
- Monthly P&I
- —
- Monthly cashflow
- —
- DSCR
- —
- Eligible?
- —
No personal income docs; deal must DSCR.
Hard money
10% down · 12.0% · 12mo
- Down + closing
- —
- Monthly P&I
- —
- Monthly cashflow
- —
- DSCR
- —
- Eligible?
- —
Short-term bridge; refi at stabilization.
Rent comps 22 comps
| Address | Beds | Baths | Sqft | Rent | $/sqft | DOM | Units | Dist |
|---|---|---|---|---|---|---|---|---|
| 800 N Meridian Ave Oklahoma City, OK | 1.0–3.0 | 1.0–2.0 | 912 | $829 | $0.91 | 23d | 1 | 0.05mi |
| 4220 NW 10th St Unit 11F Oklahoma City, OK | 3.0 | 2.0 | 1100 | $1,055 | $0.96 | 23d | 1 | 0.29mi |
| 4304 NW 11th St Oklahoma City, OK | 3.0 | 1.5 | 1147 | $1,200 | $1.05 | 2d | 1 | 0.38mi |
| 1307 N Meridian Ave Oklahoma City, OK | 2.0 | 1.0–2.0 | 1242 | $925 | $0.74 | 2d | 6 | 0.44mi |
| 1309 N Meridian Ave Oklahoma City, OK | 1.0–2.0 | 1.0–1.5 | 925 | $975 | $1.05 | 2d | 4 | 0.49mi |
| 1041 N Tabor Ave Oklahoma City, OK | 3.0 | 1.0 | 1200 | $1,050 | $0.88 | 23d | 1 | 0.79mi |
| 2221 N Meridian Ave Oklahoma City, OK | 2.0 | 1.5 | 1200 | $995 | $0.83 | 2d | 1 | 1.06mi |
| 3733 NW 15th St Oklahoma City, OK | 3.0 | 1.0 | 995 | $1,150 | $1.16 | 23d | 1 | 1.07mi |
| 1616 Julie Pl Oklahoma City, OK | 3.0 | 2.0 | 1600 | $1,535 | $0.96 | 23d | 1 | 1.12mi |
| 3609 NW 13th St Oklahoma City, OK | 2.0 | 1.5 | 1042 | $1,250 | $1.20 | 2d | 1 | 1.16mi |
| 4746 NW 23rd St Oklahoma City, OK | 2.0 | 1.0 | 975 | $815 | $0.84 | 2d | 1 | 1.18mi |
| 4746 NW 23rd St Oklahoma City, OK | 2.0 | 1.0 | 975 | $725 | $0.74 | 23d | 1 | 1.18mi |
| 4750 NW 23rd St Oklahoma City, OK | 2.0 | 1.0 | 975 | $830 | $0.85 | 23d | 1 | 1.18mi |
| 3800 NW 19th St Oklahoma City, OK | 3.0 | 1.0 | 1073 | $1,250 | $1.16 | 23d | 1 | 1.20mi |
| 4750 NW 23rd St Unit 158 Oklahoma City, OK | 2.0 | 1.0 | 975 | $785 | $0.81 | 23d | 1 | 1.21mi |
| 1233 1/2 N Grand Blvd Oklahoma City, OK | 2.0 | 1.0 | 950 | $925 | $0.97 | 23d | 1 | 1.25mi |
| 1912 N Moulton Ct Unit 1912 Oklahoma City, OK | 3.0 | 2.0 | 1311 | $1,400 | $1.07 | 23d | 1 | 1.28mi |
| 3625 NW 18th St Oklahoma City, OK | 3.0 | 2.0 | 1040 | $1,500 | $1.44 | 43d | 1 | 1.29mi |
| 2626 N Meridian Ave Oklahoma City, OK | 1.0–2.0 | 1.0–2.0 | 1040 | $845 | $0.81 | 3d | 1 | 1.38mi |
| 3905 NW 23rd St Oklahoma City, OK | 2.0 | 1.5 | 1044 | $1,100 | $1.05 | 17d | 1 | 1.38mi |
| 1621 Kavel Dr Oklahoma City, OK | 3.0 | 2.0 | 1283 | $1,700 | $1.33 | 23d | 1 | 1.40mi |
| 5700 NW 23rd St Oklahoma City, OK | 3.0 | 2.0 | 1180 | $1,050 | $0.89 | 23d | 1 | 1.46mi |
Listing history 5 events
-
2026-06-18days on market $45,000 Active 4 DOM
-
2026-06-17days on market $45,000 Active 3 DOM
-
2026-06-16days on market $45,000 Active 2 DOM
-
2026-06-15remarks 699-char remark
-
2026-06-15$45,000 Active 1 DOM
ⓘ Source: listings_history table (triggers on properties + properties_extension) + one-shot
backfill from property_details.listing_events for pre-trigger history.
Tax reassessment forecast OK · Resets to sale price
- Current annual tax
- $257 · $21/mo
- Projected year-2 tax
- $405 · $34/mo
- Expected delta
- +$148/yr (+$12/mo · 57.9%)
ⓘ Screening estimate from a state-policy table — verify with the county assessor before closing.
Climate risk First Street
- Flood 1/10 Low FEMA zone X (unshaded) · 0% chance over 30 yrs
- Wildfire 1/10 Low
- Heat 6/10 Major 7 d/yr ≥107°F today · 19 d/yr by 30 yrs out
- Wind 2/10 Low 3% chance of damaging wind over 30 yrs
- Air quality 2/10 Low 1 unhealthy d/yr today · 2 by 30 yrs out
Nearby sold comps map
Loading sold comps map…
Walkable amenities ~0.75 mi
Loading nearby amenities…
Taxation est. · year 1
- Rental income
- $12,690
- − Mortgage interest
- −$2,521
- − Property taxes
- −$257
- − Insurance
- −$225
- − Repairs & maintenance
- −$1,015
- − Management
- −$1,015
- − Depreciation
- −$1,309
- Taxable income
- $6,348
- Est. tax owed @ 24.0%
- −$1,524
- After-tax cash flow
- $5,188/yr
For passive investors: Depreciation is non-cash, so a rental often shows a tax loss while cash-flowing — sheltering income. Rental losses are passive: they offset passive income freely, and up to $25,000/yr can offset ordinary (W-2) income if you actively participate and your MAGI is under $100k (phasing out to $0 by $150k); unused losses carry forward. On sale, claimed depreciation is recaptured at up to 25%, and gains may owe capital-gains tax (a 1031 exchange can defer both). Figures are a year-1 estimate at your 24.0% rate — not tax advice; consult a CPA.
Schools (NCES district)
- District
- Putnam City
- NCES district ID
- 4025290
- Math proficiency
- 12% ▼ -18.00%
- Reading proficiency
- 16% ▼ -14.00%
- Median HH income
- $46,657
- Composite
- 12.61/100
- National rank
- #9614
- State rank
- #227 of 270 in OK
Livability — Oklahoma City
- Score
- 80/100
- State rank
- #3
- US rank
- #1635
Category grades
Schools grade is shown separately in the Schools card above.
Census & demographics
- Census place
- Oklahoma City, OK
- County
- Oklahoma County · 771,644 people
- City population
- 498,656
- Metro
- Oklahoma City, OK
- Population (ZIP)
- 25,791
- Household income
- $56,873
- Rent vs Own
- Severe rent burden
- 1210.0
Population outlook (Oklahoma County) Hauer SSP2
- Today (2025)
- 911,875 people
- By 2030
- 982,413 · +7.7%
- By 2040
- 1,130,468 · +24.0%
- By 2050
- 1,288,422 · +41.3%
- By 2075
- 1,711,482 · +87.7%
- By 2100
- 2,088,448 · +129.0%
Race, ethnicity, and origin ACS 2023
- Neighborhood character
- Diverse neighborhood (Simpson 0.64)
- Race & ethnicity
- White 47% Hispanic / Latino 37% Two or more races 13% Native American 6% Black 5% Asian 2%
- Hispanic origin (detail)
- Mexican 22%
- Common ancestry
- Lithuanian 1% Italian 1% Slovak 1%
- Foreign-born
- 19% · Canada, Vietnam
- Languages at home
- 67% English-only · Spanish 30% Vietnamese 1%
Political lean MEDSL · Oklahoma
- 2024 margin
- Toss-up / Even · D 48.0% · R 49.7% · Other 2.3%
- 2008→2024 swing
- +15.1pp toward D · 2008: -16.8pp · 2024: -1.7pp
- All cycles
- 2024: R+1.7 2020: R+1.1 2016: R+10.5 2012: R+16.7 2008: R+16.8
Not yet ingested
- Civics
- —
Market trends
- HPI YoY
- ▼ -245.03%
- Current HPI
- 274.7844
- Rent YoY
- ▲ 7.29%
- Metro
- Oklahoma City, OK
- State GDP YoY
- ▲ 1.55%
- F500 in state
- 6
Industry mix (Fortune 500 HQ in OK)
| Industry | F500 HQs | Revenue |
|---|---|---|
| Energy | 3 | $48B |
|
||
Price history
1 event — show timeline
- 2026-06-14 Listed $45,000 ForSaleByOwner.com
Property tax history
+1.8%/yrLatest (2025): $257 · +1.8% YoY. Source: county tax records.
Cash-flow waterfall
monthlySold comps — $/sqft
last 12 mo · ≤1 miLoading sold comps…