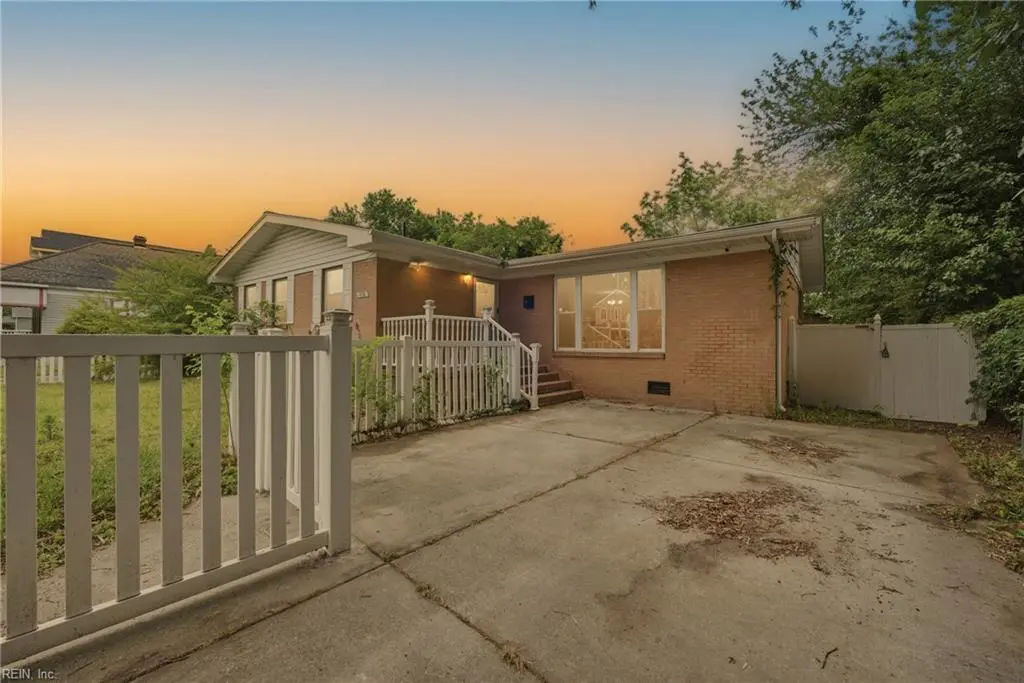
616 Powhatan Pkwy · Hampton, VA
Flood risk 6/10 · Moderate
- FEMA flood zone
- X (unshaded)
- Chance of flooding over 30 yrs
- 0.53%
- Est. flood insurance / yr
- $473 – $860
Fire risk 1/10 · Minimal
- Est. fire insurance / yr
- $666 – $1,236
Heat risk 9/10 · Severe
- Hot days now (above 105°F)
- 7 days/yr
- Hot days in 30 yrs
- 16 days/yr
Wind risk 8/10 · Major
- Chance of severe wind over 30 yrs
- 80.0%
Air-quality risk 2/10 · Minimal
- Unhealthy air days now
- 1 days/yr
- Unhealthy air days in 30 yrs
- 1 days/yr
Risk factors via First Street. Map © Google.
Why this score? — see what drove the D+ grade
The composite is a weighted blend of 9 inputs, each scored 0–100. Each bar is that input's sub-score; the figure is the points it added to the 100-point composite (weight × sub-score).
- ARV discount +14.5/15.0
- Cash flow +11.3/30.0
- Schools +5.5/10.0
- Rent growth +5.0/5.0
- Livability +3.8/5.0
- DSCR +3.3/10.0
- 1% rule +2.7/10.0
- Condition / age +2.5/5.0
- Appreciation +0.0/10.0
$360,000
🖨 Deal sheet (PDF) 📄 Offer letter ✓ Due diligence
Listing remarks
Charming all-brick ranch offering 4 bedrooms and 3 full bathrooms with a versatile layout designed for comfort and flexibility! Featuring separate living areas for multi-generational living, added privacy, or creating a guest retreat. Spacious living spaces provide room to spread out, while the functional floor plan offers endless possibilities for entertaining, working from home, or everyday living. Enjoy the timeless charm of brick construction combined with the convenience of generous bedrooms, multiple full baths, and flexible living options all under one roof.
Key facts
- 6,603 sq ft lot
- Built 1963
- Listed 29 days
Property features AI
Finance
- HOA & community: No HOA
Exterior
- Parking: Driveway parking space
- Utilities: City/County water; City/County sewer; Electric water heater; Electric service
- Home design: Detached home; Ranch style; Single-story (1 living level)
- Construction: Brick siding; Asphalt shingle roof; Crawl foundation
- Exterior features: Deck; Back, front and fully fenced yard; Storage shed
Interior
- Kitchen: Dishwasher; Microwave; Electric range; Refrigerator
- Bedrooms: Bedroom with full bathroom on the first floor
- Flooring: Ceramic flooring; Wood flooring
- Bathrooms: 3 full bathrooms
- Heating & cooling: Heat pump heating; Central air conditioning
- Interior features: Ceiling fan; Cable hookup; Wood-burning fireplace; Scuttle access; Walk-in closet
- Laundry & utility: Washer hookup; Dryer hookup
Neighborhood map
What this means for you Summary
Snapshot
- This is a 4-bed/3.0-bath single-family listed at $360k.
Deal economics
- At list price, monthly cash flow is $-131 ($-2k/yr) — negative.
- To cash-flow at today's rent, offer at most $337k (6.4% below list).
- To meet the 1% rule (rent ≥ 1% of price), the offer needs to be $278k (22.8% below list).
- Recommended offer: $278k (22.8% below list) — sets the bar for 1% rule.
- Cap rate 5.9% vs local median 4.5% in Hampton — top-decile yield for the area; either an underpriced asset or a hidden risk that comps aren't pricing in. Stress-test before assuming the spread holds.
Location & tenants
- Location reads 75/100 on livability (#133 in VA, #4,302 nationally) — a middle-class / working-renter tenant base. Strengths: housing A+, health & safety A+, cost of living A; Watch: crime C-, amenities D+, commute F.
- Hampton City Public School District (urban): math 60% / reading 70% proficiency, ranked #40 of 131 in VA (top 30%) — acceptable for families but not a draw, mixed tenant base, ~2y average lease.
- Zoned schools: A.W.E. Bassette Elementary (math 32% / reading 47%, grade F, #900 of 1,108 statewide, top 83%, 494 students, 87% FRL); C. Alton Lindsay Middle (math 52% / reading 57%, grade B-, #194 of 342 statewide, top 60%, 707 students, 73% FRL); Hampton High (math 60% / reading 75%, grade B, #183 of 319 statewide, top 58%, 1,359 students, 86% FRL) — zoned schools average 82% FRL vs 49% district-wide (33 pts higher); higher-poverty schools than district average — tighter screening recommended.
- Market conditions: Rents rising fast (+21.4%/yr); 124 active listings in the ZIP; 11 comparable units currently listed for rent nearby; rentals at typical pace (median 25d on market — plan ~3-4 weeks tenant-placement turnaround); 68 units permitted in Hampton city in 2024 (0 in 5+ unit buildings).
- At $2,780/mo this rent would consume 51% of the median local household income ($65k/yr) (locally 704% of renters already pay >50% of income on rent) — very limited rent-growth headroom before tenants either downsize or default.
Forward outlook
- Local home prices are declining (-3.0%/yr); year-one equity from $2k of loan paydown is wiped out by about $11k of value loss. Plan a longer hold.
- Hampton County population projected at -13% by 2050 — secular population decline; favor cash flow + early exit over multi-decade hold.
Negotiation context
- It's been on market 29 days — a 2% lower offer ($355k) is reasonable based on typical stale-listing flexibility.
- 4 sale attempts since 10y ago with the ask held roughly flat each time — persistent listings suggest the price (not the market) is what's stuck; bring a comps-based counter.
Risks & watch-outs
- Climate carrying-cost: major flood risk; severe wind risk, 80% chance of damaging wind over 30y; extreme-heat days projected 7→16/yr by 2055 (HVAC capex compounding) — expect insurance premiums to compound above CPI over the hold.
Questions for the listing agent
- What do current leases actually rent for vs. the listed asking? Can we see a recent rent roll and the last 12 months of T-12 income?
- Built in 1963 — when were the roof, HVAC, electrical panel, plumbing, and water heater last replaced?
- Is there a deadline driving the sale (1031 exchange, divorce, estate, relocation)? That informs how much negotiation room exists.
- Schools are B-rated — typically a magnet for longer-tenancy family renters. What's the average tenant stay here, and is there a school-zone premium baked into asking?
- The area grade is low — what's the realistic commute time and amenity access for the typical tenant pool here? Any planned neighborhood developments (good or bad) we should know about?
- What's the average days-on-market for RENTAL listings here right now (not sales)? A rising rental-DOM trend means longer vacancies and softer asking-rent achievability than the comps imply.
- What's the recent tenant-quality profile in this submarket — average credit score on applications, eviction rate, late-payment / NSF rate, and stable-employment percentage? A property-management company in the area should have these aggregated.
- How much new for-sale + rental construction is in the pipeline within 1–3 miles? Heavy new supply typically softens prices + rents 12–24 months out; constrained supply supports both.
Investment metrics
- 1% rule
- 0.77% ✗
- Cap rate
- 5.86%
- Cash-on-cash
- -1.56%
- DSCR
- 0.93
- GRM
- 10.8
CMA / ARV
- ARV (on-the-fly)
- $425,790
- Comps found
- 12
Show comp detail 12 sales within ~0.75 mi
| Address | Dist | Beds/Ba | Sqft | Sold | Price | $/sf | Match |
|---|---|---|---|---|---|---|---|
| 607 Pocahontas Pl | 0.08mi | 4/2.5 | 2,332 (-9%) | 4mo | $405,000 | $174 | 76 |
| 709 Pocahontas Pl | 0.15mi | 4/2.5 | 2,350 (-8%) | 3mo | $404,900 | $172 | 75 |
| 605 Pocahontas Pl | 0.08mi | 5/3.0 (+1) | 2,350 (-8%) | 8mo | $405,000 | $172 | 71 |
| 2523 Laguard Dr | 0.11mi | 4/3.0 | 2,226 (-13%) | 6mo | $329,900 | $148 | 68 |
| 608 Kentucky Ave | 0.36mi | 4/3.0 | 2,414 (-6%) | 17mo | $399,900 | $166 | 59 |
| 143 Robinson Rd | 0.60mi | 4/2.5 | 2,396 (-7%) | 7mo | $330,000 | $138 | 53 |
| 403 Darnaby Ave | 0.57mi | 4/2.5 | 2,273 (-11%) | 4mo | $355,000 | $156 | 49 |
| 1813 Laguard Dr | 0.47mi | 4/2.5 | 2,200 (-14%) | 6mo | $375,000 | $170 | 47 |
| 405 Harbor Dr | 0.63mi | 3/2.0 (-1) | 2,312 (-10%) | 5mo | $400,000 | $173 | 41 |
| 135 Hampton Roads Ave | 0.61mi | 4/3.0 | 2,250 (-12%) | 13mo | $312,500 | $139 | 40 |
| 115 Powhatan Pkwy | 0.60mi | 4/2.0 | 2,276 (-11%) | 19mo | $354,900 | $156 | 33 |
| 137 Hampton Roads Ave | 0.60mi | 4/2.0 | 2,200 (-14%) | 15mo | $300,000 | $136 | 32 |
Match score weights: distance 35% · size 25% · config 20% · recency 20%. Top-matched comps best support the ARV.
Projected returns pro-forma
-3.0% appreciation · 8.0% rent growth · sell at horizon
- IRR
- -13.8%
- Equity multiple
- 0.48×
- Total profit
- $-52,055
- Equity at exit
- $53,677
- IRR
- 1.2%
- Equity multiple
- 1.10×
- Total profit
- $10,554
- Equity at exit
- $31,126
Cash invested: $100,800 (down + closing). Projections, not guarantees.
Landlord ↔ Tenant lean methodology
- Overall (STATE)
- 55 Moderately Landlord-Leaning
- State Virginia
- 55 Moderately Landlord-Leaning · D+2
- County
- — inherits STATE
- City
- — inherits STATE
ZIP-level market 23661
- Home prices YoY
- -16.7%
- Rents YoY
- 21.4%
- Active inventory
- 124
- Price-to-rent
- 10.8×
Monthly cashflow live
- Estimated rent
- $2,780 high interval (Pro) →
- Mortgage (P&I)
- −$1,888
- Tax from tax record
- −$290 /mo · $3,476/yr
- Insurance
- −$150
- HOA
- −$0
- Vacancy / Maint / Mgmt
- −$584
- Net cashflow
- $-131
Break-even live
Sensitivity live
| Price | -10% $73 | -5% $-29 | +0% $-131 | +5% $-233 | +10% $-335 |
|---|---|---|---|---|---|
| Rent | -10% $-351 | -5% $-241 | +0% $-131 | +5% $-21 | +10% $88 |
| Rate | -1.0pp $50 | -0.5pp $-40 | base $-131 | +0.5pp $-224 | +1.0pp $-319 |
UW: 25.0% down · 7.5% · 30yr · 1.5% tax · 5.0% vac · 8.0% maint · 8.0% mgmt
Financing live
Cash to close
- Down payment
- $90,000
- Closing costs
- $10,800
- Reserves months
- —
- Total cash needed
- —
Loan-product check · same deal, 3 products live
Conventional
25% down · 7.5% · 30yr
- Down + closing
- —
- Monthly P&I
- —
- Monthly cashflow
- —
- DSCR
- —
- Eligible?
- —
Personal DTI + credit; lowest rate.
DSCR
20% down · 8.5% · 30yr
- Down + closing
- —
- Monthly P&I
- —
- Monthly cashflow
- —
- DSCR
- —
- Eligible?
- —
No personal income docs; deal must DSCR.
Hard money
10% down · 12.0% · 12mo
- Down + closing
- —
- Monthly P&I
- —
- Monthly cashflow
- —
- DSCR
- —
- Eligible?
- —
Short-term bridge; refi at stabilization.
Rent comps 11 comps
| Address | Beds | Baths | Sqft | Rent | $/sqft | DOM | Units | Dist |
|---|---|---|---|---|---|---|---|---|
| 707 Pennsylvania Ave Hampton, VA | 4.0 | 2.5 | 2134 | $2,800 | $1.31 | 25d | 1 | 0.49mi |
| 130 Chancellor Rd Hampton, VA | 4.0 | 1.0 | 2000 | $1,995 | $1.00 | 6d | 1 | 0.61mi |
| 426 Seminole Rd Hampton, VA | 4.0 | 2.5 | 2200 | $2,450 | $1.11 | 16d | 1 | 0.85mi |
| 1501 Chesapeake Ave Hampton, VA | 5.0 | 3.0 | 2723 | $3,795 | $1.39 | 45d | 1 | 0.89mi |
| 13 Hampshire Glen Pkwy Hampton, VA | 5.0 | 2.5 | 2651 | $3,700 | $1.40 | 25d | 1 | 0.90mi |
| 101 Prince James Dr Hampton, VA | 3.0 | 1.0 | 1766 | $1,645 | $0.93 | 16d | 1 | 0.99mi |
| 731 Childs Ave Hampton, VA | 5.0 | 3.0 | 2305 | $2,750 | $1.19 | 16d | 1 | 1.04mi |
| 42 Kilverstone Way Hampton, VA | 4.0 | 2.5 | 2654 | $3,800 | $1.43 | 45d | 1 | 1.13mi |
| 310 Lasalle Ave Hampton, VA | 3.0 | 2.0 | 1858 | $2,200 | $1.18 | 45d | 1 | 1.15mi |
| 13 Rockingham Dr Hampton, VA | 5.0 | 3.5 | 2615 | $3,500 | $1.34 | 45d | 1 | 1.29mi |
| 729 Chesapeake Ave Hampton, VA | 4.0 | 3.0 | 2239 | $2,975 | $1.33 | 4d | 1 | 1.31mi |
Listing history 28 events
-
2026-06-21days on market $360,000 Active 29 DOM
-
2026-06-18days on market $360,000 Active 26 DOM
-
2026-06-17days on market $360,000 Active 25 DOM
-
2026-06-16days on market $360,000 Active 24 DOM
-
2026-06-15days on market $360,000 Active 23 DOM
-
2026-06-13days on market $360,000 Active 21 DOM
-
2026-06-13days on market $360,000 Active 20 DOM
-
2026-06-09days on market $360,000 Active 17 DOM
-
2026-06-08pricedays on market $360,000 Active 16 DOM
-
2026-06-07days on market $375,000 Active 15 DOM
-
2026-06-03days on market $375,000 Active 11 DOM
-
2026-06-02days on market $375,000 Active 10 DOM
-
2026-06-01days on market $375,000 Active 9 DOM
-
2026-05-31days on market $375,000 Active 8 DOM
-
2026-05-23$375,000 Active
-
2024-07-29soldstatus $319,900
-
2024-07-07status Under Contract
-
2024-06-24historical Active Under Contract
-
2024-06-09$319,900 Active
-
2024-02-24historical
-
2024-01-03price $324,000
-
2023-11-24$325,000 Active
-
2016-09-19soldstatus $160,000
-
2016-08-31status Under Contract
-
2016-08-30historical
-
2016-07-21price $165,000
-
2016-07-11price $173,000
-
2016-06-06$178,600 Active
ⓘ Source: listings_history table (triggers on properties + properties_extension) + one-shot
backfill from property_details.listing_events for pre-trigger history.
Tax reassessment forecast VA · Resets to sale price
- Current annual tax
- $3,476 · $290/mo
- Projected year-2 tax
- $3,476 · $290/mo
- Expected delta
- $0/yr ($0/mo · 0.0%)
ⓘ Screening estimate from a state-policy table — verify with the county assessor before closing.
Climate risk First Street
- Flood 6/10 Major FEMA zone X (unshaded) · 53% chance over 30 yrs
- Wildfire 1/10 Low
- Heat 9/10 Extreme 7 d/yr ≥105°F today · 16 d/yr by 30 yrs out
- Wind 8/10 Severe 80% chance of damaging wind over 30 yrs
- Air quality 2/10 Low 1 unhealthy d/yr today · 1 by 30 yrs out
Nearby sold comps map
Loading sold comps map…
Walkable amenities ~0.75 mi
Loading nearby amenities…
Taxation est. · year 1
- Rental income
- $33,362
- − Mortgage interest
- −$20,166
- − Property taxes
- −$3,476
- − Insurance
- −$1,800
- − Repairs & maintenance
- −$2,669
- − Management
- −$2,669
- − Depreciation
- −$10,473
- Taxable loss
- −$7,890
- Est. tax savings @ 24.0%
- +$1,894
- After-tax cash flow
- $319/yr
For passive investors: Depreciation is non-cash, so a rental often shows a tax loss while cash-flowing — sheltering income. Rental losses are passive: they offset passive income freely, and up to $25,000/yr can offset ordinary (W-2) income if you actively participate and your MAGI is under $100k (phasing out to $0 by $150k); unused losses carry forward. On sale, claimed depreciation is recaptured at up to 25%, and gains may owe capital-gains tax (a 1031 exchange can defer both). Figures are a year-1 estimate at your 24.0% rate — not tax advice; consult a CPA.
Schools (NCES district)
- District
- Hampton City Public School District
- NCES district ID
- 5101800
- Math proficiency
- 60% ▼ -21.00%
- Reading proficiency
- 70% ▼ -4.00%
- Median HH income
- $50,089
- Composite
- 55.19/100
- National rank
- #1272
- State rank
- #40 of 131 in VA
Livability — Hampton
- Score
- 75/100
- State rank
- #133
- US rank
- #4302
Category grades
Schools grade is shown separately in the Schools card above.
Census & demographics
- Census place
- Hampton, VA
- County
- Hampton City · 132,421 people
- City population
- 132,421
- Metro
- Virginia Beach-Norfolk-Newport News, VA-NC
- Population (ZIP)
- 14,005
- Household income
- $65,446
- Rent vs Own
- Severe rent burden
- 704.0
Population outlook (Hampton County) Hauer SSP2
- Today (2025)
- 134,055 people
- By 2030
- 131,753 · -1.7%
- By 2040
- 125,017 · -6.7%
- By 2050
- 116,825 · -12.9%
- By 2075
- 97,033 · -27.6%
- By 2100
- 76,188 · -43.2%
Race, ethnicity, and origin ACS 2023
- Neighborhood character
- Diverse neighborhood (Simpson 0.56)
- Race & ethnicity
- Black 59% White 31% Two or more races 6% Hispanic / Latino 4%
- Common ancestry
- Serbian 2% Italian 2% Romanian 1%
- Foreign-born
- 3% · Canada
- Languages at home
- 95% English-only · Spanish 2% French/Haitian/Cajun 1% Arabic 1%
Political lean MEDSL · Hampton
- 2024 margin
- Solid D (+39.9) · D 69.2% · R 29.4% · Other 1.4%
- 2008→2024 swing
- +1.0pp no change · 2008: 38.9pp · 2024: 39.9pp
- All cycles
- 2024: D+39.9 2020: D+42.2 2016: D+37.8 2012: D+45.4 2008: D+38.9
Not yet ingested
- Civics
- —
Market trends
- HPI YoY
- ▼ -54.95%
- Current HPI
- 274.2769
- Rent YoY
- ▲ 21.35%
- Metro
- Virginia Beach-Norfolk-Newport News, VA-NC
- State GDP YoY
- ▲ 2.40%
- F500 in state
- 50
Industry mix (Fortune 500 HQ in VA)
| Industry | F500 HQs | Revenue |
|---|---|---|
| Aerospace / Defense | 4 | $236B |
|
||
| Technology / Defense | 3 | $32B |
|
||
| Financial Services | 2 | $176B |
|
||
| Utilities | 2 | $27B |
|
||
| Insurance | 2 | $25B |
|
||
| Technology | 2 | $15B |
|
||
Price history
+110.0% since first listed14 events — show timeline
- 2026-05-23 Listed $375,000 REINMLS
- 2024-07-29 Sold (Public Records) $319,900 Public Records
- 2024-07-07 Pending — REINMLS
- 2024-06-24 Contingent — REINMLS
- 2024-06-09 Listed $319,900 REINMLS
- 2024-02-24 Listing Removed — REINMLS
- 2024-01-03 Price Changed $324,000 REINMLS
- 2023-11-24 Listed $325,000 REINMLS
- 2016-09-19 Sold (Public Records) $160,000 Public Records
- 2016-08-31 Pending — REINMLS
- 2016-08-30 Listing Removed — REINMLS
- 2016-07-21 Price Changed $165,000 REINMLS
- 2016-07-11 Price Changed $173,000 REINMLS
- 2016-06-06 Listed $178,600 REINMLS
Property tax history
+26.0%/yrLatest (2025): $3,476 · +6.1% YoY. Source: county tax records.
Cash-flow waterfall
monthlySold comps — $/sqft
last 12 mo · ≤1 miLoading sold comps…