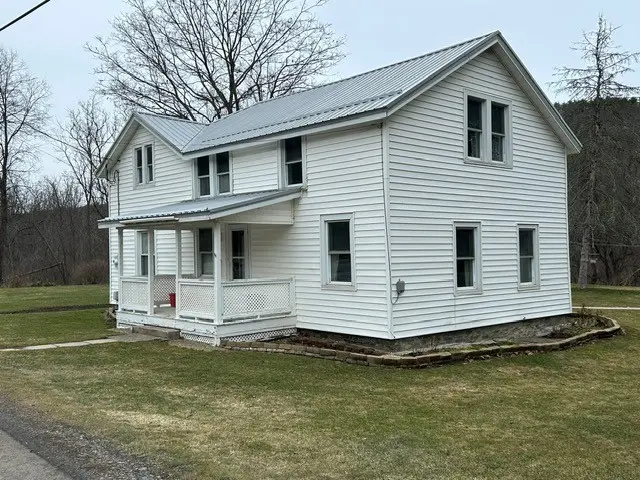
1117 Ithaca Rd · Candor, NY
Flood risk 1/10 · Minimal
- FEMA flood zone
- X (unshaded)
- Chance of flooding over 30 yrs
- 0.0%
- Est. flood insurance / yr
- $473 – $860
Fire risk 2/10 · Minimal
- Est. fire insurance / yr
- $691 – $1,283
Heat risk 2/10 · Minimal
- Hot days now (above 93°F)
- 7 days/yr
- Hot days in 30 yrs
- 16 days/yr
Wind risk 2/10 · Minimal
- Chance of severe wind over 30 yrs
- 1.0%
Air-quality risk 2/10 · Minimal
- Unhealthy air days now
- 0 days/yr
- Unhealthy air days in 30 yrs
- 1 days/yr
Risk factors via First Street. Map © Google.
Why this score? — see what drove the D grade
The composite is a weighted blend of 9 inputs, each scored 0–100. Each bar is that input's sub-score; the figure is the points it added to the 100-point composite (weight × sub-score).
- Appreciation +10.0/10.0
- Cash flow +9.0/30.0
- ARV discount +7.5/15.0
- Schools +3.1/10.0
- Livability +3.1/5.0
- 1% rule +2.8/10.0
- DSCR +2.5/10.0
- Rent growth +2.5/5.0
- Condition / age +2.5/5.0
$185,000
🖨 Deal sheet (PDF) 📄 Offer letter ✓ Due diligence
Listing remarks
Offered for the first time in over 30 years, this charming 1900 farmhouse sits on 3.2 acres and features three bedrooms and one-and-a-half baths. The property includes a separate two-car garage and a large carport, offering plenty of space for vehicles and storage. The home has been well maintained with many documented improvements, including a new roof in 2023 with warranty, septic pump replaced in 2020, updated windows, and a newly drilled well. The front porch was replaced in 2004, and hardwood floors are under the second-floor carpeting. A wonderful opportunity to own a classic farmhouse with space, character, and important updates already in place.
Key facts
- Updated windows
- Septic pump replaced
- Large carport
Tags
Property features AI
Finance
- Other: Property type: Single-family residence; Lot size: 3.2 acres (approx. 274 x 420)
- Financial info: Investor or rental income details not specified
- HOA & community: No HOA information specified
Exterior
- Parking: Detached 2-car garage; Carport; Driveway with turnaround; Gravel parking areas
- Security: No security features specified
- Utilities: Well water; Septic tank; Electricity connected; Propane
- Home design: Residential single-family home; Two levels / 2 stories; Entry level not specified; Facing direction not specified
- Construction: Vinyl siding; Stone foundation; Built year not specified
- Exterior features: Metal roof; Shed(s) / storage; Near public transit; Rectangular lot
Interior
- Kitchen: Gas oven; Gas range; Refrigerator; Eat-in kitchen
- Bedrooms: Bedrooms not specified
- Flooring: Carpet; Hardwood; Vinyl; Varied flooring
- Bathrooms: 1 full bathroom; 1 half bathroom; One main-level bathroom
- Heating & cooling: Forced air heating (oil); Ceiling fans for cooling; Cooling present
- Interior features: Ceiling fans; Eat-in kitchen; Drapes and window treatments; 7 total rooms; Partial crawl space basement
- Laundry & utility: Washer and dryer included; Main-level laundry room
Neighborhood map
What this means for you Summary
Snapshot
- This is a 3-bed/1.5-bath single-family listed at $185k.
Deal economics
- At list price, monthly cash flow is $-146 ($-2k/yr) — negative.
- To cash-flow at today's rent, offer at most $159k (13.9% below list).
- To meet the 1% rule (rent ≥ 1% of price), the offer needs to be $145k (21.8% below list).
- Recommended offer: $145k (21.8% below list) — sets the bar for 1% rule.
Location & tenants
- Location reads 61/100 on livability (#895 in NY) — a middle-class / working-renter tenant base. Strengths: cost of living A+, housing A+; Watch: health & safety D, crime F, amenities F.
- Candor Central School District (rural): math 26% / reading 45% proficiency, ranked #551 of 590 in NY (top 93%) — families likely to look elsewhere, expect single-tenant / working-renter base with shorter leases.
- Zoned schools: Candor Elementary School (math 17% / reading 42%, grade F, #1,729 of 2,108 statewide, top 84%, 400 students, 46% FRL).
- Market conditions: 6 active listings in the ZIP; 139 units permitted in Tioga County in 2024 (65 in 5+ unit buildings).
Forward outlook
- In year one you build about $20k of equity ($1k loan paydown + $18k appreciation (10.0% local appreciation)).
- Tioga County population projected at -27% by 2050 — secular population decline; favor cash flow + early exit over multi-decade hold.
- By year 2, paydown + projected appreciation supports a ~$32k cash-out refi (75% LTV) — recoverable capital for the next deal without selling this one.
Negotiation context
- It's been on market 66 days — a 6% lower offer ($174k) is reasonable based on typical stale-listing flexibility.
Risks & watch-outs
- Watch-outs: built in 1900 — expect roof / HVAC / electrical / plumbing capex.
Questions for the listing agent
- What do current leases actually rent for vs. the listed asking? Can we see a recent rent roll and the last 12 months of T-12 income?
- It's been on market 66 days. Have you received any prior offers? Is the seller open to a 22% concession, seller financing, or rate buy-down credit?
- Built in 1900 — when were the roof, HVAC, electrical panel, plumbing, and water heater last replaced?
- Why hasn't it sold? Are there any deal-killer items the seller is aware of (foundation, flood, title, zoning, code violations)?
- Is there a deadline driving the sale (1031 exchange, divorce, estate, relocation)? That informs how much negotiation room exists.
- Schools are D-rated, which usually means shorter tenancies and higher turnover. Who's the typical renter profile here, and what's been the actual vacancy rate?
- Crime grade is F in this area — have there been break-ins, vandalism, or insurance claims at this property in the last 3 years? What carrier currently insures it and at what premium?
- The area grade is low — what's the realistic commute time and amenity access for the typical tenant pool here? Any planned neighborhood developments (good or bad) we should know about?
- What's the average days-on-market for RENTAL listings here right now (not sales)? A rising rental-DOM trend means longer vacancies and softer asking-rent achievability than the comps imply.
- What's the recent tenant-quality profile in this submarket — average credit score on applications, eviction rate, late-payment / NSF rate, and stable-employment percentage? A property-management company in the area should have these aggregated.
- How much new for-sale + rental construction is in the pipeline within 1–3 miles? Heavy new supply typically softens prices + rents 12–24 months out; constrained supply supports both.
Investment metrics
- 1% rule
- 0.78% ✗
- Cap rate
- 5.35%
- Cash-on-cash
- -3.37%
- DSCR
- 0.85
- GRM
- 10.7
CMA / ARV
- ARV (on-the-fly)
- $184,800
- Comps found
- 1
Show comp detail 1 sale within ~0.75 mi
| Address | Dist | Beds/Ba | Sqft | Sold | Price | $/sf | Match |
|---|---|---|---|---|---|---|---|
| 23 Willseyville Rd | 0.63mi | 3/2.0 | 1,664 (+8%) | 12mo | $199,000 | $120 | 46 |
Match score weights: distance 35% · size 25% · config 20% · recency 20%. Top-matched comps best support the ARV.
Projected returns pro-forma
10.0% appreciation · 3.0% rent growth · sell at horizon
- IRR
- 21.9%
- Equity multiple
- 2.77×
- Total profit
- $91,517
- Equity at exit
- $166,663
- IRR
- 19.7%
- Equity multiple
- 6.34×
- Total profit
- $276,846
- Equity at exit
- $359,414
Cash invested: $51,800 (down + closing). Projections, not guarantees.
Landlord ↔ Tenant lean methodology
- Overall (STATE)
- 15 Strongly Tenant-Friendly
- State New York
- 15 Strongly Tenant-Friendly · D+10
- County
- — inherits STATE
- City
- — inherits STATE
ZIP-level market 13864
- Home prices YoY
- 3.8%
- Active inventory
- 6
- Price-to-rent
- 10.7×
Monthly cashflow live
- Estimated rent
- $1,447 medium interval (Pro) →
- Mortgage (P&I)
- −$970
- Tax from tax record
- −$241 /mo · $2,898/yr
- Insurance
- −$77
- HOA
- −$0
- Vacancy / Maint / Mgmt
- −$304
- Net cashflow
- $-146
Break-even live
Sensitivity live
| Price | -10% $-41 | -5% $-93 | +0% $-146 | +5% $-198 | +10% $-250 |
|---|---|---|---|---|---|
| Rent | -10% $-260 | -5% $-203 | +0% $-146 | +5% $-88 | +10% $-31 |
| Rate | -1.0pp $-52 | -0.5pp $-98 | base $-146 | +0.5pp $-193 | +1.0pp $-242 |
UW: 25.0% down · 7.5% · 30yr · 1.5% tax · 5.0% vac · 8.0% maint · 8.0% mgmt
Financing live
Cash to close
- Down payment
- $46,250
- Closing costs
- $5,550
- Reserves months
- —
- Total cash needed
- —
Loan-product check · same deal, 3 products live
Conventional
25% down · 7.5% · 30yr
- Down + closing
- —
- Monthly P&I
- —
- Monthly cashflow
- —
- DSCR
- —
- Eligible?
- —
Personal DTI + credit; lowest rate.
DSCR
20% down · 8.5% · 30yr
- Down + closing
- —
- Monthly P&I
- —
- Monthly cashflow
- —
- DSCR
- —
- Eligible?
- —
No personal income docs; deal must DSCR.
Hard money
10% down · 12.0% · 12mo
- Down + closing
- —
- Monthly P&I
- —
- Monthly cashflow
- —
- DSCR
- —
- Eligible?
- —
Short-term bridge; refi at stabilization.
Listing history 3 events
-
2026-05-21status Pending
-
2026-03-25historical Active Under Contract
-
2026-03-16$185,000 Active
ⓘ Source: listings_history table (triggers on properties + properties_extension) + one-shot
backfill from property_details.listing_events for pre-trigger history.
Tax reassessment forecast NY · Partial reset (capped growth)
- Current annual tax
- $2,898 · $241/mo
- Projected year-2 tax
- $3,012 · $251/mo
- Expected delta
- +$114/yr (+$10/mo · 3.9%)
ⓘ Screening estimate from a state-policy table — verify with the county assessor before closing.
Climate risk First Street
- Flood 1/10 Low FEMA zone X (unshaded) · 0% chance over 30 yrs
- Wildfire 2/10 Low
- Heat 2/10 Low 7 d/yr ≥93°F today · 16 d/yr by 30 yrs out
- Wind 2/10 Low 100% chance of damaging wind over 30 yrs
- Air quality 2/10 Low 0 unhealthy d/yr today · 1 by 30 yrs out
Nearby sold comps map
Loading sold comps map…
Walkable amenities ~0.75 mi
Loading nearby amenities…
Taxation est. · year 1
- Rental income
- $17,366
- − Mortgage interest
- −$10,363
- − Property taxes
- −$2,898
- − Insurance
- −$925
- − Repairs & maintenance
- −$1,389
- − Management
- −$1,389
- − Depreciation
- −$5,382
- Taxable loss
- −$4,981
- Est. tax savings @ 24.0%
- +$1,195
- After-tax cash flow
- $-551/yr
For passive investors: Depreciation is non-cash, so a rental often shows a tax loss while cash-flowing — sheltering income. Rental losses are passive: they offset passive income freely, and up to $25,000/yr can offset ordinary (W-2) income if you actively participate and your MAGI is under $100k (phasing out to $0 by $150k); unused losses carry forward. On sale, claimed depreciation is recaptured at up to 25%, and gains may owe capital-gains tax (a 1031 exchange can defer both). Figures are a year-1 estimate at your 24.0% rate — not tax advice; consult a CPA.
Schools (NCES district)
- District
- Candor Central School District
- NCES district ID
- 3606420
- Math proficiency
- 26% ▼ -10.00%
- Reading proficiency
- 45% ▲ 17.00%
- Median HH income
- $51,707
- Composite
- 30.85/100
- National rank
- #6129
- State rank
- #551 of 590 in NY
Livability — Candor
- Score
- 61/100
- State rank
- #895
- US rank
- #17419
Category grades
Schools grade is shown separately in the Schools card above.
Census & demographics
- Population (ZIP)
- 1,421
Population outlook (Tioga County) Hauer SSP2
- Today (2025)
- 45,155 people
- By 2030
- 42,801 · -5.2%
- By 2040
- 37,960 · -15.9%
- By 2050
- 33,071 · -26.8%
- By 2075
- 24,144 · -46.5%
- By 2100
- 16,545 · -63.4%
Race, ethnicity, and origin ACS 2023
- Neighborhood character
- Predominantly White (74%)
- Race & ethnicity
- White 74% Hispanic / Latino 21% Black 3% Two or more races 1%
- Hispanic origin (detail)
- Puerto Rican 21%
- Common ancestry
- Iranian 7% Slovak 3% Italian 3%
Political lean MEDSL · Tioga
- 2024 margin
- Strong R (+22.9) · D 38.6% · R 61.4%
- 2008→2024 swing
- -12.7pp toward R · 2008: -10.2pp · 2024: -22.9pp
- All cycles
- 2024: R+22.9 2020: R+20.6 2016: R+27.6 2012: R+15.1 2008: R+10.2
Not yet ingested
- Civics
- —
Market trends
- HPI YoY
- ▲ 11.47%
- Current HPI
- 311.3656
- Rent YoY
- —
- Metro
- —
- State GDP YoY
- ▲ 2.60%
- F500 in state
- 92
Industry mix (Fortune 500 HQ in NY)
| Industry | F500 HQs | Revenue |
|---|---|---|
| Financial Services | 10 | $950B |
|
||
| Consumer Goods | 9 | $162B |
|
||
| Insurance | 4 | $225B |
|
||
| Telecommunications | 2 | $144B |
|
||
| Pharmaceuticals | 2 | $112B |
|
||
| Media / Entertainment | 2 | $69B |
|
||
Price history
3 events — show timeline
- 2026-05-21 Pending — IBRMLS
- 2026-03-25 Contingent — IBRMLS
- 2026-03-16 Listed $185,000 IBRMLS
Property tax history
+1.8%/yrLatest (2025): $2,898 · +2.5% YoY. Source: county tax records.
Cash-flow waterfall
monthlySold comps — $/sqft
last 12 mo · ≤1 miLoading sold comps…