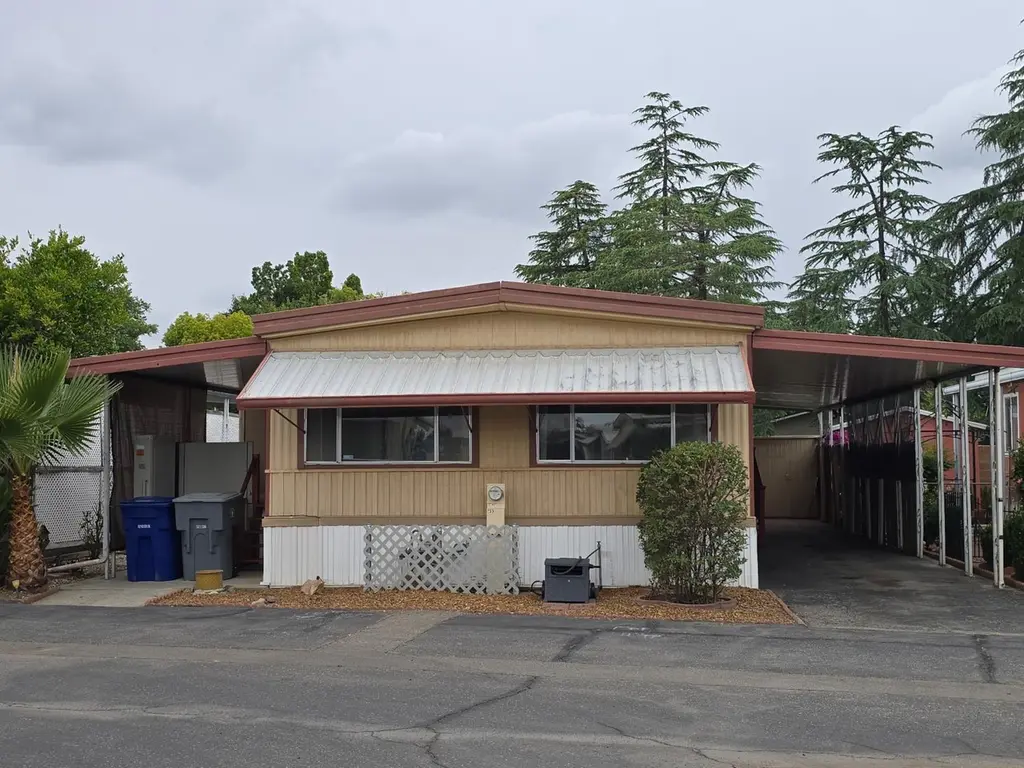
1724 Minnewawa Ave #155 · Clovis, CA
Flood risk 1/10 · Minimal
- FEMA flood zone
- X (unshaded)
- Chance of flooding over 30 yrs
- 0.0%
- Est. flood insurance / yr
- $507 – $1,088
Fire risk 1/10 · Minimal
- Est. fire insurance / yr
- $659 – $1,223
Heat risk 8/10 · Major
- Hot days now (above 105°F)
- 6 days/yr
- Hot days in 30 yrs
- 14 days/yr
Wind risk 1/10 · Minimal
- Chance of severe wind over 30 yrs
- —
Air-quality risk 10/10 · Severe
- Unhealthy air days now
- 57 days/yr
- Unhealthy air days in 30 yrs
- 60 days/yr
Risk factors via First Street. Map © Google.
Why this score? — see what drove the B- grade
The composite is a weighted blend of 9 inputs, each scored 0–100. Each bar is that input's sub-score; the figure is the points it added to the 100-point composite (weight × sub-score).
- Cash flow +30.0/30.0
- 1% rule +10.0/10.0
- DSCR +10.0/10.0
- Schools +5.9/10.0
- Livability +3.8/5.0
- Rent growth +3.2/5.0
- Condition / age +2.5/5.0
- ARV discount +0.0/15.0
- Appreciation +0.0/10.0
$94,750
🖨 Deal sheet (PDF) 📄 Offer letter ✓ Due diligence
Listing remarks MLS
This rejuvenated gem is priced to sell! Make an appointment today.
Key facts
- Handicap accessible
- Outside storage shed
- Community pool
Tags
Property features AI
Finance
- HOA & community: Monthly association fee
Exterior
- Parking: Carport; Has carport
- Utilities: Electric service on; Public sewer; Public utilities
- Home design: Mobile home; Park space rented; Heritage make
- Construction: Metal roof; Metal siding; Wood subfloor
- Exterior features: One level; Shed(s); Urban lot
Interior
- Flooring: Carpet; Laminate
- Bathrooms: 2 bathrooms
- Heating & cooling: Central heating and cooling; Has heating; Has cooling
- Interior features: Built-in features; Wheelchair access
- Laundry & utility: Laundry inside
Neighborhood map
What this means for you Summary
Snapshot
- This is a 2-bed/2.0-bath manufactured listed at $95k.
Deal economics
- At list price, monthly cash flow is $673 ($8k/yr) — positive.
- The deal already cash-flows at list — no discount required.
- Meets the 1% rule at list price ($2k rent vs $95k).
- Recommended offer: $92k (3.0% below list) — sets the bar for market timing.
- Cap rate 14.8% vs local median 3.0% in Clovis — top-decile yield for the area; either an underpriced asset or a hidden risk that comps aren't pricing in. Stress-test before assuming the spread holds.
Location & tenants
- Location reads 76/100 on livability (#92 in CA, #3,307 nationally) — a middle-class / working-renter tenant base. Strengths: commute A+, housing A+, employment A; Watch: amenities C-, health & safety D, cost of living F.
- Clovis Unified (suburban): math 58% / reading 72% proficiency, ranked #152 of 1,400 in CA (top 11%) — acceptable for families but not a draw, mixed tenant base, ~2y average lease.
- Zoned schools: Sierra Vista Elementary (503 students, 87% FRL); Clark Intermediate (1,462 students, 61% FRL); Clovis High (2,905 students, 48% FRL) — zoned schools average 65% FRL vs 32% district-wide (34 pts higher); higher-poverty schools than district average — tighter screening recommended.
- Market conditions: Rents rising (+2.6%/yr); 86 active listings in the ZIP; 40 comparable units currently listed for rent nearby; rentals at typical pace (median 26d on market — plan ~3-4 weeks tenant-placement turnaround); 42% of comp listings sitting > 30 days — soft ceiling on asking rent; 2,426 units permitted in Fresno County in 2024 (296 in 5+ unit buildings).
- This rent runs 30% of the median local income ($67k/yr) — at the standard rent-burdened threshold; future hikes will face affordability resistance.
Forward outlook
- Local home prices are declining (-3.0%/yr); year-one equity from $656 of loan paydown is wiped out by about $3k of value loss. Plan a longer hold.
- Fresno County population projected at +11% by 2050 — modest demand growth; plan on rents tracking national, not racing it.
- At projected returns (-3.0% appreciation + 2.6% rent growth), your $27k cash investment doubles in ~4 years — after that, you're playing with house money.
Negotiation context
- It's been on market 48 days — a 3% lower offer ($92k) is reasonable based on typical stale-listing flexibility.
- 5 sale attempts since 23y ago with the ask held roughly flat each time — persistent listings suggest the price (not the market) is what's stuck; bring a comps-based counter.
- Current owner paid $66k; 44% above their basis — modest negotiation headroom, anchor on the comps not their cost.
Risks & watch-outs
- Climate carrying-cost: extreme-heat days projected 6→14/yr by 2055 (HVAC capex compounding) — expect insurance premiums to compound above CPI over the hold.
Questions for the listing agent
- It's been on market 48 days. Have you received any prior offers? Is the seller open to a 3% concession, seller financing, or rate buy-down credit?
- Built in 1973 — when were the roof, HVAC, electrical panel, plumbing, and water heater last replaced?
- Is there a deadline driving the sale (1031 exchange, divorce, estate, relocation)? That informs how much negotiation room exists.
- Schools are B-rated — typically a magnet for longer-tenancy family renters. What's the average tenant stay here, and is there a school-zone premium baked into asking?
- What's the average days-on-market for RENTAL listings here right now (not sales)? A rising rental-DOM trend means longer vacancies and softer asking-rent achievability than the comps imply.
- What's the recent tenant-quality profile in this submarket — average credit score on applications, eviction rate, late-payment / NSF rate, and stable-employment percentage? A property-management company in the area should have these aggregated.
- How much new for-sale + rental construction is in the pipeline within 1–3 miles? Heavy new supply typically softens prices + rents 12–24 months out; constrained supply supports both.
Investment metrics
- 1% rule
- 1.77% ✓
- Cap rate
- 14.81%
- Cash-on-cash
- 30.42%
- DSCR
- 2.35
- GRM
- 4.7
CMA / ARV
- ARV (median comp)
- $76,707
- List price
- $94,750
- Delta
- 23.52%
- Verdict
- OVERPRICED
- Comps
- 20 within 1.0 mi
Show comp detail 12 sales within ~0.75 mi
| Address | Dist | Beds/Ba | Sqft | Sold | Price | $/sf | Match |
|---|---|---|---|---|---|---|---|
| 1272 Villa Ave #66 | 0.42mi | 2/2.0 | 1,000 (0%) | 4mo | $70,000 | $70 | 77 |
| 1650 Villa Ave #9 | 0.30mi | 2/2.0 | 1,040 (+4%) | 3mo | $120,000 | $115 | 77 |
| 1724 Minnewawa Ave #134 | 0.00mi | 2/2.0 | 1,140 (+14%) | 1mo | $90,000 | $79 | 76 |
| 1650 Villa Ave #7 | 0.30mi | 2/2.0 | 1,040 (+4%) | 9mo | $120,000 | $115 | 72 |
| 1724 Minnewawa Ave | 0.12mi | 2/2.0 | 1,100 (+10%) | 11mo | $65,000 | $59 | 69 |
| 1724 Minnewawa Ave #166 | 0.16mi | 2/1.0 | 900 (-10%) | 4mo | $53,900 | $60 | 68 |
| 1724 Minnewawa #184 | 0.16mi | 2/2.0 | 1,100 (+10%) | 11mo | $65,000 | $59 | 67 |
| 1500 E Villa Avenue Ave N #19 | 0.25mi | 2/2.0 | 1,050 (+5%) | 23mo | $100,000 | $95 | 61 |
| 1001 Sylmar Ave #239 | 0.72mi | 2/1.0 | 1,000 (0%) | 5mo | $124,900 | $125 | 58 |
| 1500 Villa #45 | 0.39mi | 2/2.0 | 1,080 (+8%) | 16mo | $65,000 | $60 | 55 |
| 1500 Villa Ave #53 | 0.39mi | 2/1.8 | 1,128 (+13%) | 11mo | $69,950 | $62 | 51 |
| 1500 Villa Ave #33 | 0.39mi | 1/1.8 (-1) | 1,100 (+10%) | 21mo | $116,000 | $105 | 42 |
Match score weights: distance 35% · size 25% · config 20% · recency 20%. Top-matched comps best support the ARV.
Projected returns pro-forma
-3.0% appreciation · 2.65% rent growth · sell at horizon
- IRR
- 24.7%
- Equity multiple
- 2.01×
- Total profit
- $26,915
- Equity at exit
- $14,128
- IRR
- 32.3%
- Equity multiple
- 3.88×
- Total profit
- $76,292
- Equity at exit
- $8,192
Cash invested: $26,530 (down + closing). Projections, not guarantees.
Landlord ↔ Tenant lean methodology
- Overall (STATE)
- 18 Strongly Tenant-Friendly
- State California
- 18 Strongly Tenant-Friendly · D+13
- County
- — inherits STATE
- City
- — inherits STATE
ZIP-level market 93612
- Rents YoY
- 2.6%
- Active inventory
- 86
- Price-to-rent
- 4.7×
Monthly cashflow live
- Estimated rent
- $1,680 high interval (Pro) →
- Mortgage (P&I)
- −$497
- Tax est. 1.5%
- −$118 /mo · $1,421/yr
- Insurance
- −$39
- HOA
- −$0
- Vacancy / Maint / Mgmt
- −$353
- Net cashflow
- $673
Break-even live
Sensitivity live
| Price | -10% $738 | -5% $705 | +0% $673 | +5% $640 | +10% $607 |
|---|---|---|---|---|---|
| Rent | -10% $540 | -5% $606 | +0% $673 | +5% $739 | +10% $805 |
| Rate | -1.0pp $720 | -0.5pp $697 | base $673 | +0.5pp $648 | +1.0pp $623 |
UW: 25.0% down · 7.5% · 30yr · 1.5% tax · 5.0% vac · 8.0% maint · 8.0% mgmt
Financing live
Cash to close
- Down payment
- $23,688
- Closing costs
- $2,842
- Reserves months
- —
- Total cash needed
- —
Loan-product check · same deal, 3 products live
Conventional
25% down · 7.5% · 30yr
- Down + closing
- —
- Monthly P&I
- —
- Monthly cashflow
- —
- DSCR
- —
- Eligible?
- —
Personal DTI + credit; lowest rate.
DSCR
20% down · 8.5% · 30yr
- Down + closing
- —
- Monthly P&I
- —
- Monthly cashflow
- —
- DSCR
- —
- Eligible?
- —
No personal income docs; deal must DSCR.
Hard money
10% down · 12.0% · 12mo
- Down + closing
- —
- Monthly P&I
- —
- Monthly cashflow
- —
- DSCR
- —
- Eligible?
- —
Short-term bridge; refi at stabilization.
Rent comps 40 comps
| Address | Beds | Baths | Sqft | Rent | $/sqft | DOM | Units | Dist |
|---|---|---|---|---|---|---|---|---|
| 69 W Beverly Ave Unit Advertising Unit Clovis, CA | 2.0 | 1.0 | 850 | $1,650 | $1.94 | 46d | 1 | 0.12mi |
| 139 W Portals Ave Clovis, CA | 2.0 | 1.0 | 1014 | $1,600 | $1.58 | 46d | 1 | 0.38mi |
| 1108 Villa Ave Clovis, CA | 2.0 | 1.5 | 900 | $1,500 | $1.67 | 46d | 1 | 0.43mi |
| 50 W 9th St Clovis, CA | 2.0 | 2.0 | 1100 | $1,500 | $1.36 | 25d | 1 | 0.45mi |
| 322 W Barstow Ave Unit 101 Clovis, CA | 2.0 | 2.0 | 1100 | $2,150 | $1.95 | 46d | 1 | 0.45mi |
| 33 W Santa Ana Ave Apt A Clovis, CA | 2.0 | 1.5 | 900 | $1,450 | $1.61 | 5d | 1 | 0.47mi |
| 189 W Santa Ana Ave Apt F Clovis, CA | 2.0 | 1.0 | 800 | $1,450 | $1.81 | 5d | 1 | 0.53mi |
| 145 Rall Ave Clovis, CA | 3.0 | 2.0 | 1200 | $1,900 | $1.58 | 18d | 1 | 0.54mi |
| 361 W Santa Ana Ave Clovis, CA | 1.0 | 1.0 | 735 | $1,150 | $1.56 | 46d | 1 | 0.66mi |
| 1099 Sylmar Ave Clovis, CA | 2.0 | 1.0 | 965 | $1,750 | $1.81 | 25d | 3 | 0.69mi |
| 740 Villa Ave Clovis, CA | 2.0 | 2.0 | 922 | $1,950 | $2.11 | 23d | 1 | 0.72mi |
| 707 Bush Ave Clovis, CA | 2.0 | 1.0 | 950 | $1,575 | $1.66 | 46d | 1 | 0.77mi |
| 608 W Scott Ave Clovis, CA | 3.0 | 2.0 | 1398 | $2,100 | $1.50 | 0d | 1 | 0.77mi |
| 1008 Jefferson Ave Unit D Clovis, CA | 2.0 | 1.0 | 700 | $1,375 | $1.96 | 25d | 1 | 0.78mi |
| 563 W Alamos Ave Unit D Clovis, CA | 1.0 | 1.0 | 700 | $1,195 | $1.71 | 5d | 1 | 0.80mi |
| 1201 Scott Ave Clovis, CA | 2.0 | 1.0 | 932 | $1,575 | $1.69 | 0d | 4 | 0.82mi |
| 55 W Bullard Ave Clovis, CA | 1.0–2.0 | 1.0 | 800 | $1,741 | $2.18 | 0d | 12 | 0.83mi |
| 2243 Helm Ave Unit 102 Clovis, CA | 2.0 | 2.0 | 1100 | $1,925 | $1.75 | 23d | 1 | 0.86mi |
| 5477 E Indianapolis Ave Fresno, CA | 3.0 | 1.0 | 1403 | $2,295 | $1.64 | 46d | 1 | 0.86mi |
| 400 W Gettysburg Ave Apt 208A Clovis, CA | 2.0 | 1.0 | 904 | $1,500 | $1.66 | 46d | 1 | 0.95mi |
| 400 W Gettysburg Ave Unit 116B Clovis, CA | 2.0 | 2.0 | 994 | $1,795 | $1.81 | 46d | 1 | 0.95mi |
| 400 W Gettysburg Ave Unit 206B Clovis, CA | 2.0 | 1.0 | 904 | $1,500 | $1.66 | 25d | 1 | 0.95mi |
| 400 W Gettysburg Ave Unit 145A Clovis, CA | 1.0 | 1.0 | 714 | $1,500 | $2.10 | 25d | 1 | 0.95mi |
| 400 W Gettysburg Ave Apt 223A Clovis, CA | 2.0 | 2.0 | 994 | $1,700 | $1.71 | 46d | 1 | 0.95mi |
| 400 W Gettysburg Ave Apt 204A Clovis, CA | 2.0 | 1.0 | 904 | $1,600 | $1.77 | 46d | 1 | 0.95mi |
| 400 W Gettysburg Ave Unit 243A Clovis, CA | 2.0 | 1.0 | 904 | $1,500 | $1.66 | 5d | 1 | 0.95mi |
| 400 W Gettysburg Ave Unit 101A Clovis, CA | 2.0 | 1.0 | 904 | $1,580 | $1.75 | 25d | 1 | 0.95mi |
| 400 W Gettysburg Ave Unit 143A Clovis, CA | 2.0 | 1.0 | 904 | $1,650 | $1.83 | 23d | 1 | 0.95mi |
| 400 W Gettysburg Ave Unit 215B Clovis, CA | 2.0 | 2.0 | 994 | $1,780 | $1.79 | 46d | 1 | 0.95mi |
| 400 W Gettysburg Ave Apt 220A Clovis, CA | 1.0 | 1.0 | 714 | $1,350 | $1.89 | 46d | 1 | 0.95mi |
| 1038 Tollhouse Rd Unit 1038 Clovis, CA | 2.0 | 1.5 | 1100 | $1,800 | $1.64 | 4d | 1 | 0.95mi |
| 1042 Adler Dr Clovis, CA | 2.0 | 1.5 | 1200 | $1,895 | $1.58 | 46d | 1 | 1.00mi |
| 434 W Stuart Ave Unit 2 Clovis, CA | 2.0 | 1.0 | 860 | $1,575 | $1.83 | 5d | 1 | 1.01mi |
| 700 Music Ave Unit 102 Clovis, CA | 2.0 | 1.5 | 950 | $1,675 | $1.76 | 46d | 1 | 1.06mi |
| 700 Music Ave Clovis, CA | 2.0 | 2.0 | 950 | $1,675 | $1.76 | 25d | 1 | 1.06mi |
| 251 Minnewawa Ave Clovis, CA | 2.0 | 1.5 | 1100 | $2,100 | $1.91 | 16d | 1 | 1.07mi |
| 2967 Terry Ave Clovis, CA | 3.0 | 1.5 | 1099 | $2,095 | $1.91 | 25d | 1 | 1.09mi |
| 2777 Willow Ave Clovis, CA | 1.0–2.0 | 1.0 | 812 | $1,769 | $2.18 | 3d | 8 | 1.17mi |
| 841 W San Gabriel Ave Clovis, CA | 3.0 | 2.0 | 1288 | $1,995 | $1.55 | 46d | 1 | 1.19mi |
| 360 Cole Ave Clovis, CA | 2.0 | 2.0 | 1224 | $1,600 | $1.31 | 46d | 1 | 1.20mi |
Listing history 33 events
-
2026-06-21days on market $94,750 Active 48 DOM
-
2026-06-18days on market $94,750 Active 45 DOM
-
2026-06-17days on market $94,750 Active 44 DOM
-
2026-06-16days on market $94,750 Active 43 DOM
-
2026-06-15days on market $94,750 Active 42 DOM
-
2026-06-13days on market $94,750 Active 40 DOM
-
2026-06-13days on market $94,750 Active 39 DOM
-
2026-06-10days on market $94,750 Active 37 DOM
-
2026-06-09days on market $94,750 Active 36 DOM
-
2026-06-08days on market $94,750 Active 35 DOM
-
2026-06-07days on market $94,750 Active 34 DOM
-
2026-06-05days on market $94,750 Active 31 DOM
-
2026-06-03days on market $94,750 Active 30 DOM
-
2026-06-02days on market $94,750 Active 29 DOM
-
2026-06-01days on market $94,750 Active 28 DOM
-
2026-05-31days on market $94,750 Active 27 DOM
-
2026-05-03$94,750 Active 427-char remark
-
2021-04-06price $66,000 66-char remark
Show marketing remark (66 chars)
This rejuvenated gem is priced to sell! Make an appointment today.
-
2021-03-31soldstatus $66,000 Sold 66-char remark
Show marketing remark (66 chars)
This rejuvenated gem is priced to sell! Make an appointment today.
-
2021-03-02status Backup 66-char remark
Show marketing remark (66 chars)
This rejuvenated gem is priced to sell! Make an appointment today.
-
2021-03-02price $72,000 66-char remark
Show marketing remark (66 chars)
This rejuvenated gem is priced to sell! Make an appointment today.
-
2021-02-28$72,000 Active 66-char remark
Show marketing remark (66 chars)
This rejuvenated gem is priced to sell! Make an appointment today.
-
2021-01-06$72,000 Active
-
2018-03-30price $48,900
-
2018-03-30soldstatus $49,000 Sold
-
2018-02-08status Pending
-
2018-02-08price $49,000
-
2018-01-30price $48,900
-
2018-01-30$48,900,000 Active
-
2003-07-08soldstatus $22,500
-
2003-06-24historical
-
2003-06-24price $26,500
-
2003-05-02$22,500
ⓘ Source: listings_history table (triggers on properties + properties_extension) + one-shot
backfill from property_details.listing_events for pre-trigger history.
Climate risk First Street
- Flood 1/10 Low FEMA zone X (unshaded) · 0% chance over 30 yrs
- Wildfire 1/10 Low
- Heat 8/10 Severe 6 d/yr ≥105°F today · 14 d/yr by 30 yrs out
- Wind 1/10 Low
- Air quality 10/10 Extreme 57 unhealthy d/yr today · 60 by 30 yrs out
Nearby sold comps map
Loading sold comps map…
Walkable amenities ~0.75 mi
Loading nearby amenities…
Taxation est. · year 1
- Rental income
- $20,162
- − Mortgage interest
- −$5,307
- − Property taxes
- −$1,421
- − Insurance
- −$474
- − Repairs & maintenance
- −$1,613
- − Management
- −$1,613
- − Depreciation
- −$2,756
- Taxable income
- $6,977
- Est. tax owed @ 24.0%
- −$1,674
- After-tax cash flow
- $6,396/yr
For passive investors: Depreciation is non-cash, so a rental often shows a tax loss while cash-flowing — sheltering income. Rental losses are passive: they offset passive income freely, and up to $25,000/yr can offset ordinary (W-2) income if you actively participate and your MAGI is under $100k (phasing out to $0 by $150k); unused losses carry forward. On sale, claimed depreciation is recaptured at up to 25%, and gains may owe capital-gains tax (a 1031 exchange can defer both). Figures are a year-1 estimate at your 24.0% rate — not tax advice; consult a CPA.
Schools (NCES district)
- District
- Clovis Unified
- NCES district ID
- 0609030
- Math proficiency
- 58% ▲ 1.00%
- Reading proficiency
- 72% ▲ 2.00%
- Median HH income
- $71,950
- Composite
- 58.7/100
- National rank
- #2003
- State rank
- #152 of 1400 in CA
Livability — Clovis
- Score
- 76/100
- State rank
- #92
- US rank
- #3307
Category grades
Schools grade is shown separately in the Schools card above.
Census & demographics
- Census place
- Clovis, CA
- County
- Fresno County · 834,801 people
- City population
- 139,989
- Metro
- Fresno, CA
- Population (ZIP)
- 37,755
- Household income
- $66,683
- Rent vs Own
- Severe rent burden
- 2487.0
Population outlook (Fresno County) Hauer SSP2
- Today (2025)
- 1,042,971 people
- By 2030
- 1,072,198 · +2.8%
- By 2040
- 1,122,408 · +7.6%
- By 2050
- 1,157,251 · +11.0%
- By 2075
- 1,182,575 · +13.4%
- By 2100
- 1,105,899 · +6.0%
Race, ethnicity, and origin ACS 2023
- Neighborhood character
- Diverse neighborhood (Simpson 0.65)
- Race & ethnicity
- Hispanic / Latino 41% White 41% Two or more races 18% Asian 12% Black 2% Native American 2%
- Hispanic origin (detail)
- Mexican 37%
- Common ancestry
- Slovak 2% Lithuanian 1% Italian 1%
- Foreign-born
- 12% · Canada, China, Vietnam
- Languages at home
- 73% English-only · Spanish 18% Other Asian/Pacific 4% Tagalog/Filipino 2%
Political lean MEDSL · Fresno
- 2024 margin
- Toss-up / Even · D 46.5% · R 50.9% · Other 2.6%
- 2008→2024 swing
- -6.5pp toward R · 2008: 2.1pp · 2024: -4.4pp
- All cycles
- 2024: R+4.4 2020: D+7.8 2016: D+3.9 2012: R+2.9 2008: D+2.1
Not yet ingested
- Civics
- —
Market trends
- HPI YoY
- ▼ -352.97%
- Current HPI
- 357.6089
- Rent YoY
- ▲ 2.65%
- Metro
- Fresno, CA
- State GDP YoY
- ▲ 3.21%
- F500 in state
- 116
Industry mix (Fortune 500 HQ in CA)
| Industry | F500 HQs | Revenue |
|---|---|---|
| Technology | 27 | $1,492B |
|
||
| Financial Services | 3 | $174B |
|
||
| Retail | 3 | $44B |
|
||
| Insurance | 3 | $26B |
|
||
| Media / Entertainment | 2 | $115B |
|
||
| Pharmaceuticals / Biotech | 2 | $62B |
|
||
Price history
+321.1% since first listed17 events — show timeline
- 2026-05-03 Listed $94,750 FRESNOMLS
- 2021-04-06 Price Changed $66,000 FRESNOMLS
- 2021-03-31 Sold (MLS) $66,000 FRESNOMLS
- 2021-03-02 Pending — FRESNOMLS
- 2021-03-02 Price Changed $72,000 FRESNOMLS
- 2021-02-28 Listed $72,000 FRESNOMLS
- 2021-01-06 Listed $72,000 FRESNOMLS
- 2018-03-30 Price Changed $48,900 FRESNOMLS
- 2018-03-30 Sold (MLS) $49,000 FRESNOMLS
- 2018-02-08 Pending — FRESNOMLS
- 2018-02-08 Price Changed $49,000 FRESNOMLS
- 2018-01-30 Price Changed $48,900 FRESNOMLS
- 2018-01-30 Listed $48,900,000 FRESNOMLS
- 2003-07-08 Sold (MLS) $22,500 FRESNOMLS
- 2003-06-24 Price Changed $26,500 FRESNOMLS
- 2003-06-24 Delisted — FRESNOMLS
- 2003-05-02 Listed $22,500 FRESNOMLS
Cash-flow waterfall
monthlySold comps — $/sqft
last 12 mo · ≤1 miLoading sold comps…