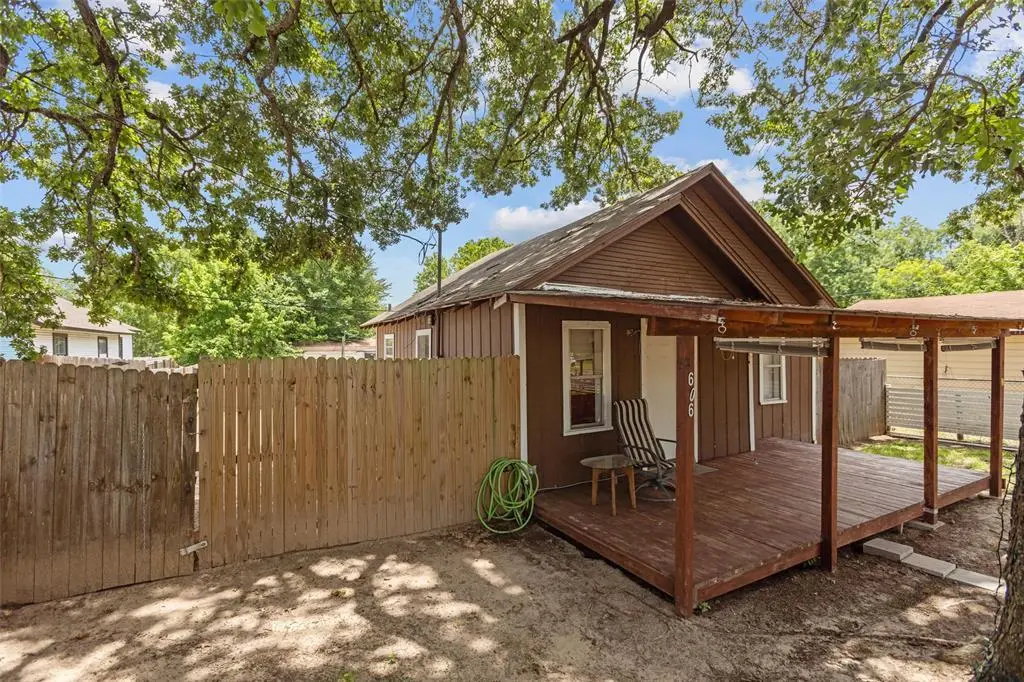
606 N Needmore St · Athens, TX
Flood risk 1/10 · Minimal
- FEMA flood zone
- X (unshaded)
- Chance of flooding over 30 yrs
- 0.0%
- Est. flood insurance / yr
- $507 – $1,088
Fire risk 4/10 · Minor
- Est. fire insurance / yr
- $1,222 – $2,270
Heat risk 7/10 · Major
- Hot days now (above 110°F)
- 7 days/yr
- Hot days in 30 yrs
- 26 days/yr
Wind risk 6/10 · Moderate
- Chance of severe wind over 30 yrs
- 64.0%
Air-quality risk 2/10 · Minimal
- Unhealthy air days now
- 0 days/yr
- Unhealthy air days in 30 yrs
- 1 days/yr
Risk factors via First Street. Map © Google.
Why this score? — see what drove the C+ grade
The composite is a weighted blend of 9 inputs, each scored 0–100. Each bar is that input's sub-score; the figure is the points it added to the 100-point composite (weight × sub-score).
- Cash flow +30.0/30.0
- 1% rule +10.0/10.0
- DSCR +10.0/10.0
- Livability +3.6/5.0
- Schools +2.9/10.0
- Rent growth +2.5/5.0
- Condition / age +2.5/5.0
- ARV discount +0.0/15.0
- Appreciation +0.0/10.0
$79,000
🖨 Deal sheet (PDF) 📄 Offer letter ✓ Due diligence
Listing remarks MLS
Charming 2 Bedroom 1 Bath Home tucked away in a tranquil and welcoming neighborhood. This move-in-ready home is perfect those looking to downsize or investment. Featuring a practical layout with recent interior paint, remodeled bathroom, and updated sink and cabinets in kitchen. The large fenced yard with front and back deck areas provide a serene outdoor retreat with majestic trees and ample space for outdoor activities and relaxation. Conveniently located near Trinity Valley Community College(TVCC), local medical facilities, dining, shopping with Cain Center(YMCA) and Cain Park nearby. Don't miss out on this affordable gem priced under 80K.
Key facts
- Remodeled bathroom
- Large fenced yard
- Front and back deck
Tags
Neighborhood map
What this means for you Summary
Snapshot
- This is a 2-bed/1.0-bath single-family listed at $79k.
Deal economics
- At list price, monthly cash flow is $494 ($6k/yr) — positive.
- The deal already cash-flows at list — no discount required.
- Meets the 1% rule at list price ($1k rent vs $79k).
- Recommended offer: $72k (9.0% below list) — sets the bar for market timing.
- Cap rate 13.8% vs local median 2.4% in Athens — top-decile yield for the area; either an underpriced asset or a hidden risk that comps aren't pricing in. Stress-test before assuming the spread holds.
Location & tenants
- Location reads 72/100 on livability (#241 in TX) — a middle-class / working-renter tenant base. Strengths: cost of living A+, health & safety A+, housing A; Watch: crime D+, amenities F, commute F.
- Athens ISD (town): math 34% / reading 34% proficiency, ranked #548 of 826 in TX (top 66%) — families likely to look elsewhere, expect single-tenant / working-renter base with shorter leases; 62% free/reduced lunch — lower-income household profile, screen leases tightly.
- Zoned schools: Central Athens (math 42% / reading 36%, grade F, #1,651 of 4,322 statewide, top 39%, 587 students, 76% FRL); Athens Middle (math 35% / reading 33%, grade F, #892 of 1,662 statewide, top 55%, 682 students, 80% FRL); Athens H S (math 24% / reading 34%, grade F, #1,147 of 1,632 statewide, top 71%, 928 students, 75% FRL) — zoned schools average 77% FRL vs 62% district-wide (15 pts higher); higher-poverty schools than district average — tighter screening recommended.
- Market conditions: 191 active listings in the ZIP; 3 comparable units currently listed for rent nearby; rentals at typical pace (median 15d on market — plan ~3-4 weeks tenant-placement turnaround); 263 units permitted in Henderson County in 2024 (0 in 5+ unit buildings).
Forward outlook
- Local home prices are declining (-3.0%/yr); year-one equity from $546 of loan paydown is wiped out by about $2k of value loss. Plan a longer hold.
- At projected returns (-3.0% appreciation + 3.0% rent growth), your $22k cash investment doubles in ~5 years — after that, you're playing with house money.
Negotiation context
- It's been on market 115 days — a 9% lower offer ($72k) is reasonable based on typical stale-listing flexibility.
- 6 sale attempts since 6y ago with the ask held roughly flat each time — persistent listings suggest the price (not the market) is what's stuck; bring a comps-based counter.
Risks & watch-outs
- Climate carrying-cost: major wind risk, 64% chance of damaging wind over 30y; extreme-heat days projected 7→26/yr by 2055 (HVAC capex compounding) — expect insurance premiums to compound above CPI over the hold.
Questions for the listing agent
- It's been on market 115 days. Have you received any prior offers? Is the seller open to a 9% concession, seller financing, or rate buy-down credit?
- Built in 1975 — when were the roof, HVAC, electrical panel, plumbing, and water heater last replaced?
- Why hasn't it sold? Are there any deal-killer items the seller is aware of (foundation, flood, title, zoning, code violations)?
- Is there a deadline driving the sale (1031 exchange, divorce, estate, relocation)? That informs how much negotiation room exists.
- Schools are D-rated, which usually means shorter tenancies and higher turnover. Who's the typical renter profile here, and what's been the actual vacancy rate?
- Crime grade is D in this area — have there been break-ins, vandalism, or insurance claims at this property in the last 3 years? What carrier currently insures it and at what premium?
- What's the average days-on-market for RENTAL listings here right now (not sales)? A rising rental-DOM trend means longer vacancies and softer asking-rent achievability than the comps imply.
- What's the recent tenant-quality profile in this submarket — average credit score on applications, eviction rate, late-payment / NSF rate, and stable-employment percentage? A property-management company in the area should have these aggregated.
- How much new for-sale + rental construction is in the pipeline within 1–3 miles? Heavy new supply typically softens prices + rents 12–24 months out; constrained supply supports both.
Investment metrics
- 1% rule
- 1.57% ✓
- Cap rate
- 13.79%
- Cash-on-cash
- 26.79%
- DSCR
- 2.19
- GRM
- 5.3
CMA / ARV
- ARV (median comp)
- $59,339
- List price
- $79,000
- Delta
- 33.13%
- Verdict
- OVERPRICED
- Comps
- 2 within 1.0 mi
Projected returns pro-forma
-3.0% appreciation · 3.0% rent growth · sell at horizon
- IRR
- 20.7%
- Equity multiple
- 1.84×
- Total profit
- $18,632
- Equity at exit
- $11,779
- IRR
- 28.8%
- Equity multiple
- 3.56×
- Total profit
- $56,651
- Equity at exit
- $6,830
Cash invested: $22,120 (down + closing). Projections, not guarantees.
Landlord ↔ Tenant lean methodology
- Overall (STATE)
- 87 Strongly Landlord-Friendly
- State Texas
- 87 Strongly Landlord-Friendly · R+5
- County
- — inherits STATE
- City
- — inherits STATE
ZIP-level market 75751
- Home prices YoY
- -33.1%
- Active inventory
- 191
- Price-to-rent
- 5.3×
Monthly cashflow live
- Estimated rent
- $1,242 medium interval (Pro) →
- Mortgage (P&I)
- −$414
- Tax from tax record
- −$40 /mo · $483/yr
- Insurance
- −$33
- HOA
- −$0
- Vacancy / Maint / Mgmt
- −$261
- Net cashflow
- $494
Break-even live
Sensitivity live
| Price | -10% $539 | -5% $516 | +0% $494 | +5% $471 | +10% $449 |
|---|---|---|---|---|---|
| Rent | -10% $396 | -5% $445 | +0% $494 | +5% $543 | +10% $592 |
| Rate | -1.0pp $534 | -0.5pp $514 | base $494 | +0.5pp $473 | +1.0pp $453 |
UW: 25.0% down · 7.5% · 30yr · 1.5% tax · 5.0% vac · 8.0% maint · 8.0% mgmt
Financing live
Cash to close
- Down payment
- $19,750
- Closing costs
- $2,370
- Reserves months
- —
- Total cash needed
- —
Loan-product check · same deal, 3 products live
Conventional
25% down · 7.5% · 30yr
- Down + closing
- —
- Monthly P&I
- —
- Monthly cashflow
- —
- DSCR
- —
- Eligible?
- —
Personal DTI + credit; lowest rate.
DSCR
20% down · 8.5% · 30yr
- Down + closing
- —
- Monthly P&I
- —
- Monthly cashflow
- —
- DSCR
- —
- Eligible?
- —
No personal income docs; deal must DSCR.
Hard money
10% down · 12.0% · 12mo
- Down + closing
- —
- Monthly P&I
- —
- Monthly cashflow
- —
- DSCR
- —
- Eligible?
- —
Short-term bridge; refi at stabilization.
Rent comps 3 comps
| Address | Beds | Baths | Sqft | Rent | $/sqft | DOM | Units | Dist |
|---|---|---|---|---|---|---|---|---|
| 215 Wood St Athens, TX | 1.0–2.0 | 1.0–2.0 | 762 | $1,520 | $1.99 | 15d | 4 | 0.84mi |
| 900 E Corsicana St Athens, TX | 2.0 | 1.0–2.0 | 767 | $1,339 | $1.74 | 15d | 6 | 0.89mi |
| 625 York St Unit B Athens, TX | 2.0 | 1.0 | 700 | $795 | $1.14 | 45d | 1 | 0.89mi |
Listing history 40 events
-
2026-06-21days on market $79,000 Active 115 DOM
-
2026-06-19days on market $79,000 Active 113 DOM
-
2026-06-18days on market $79,000 Active 112 DOM
-
2026-06-17days on market $79,000 Active 111 DOM
-
2026-06-16days on market $79,000 Active 110 DOM
-
2026-06-15days on market $79,000 Active 109 DOM
-
2026-06-14days on market $79,000 Active 107 DOM
-
2026-06-12days on market $79,000 Active 106 DOM
-
2026-06-09days on market $79,000 Active 103 DOM
-
2026-06-08days on market $79,000 Active 102 DOM
-
2026-06-07days on market $79,000 Active 101 DOM
-
2026-06-05days on market $79,000 Active 98 DOM
-
2026-06-03days on market $79,000 Active 97 DOM
-
2026-06-02days on market $79,000 Active 96 DOM
-
2026-06-01days on market $79,000 Active 95 DOM
-
2026-05-31days on market $79,000 Active 94 DOM
-
2026-05-30days on market $79,000 Active 93 DOM
-
2026-02-26$79,000 Active 650-char remark
Show marketing remark (650 chars)
Charming 2 Bedroom 1 Bath Home tucked away in a tranquil and welcoming neighborhood. This move-in-ready home is perfect those looking to downsize or investment. Featuring a practical layout with recent interior paint, remodeled bathroom, and updated sink and cabinets in kitchen. The large fenced yard with front and back deck areas provide a serene outdoor retreat with majestic trees and ample space for outdoor activities and relaxation. Conveniently located near Trinity Valley Community College(TVCC), local medical facilities, dining, shopping with Cain Center(YMCA) and Cain Park nearby. Don't miss out on this affordable gem priced under 80K.
-
2025-10-30historical
-
2025-09-05price $85,000
-
2025-06-28$95,000 Active
-
2022-08-12soldstatus Closed
-
2022-08-03soldstatus
-
2022-07-17status Pending
-
2022-07-05historical Active Option Contract
-
2022-06-27price $46,000
-
2022-06-20status Active
-
2022-06-15historical Active Option Contract
-
2022-06-10price $49,000
-
2022-05-25price $52,000
-
2022-05-02price $55,000
-
2022-03-18$60,000 Active
-
2022-03-08soldstatus Closed
-
2022-03-08soldstatus
-
2022-03-02status Pending
-
2022-02-22status Pending
-
2022-02-17$45,000 Active
-
2020-07-23soldstatus
-
2020-03-12$32,000
-
1985-12-01soldstatus
ⓘ Source: listings_history table (triggers on properties + properties_extension) + one-shot
backfill from property_details.listing_events for pre-trigger history.
Tax reassessment forecast TX · Resets to sale price
- Current annual tax
- $483 · $40/mo
- Projected year-2 tax
- $1,446 · $120/mo
- Expected delta
- +$963/yr (+$80/mo · 199.4%)
ⓘ Screening estimate from a state-policy table — verify with the county assessor before closing.
Climate risk First Street
- Flood 1/10 Low FEMA zone X (unshaded) · 0% chance over 30 yrs
- Wildfire 4/10 Moderate
- Heat 7/10 Severe 7 d/yr ≥110°F today · 26 d/yr by 30 yrs out
- Wind 6/10 Major 64% chance of damaging wind over 30 yrs
- Air quality 2/10 Low 0 unhealthy d/yr today · 1 by 30 yrs out
Nearby sold comps map
Loading sold comps map…
Walkable amenities ~0.75 mi
Loading nearby amenities…
Taxation est. · year 1
- Rental income
- $14,905
- − Mortgage interest
- −$4,425
- − Property taxes
- −$483
- − Insurance
- −$395
- − Repairs & maintenance
- −$1,192
- − Management
- −$1,192
- − Depreciation
- −$2,298
- Taxable income
- $4,919
- Est. tax owed @ 24.0%
- −$1,181
- After-tax cash flow
- $4,745/yr
For passive investors: Depreciation is non-cash, so a rental often shows a tax loss while cash-flowing — sheltering income. Rental losses are passive: they offset passive income freely, and up to $25,000/yr can offset ordinary (W-2) income if you actively participate and your MAGI is under $100k (phasing out to $0 by $150k); unused losses carry forward. On sale, claimed depreciation is recaptured at up to 25%, and gains may owe capital-gains tax (a 1031 exchange can defer both). Figures are a year-1 estimate at your 24.0% rate — not tax advice; consult a CPA.
Schools (NCES district)
- District
- Athens ISD
- NCES district ID
- 4808870
- Math proficiency
- 34% ▼ -9.00%
- Reading proficiency
- 34% ▼ -4.00%
- Median HH income
- $41,617
- Composite
- 28.73/100
- National rank
- #6680
- State rank
- #548 of 826 in TX
Livability — Athens
- Score
- 72/100
- State rank
- #241
- US rank
- #5796
Category grades
Schools grade is shown separately in the Schools card above.
Census & demographics
- Census place
- Athens, TX
- County
- Henderson County · 34,977 people
- City population
- 18,644
- Metro
- Athens, TX
- Population (ZIP)
- 18,644
- Household income
- $70,620
- Rent vs Own
- Severe rent burden
- 535.0
Population outlook (Henderson County) Hauer SSP2
- Today (2025)
- 80,471 people
- By 2030
- 80,608 · +0.2%
- By 2040
- 80,087 · -0.5%
- By 2050
- 78,208 · -2.8%
- By 2075
- 72,423 · -10.0%
- By 2100
- 61,012 · -24.2%
Race, ethnicity, and origin ACS 2023
- Neighborhood character
- Diverse neighborhood (Simpson 0.56)
- Race & ethnicity
- White 60% Hispanic / Latino 24% Two or more races 18% Black 10% Asian 2%
- Hispanic origin (detail)
- Mexican 22%
- Common ancestry
- Slovak 2% Romanian 1% Italian 1%
- Foreign-born
- 8% · Canada
- Languages at home
- 79% English-only · Spanish 19% Other Asian/Pacific 1%
Political lean MEDSL · Henderson
- 2024 margin
- Solid R (+63.5) · D 18.0% · R 81.4%
- 2008→2024 swing
- -18.8pp toward R · 2008: -44.6pp · 2024: -63.5pp
- All cycles
- 2024: R+63.5 2020: R+60.2 2016: R+60.0 2012: R+54.8 2008: R+44.6
Not yet ingested
- Civics
- —
Market trends
- HPI YoY
- ▼ -95.19%
- Current HPI
- 192.3973
- Rent YoY
- —
- Metro
- Athens, TX
- State GDP YoY
- ▲ 3.95%
- F500 in state
- 110
Industry mix (Fortune 500 HQ in TX)
| Industry | F500 HQs | Revenue |
|---|---|---|
| Energy | 16 | $1,198B |
|
||
| Technology | 5 | $198B |
|
||
| Engineering / Construction | 4 | $72B |
|
||
| Energy Services | 3 | $60B |
|
||
| Utilities | 3 | $41B |
|
||
| Healthcare | 2 | $330B |
|
||
Price history
+146.9% since first listed23 events — show timeline
- 2026-02-26 Listed $79,000 NTREIS
- 2025-10-30 Listing Removed — NTREIS
- 2025-09-05 Price Changed $85,000 NTREIS
- 2025-06-28 Listed $95,000 NTREIS
- 2022-08-12 Sold (MLS) — NTREIS
- 2022-08-03 Sold (Public Records) — Public Records
- 2022-07-17 Pending — NTREIS
- 2022-07-05 Contingent — NTREIS
- 2022-06-27 Price Changed $46,000 NTREIS
- 2022-06-20 Relisted — NTREIS
- 2022-06-15 Contingent — NTREIS
- 2022-06-10 Price Changed $49,000 NTREIS
- 2022-05-25 Price Changed $52,000 NTREIS
- 2022-05-02 Price Changed $55,000 NTREIS
- 2022-03-18 Listed $60,000 NTREIS
- 2022-03-08 Sold (Public Records) — Public Records
- 2022-03-08 Sold (MLS) — NTREIS
- 2022-03-02 Pending — NTREIS
- 2022-02-22 Pending — NTREIS
- 2022-02-17 Listed $45,000 NTREIS
- 2020-07-23 Sold (MLS) — HCBOR
- 2020-03-12 Listed $32,000 HCBOR
- 1985-12-01 Sold (Public Records) — Public Records
Property tax history
+4.3%/yrLatest (2025): $483 · +9.1% YoY. Source: county tax records.
Cash-flow waterfall
monthlySold comps — $/sqft
last 12 mo · ≤1 miLoading sold comps…