 🌊 Lakefront
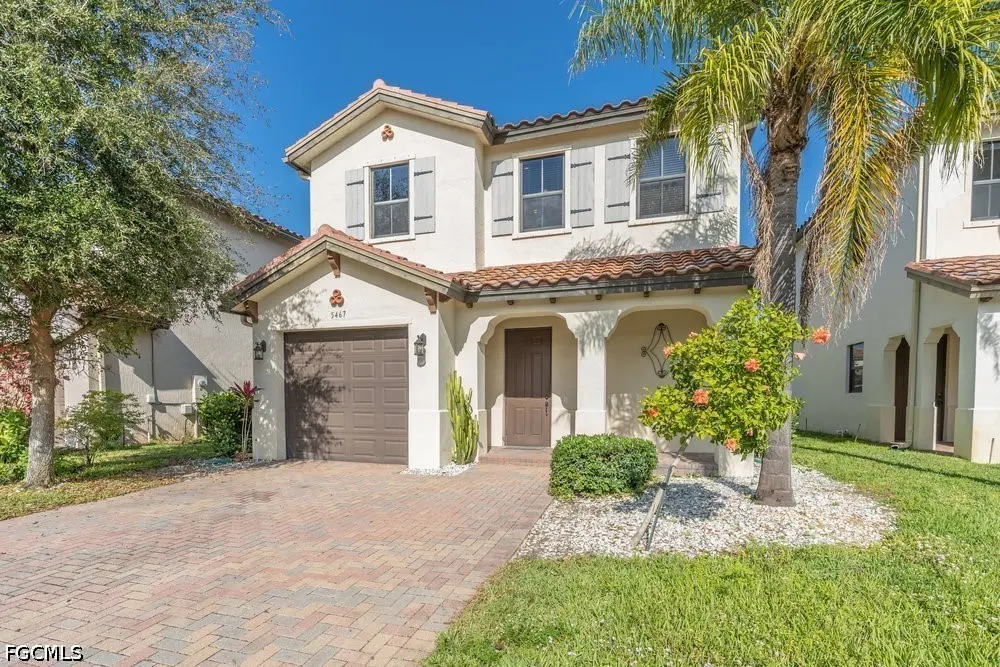
5467 Ferris Ave · Ave Maria, FL
Flood risk 1/10 · Minimal
- FEMA flood zone
- X (unshaded)
- Chance of flooding over 30 yrs
- 0.0%
- Est. flood insurance / yr
- $507 – $1,088
Fire risk 3/10 · Minor
- Est. fire insurance / yr
- $947 – $1,759
Heat risk 10/10 · Severe
- Hot days now (above 111°F)
- 7 days/yr
- Hot days in 30 yrs
- 28 days/yr
Wind risk 10/10 · Severe
- Chance of severe wind over 30 yrs
- 99.0%
Air-quality risk 2/10 · Minimal
- Unhealthy air days now
- 0 days/yr
- Unhealthy air days in 30 yrs
- 1 days/yr
Risk factors via First Street. Map © Google.
Why this score? — see what drove the B+ grade
The composite is a weighted blend of 9 inputs, each scored 0–100. Each bar is that input's sub-score; the figure is the points it added to the 100-point composite (weight × sub-score).
- Cash flow +30.0/30.0
- DSCR +10.0/10.0
- 1% rule +9.8/10.0
- ARV discount +7.5/15.0
- Schools +5.0/10.0
- Appreciation +4.5/10.0
- Rent growth +3.2/5.0
- Livability +2.5/5.0
- Condition / age +2.5/5.0
$315,000
🖨 Deal sheet 📄 Offer letter ✓ Due diligence
Listing remarks MLS
* * Priced below market value and waiting for its new owners! * * This stunning 2-story home offers 3 spacious bedrooms and 2.5 bathrooms, with a convenient upstairs laundry room and cozy carpeted flooring throughout the second level. Downstairs, enjoy a bright and open-concept kitchen that seamlessly flows into the living and dining areas perfect for entertaining with durable tile flooring throughout. Hurricane shutters are included. Located in a desirable lakefront community, residents enjoy * * 5-star amenities * * includes a resort-style pool, fully equipped fitness center, clubhouse, playground, walking trails, and more! Don’t miss the opportunity to live in comfort, style, and convenience. Schedule your private tour today! * Property is currently tenant occupied until Aug 19th, 2026. *
Key facts
- Natural preserves
- Fitness center
- Walk-in closet
Tags
Property features AI
Finance
- Other: No pet restrictions (pets allowed)
- HOA & community: Monthly association fee ($195); Community clubhouse; Community fitness center; Maintained community; Pickleball courts; Tennis courts
Exterior
- Parking: 1-car garage; Driveway (covered spaces: 1)
- Security: Smoke detectors
- Utilities: Public water; Public sewer; Cable available
- Home design: 2-story home; Faces west
- Construction: Block construction; Barrel roof; Resale property
- Exterior features: Storm/security shutters; Lakefront setting; Community pool
Interior
- Kitchen: Electric range; Dishwasher; Microwave; Garbage disposal; Refrigerator
- Flooring: Carpet; Tile
- Bathrooms: 2 full bathrooms; 1 half bathroom
- Heating & cooling: Central heating; Central air conditioning; Ceiling fans
- Interior features: First-floor entry; Upper-level primary bedroom
- Laundry & utility: Washer; Dryer
Neighborhood map
What this means for you Summary
Snapshot
- This is a 3-bed/2.5-bath single-family listed at $315k.
Deal economics
- At list price, monthly cash flow is $1k ($15k/yr) — positive.
- The deal already cash-flows at list — no discount required.
- Meets the 1% rule at list price ($5k rent vs $315k).
- Recommended offer: $277k (12.0% below list) — sets the bar for market timing.
Location & tenants
- Location reads: area grade B — affects rentability + tenant quality, not the cash-flow math above.
- Collier (suburban): math 60% / reading 56% proficiency, ranked #16 of 73 in FL (top 22%) — acceptable for families but not a draw, mixed tenant base, ~2y average lease.
- Market conditions: Rents rising (+3.0%/yr); 449 active listings in the ZIP; 13 comparable units currently listed for rent nearby; rentals at typical pace (median 24d on market — plan ~3-4 weeks tenant-placement turnaround); 3,520 units permitted in Collier County in 2024 (959 in 5+ unit buildings).
- At $4,656/mo this rent would consume 90% of the median local household income ($62k/yr) (locally 1093% of renters already pay >50% of income on rent) — very limited rent-growth headroom before tenants either downsize or default.
Forward outlook
- Local home prices are declining (-1.1%/yr); year-one equity from $2k of loan paydown is wiped out by about $3k of value loss. Plan a longer hold.
- Collier County population projected at +30% by 2050 — long-run rental-demand tailwind backs the buy-and-hold thesis.
- At projected returns (-1.1% appreciation + 3.0% rent growth), your $88k cash investment doubles in ~6 years — after that, you're playing with house money.
Negotiation context
- It's been on market 371 days — a 12% lower offer ($277k) is reasonable based on typical stale-listing flexibility.
- 7 sale attempts since 2y ago with the ask held roughly flat each time — persistent listings suggest the price (not the market) is what's stuck; bring a comps-based counter.
Risks & watch-outs
- Climate carrying-cost: severe wind risk, 99% chance of damaging wind over 30y; extreme-heat days projected 7→28/yr by 2055 (HVAC capex compounding) — expect insurance premiums to compound above CPI over the hold.
Questions for the listing agent
- It's been on market 371 days. Have you received any prior offers? Is the seller open to a 12% concession, seller financing, or rate buy-down credit?
- What does the HOA fee cover, when was the last increase, and are there any pending special assessments or reserve-fund shortfalls?
- Why hasn't it sold? Are there any deal-killer items the seller is aware of (foundation, flood, title, zoning, code violations)?
- Is there a deadline driving the sale (1031 exchange, divorce, estate, relocation)? That informs how much negotiation room exists.
- This sits on a lake — are riparian / water-frontage rights deeded with the parcel? Any dock permits, shoreline easements, or HOA water-use restrictions?
- What's the documented flood / surge / shoreline-erosion history here (FEMA AND non-FEMA — e.g., storm surge, creek backup, septic-field saturation)?
- Any water-quality or seasonal algae-bloom issues that affect tenant satisfaction or short-term-rental demand?
- What's the average days-on-market for RENTAL listings here right now (not sales)? A rising rental-DOM trend means longer vacancies and softer asking-rent achievability than the comps imply.
- What's the recent tenant-quality profile in this submarket — average credit score on applications, eviction rate, late-payment / NSF rate, and stable-employment percentage? A property-management company in the area should have these aggregated.
- How much new for-sale + rental construction is in the pipeline within 1–3 miles? Heavy new supply typically softens prices + rents 12–24 months out; constrained supply supports both.
Investment metrics
- 1% rule
- 1.48% ✓
- Cap rate
- 11.05%
- Cash-on-cash
- 16.98%
- DSCR
- 1.76
- GRM
- 5.6
CMA / ARV
No comps found within radius.
Projected returns pro-forma
-1.05% appreciation · 2.95% rent growth · sell at horizon
- IRR
- 13.8%
- Equity multiple
- 1.62×
- Total profit
- $55,078
- Equity at exit
- $75,309
- IRR
- 19.8%
- Equity multiple
- 2.99×
- Total profit
- $175,228
- Equity at exit
- $78,460
Cash invested: $88,200 (down + closing). Projections, not guarantees.
Landlord ↔ Tenant lean methodology
- Overall (STATE)
- 87 Strongly Landlord-Friendly
- State Florida
- 87 Strongly Landlord-Friendly · R+3
- County
- — inherits STATE
- City
- — inherits STATE
ZIP-level market 34142
- Home prices YoY
- -0.5%
- Rents YoY
- 3.0%
- Active inventory
- 449
- Price-to-rent
- 5.6×
Monthly cashflow live
- Estimated rent
- $4,656 high interval (Pro) →
- Mortgage (P&I)
- −$1,652
- Tax from tax record
- −$452 /mo · $5,429/yr
- Insurance
- −$131
- HOA
- −$195
- Vacancy / Maint / Mgmt
- −$978
- Net cashflow
- $1,248
Break-even live
UW: 25.0% down · 7.5% · 30yr · 1.5% tax · 5.0% vac · 8.0% maint · 8.0% mgmt
Financing live
Cash to close
- Down payment
- $78,750
- Closing costs
- $9,450
- Reserves months
- —
- Total cash needed
- —
Loan-product check · same deal, 3 products live
Conventional
25% down · 7.5% · 30yr
- Down + closing
- —
- Monthly P&I
- —
- Monthly cashflow
- —
- DSCR
- —
- Eligible?
- —
Personal DTI + credit; lowest rate.
DSCR
20% down · 8.5% · 30yr
- Down + closing
- —
- Monthly P&I
- —
- Monthly cashflow
- —
- DSCR
- —
- Eligible?
- —
No personal income docs; deal must DSCR.
Hard money
10% down · 12.0% · 12mo
- Down + closing
- —
- Monthly P&I
- —
- Monthly cashflow
- —
- DSCR
- —
- Eligible?
- —
Short-term bridge; refi at stabilization.
Rent comps 13 comps
| Address | Beds | Baths | Sqft | Rent | $/sqft | DOM | Units | Dist |
|---|---|---|---|---|---|---|---|---|
| 5360 Brin Way Ave Maria, FL | 4.0 | 2.5 | 1088 | $2,495 | $2.29 | 23d | 1 | 0.04mi |
| 5527 Double Eagle Cir Unit 3815 Ave Maria, FL | 2.0 | 2.0 | 1120 | $5,795 | $5.17 | 23d | 1 | 0.77mi |
| 5555 Double Eagle Cir #3914 Ave Maria, FL | 2.0 | 2.0 | 1120 | $5,795 | $5.17 | 23d | 1 | 0.83mi |
| 5583 Double Eagle Cir Unit 4143 Ave Maria, FL | 2.0 | 2.0 | 1120 | $5,795 | $5.17 | 23d | 1 | 0.90mi |
| 5583 Double Eagle Cir #4135 Ave Maria, FL | 2.0 | 2.0 | 1120 | $2,195 | $1.96 | 23d | 1 | 0.90mi |
| 5629 Double Eagle Cir Ave Maria, FL | 2.0 | 2.0 | 1120 | $5,495 | $4.91 | 23d | 1 | 0.95mi |
| 5835 Double Eagle CIR #4714 Ave Maria, FL | 2.0 | 2.0 | 1120 | $1,895 | $1.69 | 23d | 1 | 0.97mi |
| 5715 Double Eagle Cir Ave Maria, FL | 2.0 | 2.0 | 1120 | $3,295 | $2.94 | 23d | 1 | 1.03mi |
| 5807 Double Eagle Cir #4635 Ave Maria, FL | 2.0 | 2.0 | 1120 | $5,195 | $4.64 | 23d | 1 | 1.04mi |
| 5749 Double Eagle Cir #4515 Ave Maria, FL | 2.0 | 2.0 | 1120 | $1,995 | $1.78 | 21d | 1 | 1.05mi |
| 6058 National Blvd Ave Maria, FL | 2.0–3.0 | 2.0 | 1210 | $5,795 | $4.79 | 23d | 2 | 1.11mi |
| 6058 National Blvd #335 Ave Maria, FL | 2.0 | 2.0 | 1120 | $5,795 | $5.17 | 13d | 1 | 1.11mi |
| 6034 National Blvd Ave Maria, FL | 2.0 | 2.0 | 1137 | $4,046 | $3.56 | 13d | 3 | 1.13mi |
HOA detail
- Monthly dues
- $195 · $2,340/yr
- Likely covers
- poolgym
Listing history 33 events
-
2026-06-18days on market $315,000 Active 371 DOM
-
2026-06-17days on market $315,000 Active 370 DOM
-
2026-06-16days on market $315,000 Active 369 DOM
-
2026-06-15days on market $315,000 Active 368 DOM
-
2026-06-10days on market $315,000 Active 363 DOM
-
2026-06-09days on market $315,000 Active 362 DOM
-
2026-06-08days on market $315,000 Active 361 DOM
-
2026-06-07days on market $315,000 Active 360 DOM
-
2026-06-02days on market $315,000 Active 355 DOM
-
2026-06-01days on market $315,000 Active 354 DOM
-
2026-05-31days on market $315,000 Active 353 DOM
-
2026-05-30days on market $315,000 Active 352 DOM
-
2026-05-11$315,000 Active 817-char remark
Show marketing remark (817 chars)
* * Priced below market value and waiting for its new owners! * * This stunning 2-story home offers 3 spacious bedrooms and 2.5 bathrooms, with a convenient upstairs laundry room and cozy carpeted flooring throughout the second level. Downstairs, enjoy a bright and open-concept kitchen that seamlessly flows into the living and dining areas perfect for entertaining with durable tile flooring throughout. Hurricane shutters are included. Located in a desirable lakefront community, residents enjoy * * 5-star amenities * * includes a resort-style pool, fully equipped fitness center, clubhouse, playground, walking trails, and more! Don’t miss the opportunity to live in comfort, style, and convenience. Schedule your private tour today! * Property is currently tenant occupied until Aug 19th, 2026. *
-
2026-03-28status Active
-
2026-02-23historical Active Under Contract
-
2026-02-12historical
-
2026-01-31price $315,000
-
2025-08-14historical $2,200
-
2025-07-25$2,200
-
2025-07-15price $355,000
-
2025-07-10price $364,900
-
2025-06-19price $365,000
-
2025-06-17price $370,000
-
2025-06-12$370,000 Active
-
2025-06-12historical
-
2025-06-08price $379,000
-
2025-05-21price $379,900
-
2025-05-13price $379,900
-
2025-04-03$399,000 Active
-
2025-02-13$399,000 Active
-
2024-07-09historical $2,300
-
2024-06-18price $2,300
-
2024-06-05$2,400
ⓘ Source: listings_history table (triggers on properties + properties_extension) + one-shot
backfill from property_details.listing_events for pre-trigger history.
Tax reassessment forecast FL · Resets to sale price
- Current annual tax
- $5,429 · $452/mo
- Projected year-2 tax
- $5,429 · $452/mo
- Expected delta
- $0/yr ($0/mo · 0.0%)
ⓘ Screening estimate from a state-policy table — verify with the county assessor before closing.
Climate risk First Street
- Flood 1/10 Low FEMA zone X (unshaded) · 0% chance over 30 yrs
- Wildfire 3/10 Moderate
- Heat 10/10 Extreme 7 d/yr ≥111°F today · 28 d/yr by 30 yrs out
- Wind 10/10 Extreme 99% chance of damaging wind over 30 yrs
- Air quality 2/10 Low 0 unhealthy d/yr today · 1 by 30 yrs out
Nearby sold comps map
Loading sold comps map…
Walkable amenities ~0.75 mi
Loading nearby amenities…
Taxation est. · year 1
- Rental income
- $55,878
- − Mortgage interest
- −$17,645
- − Property taxes
- −$5,429
- − Insurance
- −$1,575
- − Repairs & maintenance
- −$4,470
- − Management
- −$4,470
- − HOA
- −$2,340
- − Depreciation
- −$9,164
- Taxable income
- $10,785
- Est. tax owed @ 24.0%
- −$2,588
- After-tax cash flow
- $12,388/yr
For passive investors: Depreciation is non-cash, so a rental often shows a tax loss while cash-flowing — sheltering income. Rental losses are passive: they offset passive income freely, and up to $25,000/yr can offset ordinary (W-2) income if you actively participate and your MAGI is under $100k (phasing out to $0 by $150k); unused losses carry forward. On sale, claimed depreciation is recaptured at up to 25%, and gains may owe capital-gains tax (a 1031 exchange can defer both). Figures are a year-1 estimate at your 24.0% rate — not tax advice; consult a CPA.
Schools (NCES district)
- District
- Collier
- NCES district ID
- 1200330
- Math proficiency
- 60% ▼ -4.00%
- Reading proficiency
- 56% ▼ -2.00%
- Median HH income
- $58,275
- Composite
- 50.23/100
- National rank
- #1892
- State rank
- #16 of 73 in FL
Livability — Ave Maria
No livability data for this city. (Only ~50 U.S. cities are tracked.)
Census & demographics
- Census place
- Ave Maria, FL
- County
- Collier County · 396,295 people
- Metro
- Naples-Marco Island, FL
- Population (ZIP)
- 35,149
- Household income
- $62,333
- Rent vs Own
- Severe rent burden
- 1093.0
Population outlook (Collier County) Hauer SSP2
- Today (2025)
- 420,858 people
- By 2030
- 450,054 · +6.9%
- By 2040
- 502,232 · +19.3%
- By 2050
- 544,932 · +29.5%
- By 2075
- 627,203 · +49.0%
- By 2100
- 659,015 · +56.6%
Race, ethnicity, and origin ACS 2023
- Neighborhood character
- Majority Hispanic (63%)
- Race & ethnicity
- Hispanic / Latino 63% Two or more races 39% Black 19% White 16% Native American 7%
- Hispanic origin (detail)
- Mexican 43% Puerto Rican 3% Cuban 2% Dominican 1%
- Common ancestry
- Hispanic 8% Slovak 1% Serbian 1%
- Foreign-born
- 32% · Canada, Jamaica
- Languages at home
- 34% English-only · Spanish 53% French/Haitian/Cajun 12%
Political lean MEDSL · Collier
- 2024 margin
- Solid R (+33.1) · D 33.1% · R 66.2%
- 2008→2024 swing
- -10.6pp toward R · 2008: -22.5pp · 2024: -33.1pp
- All cycles
- 2024: R+33.1 2020: R+24.7 2016: R+26.0 2012: R+30.1 2008: R+22.5
Not yet ingested
- Civics
- —
Market trends
- HPI YoY
- ▼ -1.05%
- Current HPI
- 226.9105
- Rent YoY
- ▲ 2.95%
- Metro
- Naples-Marco Island, FL
- State GDP YoY
- ▲ 3.28%
- F500 in state
- 36
Industry mix (Fortune 500 HQ in FL)
| Industry | F500 HQs | Revenue |
|---|---|---|
| Industrial Technology | 2 | $29B |
|
||
| Insurance | 2 | $17B |
|
||
| Retail | 1 | $60B |
|
||
| Technology Distribution | 1 | $58B |
|
||
| Homebuilding | 1 | $35B |
|
||
| Technology Manufacturing | 1 | $35B |
|
||
Price history
+13025.0% since first listed21 events — show timeline
- 2026-05-11 Listed $315,000 FORTMLS
- 2026-03-28 Relisted — MARMLS
- 2026-02-23 Contingent — MARMLS
- 2026-02-12 Listing Removed — FORTMLS
- 2026-01-31 Price Changed $315,000 MARMLS
- 2025-08-14 Rental Removed $2,200 MARMLS
- 2025-07-25 Listed for Rent $2,200 MARMLS
- 2025-07-15 Price Changed $355,000 MARMLS
- 2025-07-10 Price Changed $364,900 MARMLS
- 2025-06-19 Price Changed $365,000 MARMLS
- 2025-06-17 Price Changed $370,000 FORTMLS
- 2025-06-12 Listing Removed — MARMLS
- 2025-06-12 Listed $370,000 MARMLS
- 2025-06-08 Price Changed $379,000 MARMLS
- 2025-05-21 Price Changed $379,900 FORTMLS
- 2025-05-13 Price Changed $379,900 MARMLS
- 2025-04-03 Listed $399,000 FORTMLS
- 2025-02-13 Listed $399,000 MARMLS
- 2024-07-09 Rental Removed $2,300 NAPLESMLS
- 2024-06-18 Price Changed $2,300 NAPLESMLS
- 2024-06-05 Listed for Rent $2,400 NAPLESMLS
Property tax history
+11.3%/yrLatest (2025): $5,429 · +7.0% YoY. Source: county tax records.
Cash-flow waterfall
monthlySold comps — $/sqft
last 12 mo · ≤1 miLoading sold comps…