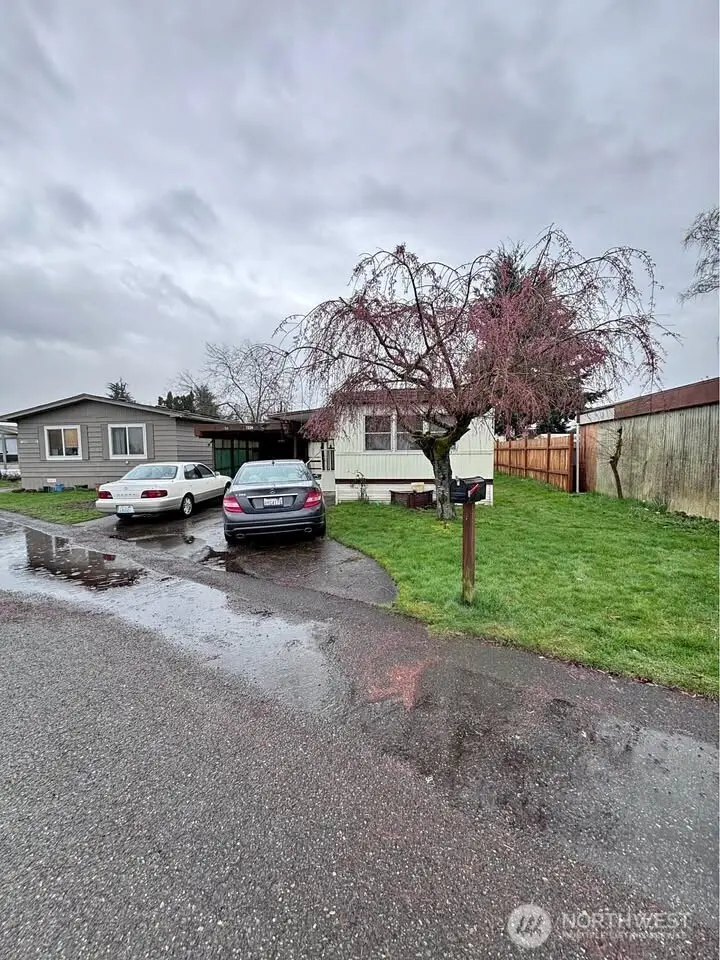
7224 48th Street Ct E #56 · Fife, WA
Flood risk 7/10 · Major
- FEMA flood zone
- X
- Chance of flooding over 30 yrs
- 0.76%
- Est. flood insurance / yr
- $507 – $1,088
Fire risk 1/10 · Minimal
- Est. fire insurance / yr
- $604 – $1,122
Heat risk 3/10 · Minor
- Hot days now (above 89°F)
- 7 days/yr
- Hot days in 30 yrs
- 16 days/yr
Wind risk 1/10 · Minimal
- Chance of severe wind over 30 yrs
- —
Air-quality risk 7/10 · Major
- Unhealthy air days now
- 11 days/yr
- Unhealthy air days in 30 yrs
- 12 days/yr
Risk factors via First Street. Map © Google.
Why this score? — see what drove the B+ grade
The composite is a weighted blend of 9 inputs, each scored 0–100. Each bar is that input's sub-score; the figure is the points it added to the 100-point composite (weight × sub-score).
- Cash flow +30.0/30.0
- ARV discount +15.0/15.0
- 1% rule +10.0/10.0
- DSCR +10.0/10.0
- Schools +5.4/10.0
- Livability +3.6/5.0
- Rent growth +2.6/5.0
- Condition / age +2.5/5.0
- Appreciation +0.0/10.0
$47,000
🖨 Deal sheet 📄 Offer letter ✓ Due diligence
Listing remarks
This home has been well maintained and recently updated with new carpet and Pergo flooring. New Kitchen counter and sink. Pellet stove helps greatly with rising utility costs. Why rent when you can own. Seller financing available ! Park allows pets with approval. Senior park and buyer must be approved prior to offer being accepted. Sits on a large lot and carport is built so you can stay dry in the pacific northwest! Large backyard and if that's not enough space for your garden, Fife's Levee Park is adjacent and this house looks out to the field of the grange. Community gardens are available thru the City of Fife at Levee park.
Key facts
- Large backyard
- Large lot
- Carport
Tags
Property features AI
Finance
- Financial info: Land lease: $1,030/month; Listing terms: Cash
- HOA & community: Located in a senior community; Park name: Adrena Gale; 61 homes in the park; RV parking available in the park; Park approved for sale; Pets allowed (see remarks)
Exterior
- Parking: Carport (storage location listed as carport)
- Utilities: Public water (park provides); Sewer provided by park; Electric service (Puget Sound Energy); Cable connected (Comcast)
- Home design: Manufactured single-wide home; One story; North-facing
- Construction: Metal skirt; Flat torch-down roof; Built with metal/vinyl materials; Foundation on pillars/posts/piers and slab
- Exterior features: Metal/vinyl exterior; Patio/porch/deck; Paved lot; View
Interior
- Kitchen: Dishwasher; Refrigerator; Stove/Range
- Bedrooms: 2 bedrooms
- Flooring: Laminate; Carpet
- Bathrooms: 1 full bathroom with tub and separate shower
- Heating & cooling: Forced air heating
- Interior features: Electric water heater with outside entrance; Pellet stove
- Laundry & utility: Washer; Dryer
Neighborhood map
What this means for you Summary
Snapshot
- This is a 2-bed/2.0-bath manufactured listed at $47k.
Deal economics
- At list price, monthly cash flow is $1k ($14k/yr) — positive.
- The deal already cash-flows at list — no discount required.
- Meets the 1% rule at list price ($2k rent vs $47k).
- Recommended offer: $46k (1.5% below list) — sets the bar for market timing.
- Cap rate 37.9% vs local median 2.8% in Fife — top-decile yield for the area; either an underpriced asset or a hidden risk that comps aren't pricing in. Stress-test before assuming the spread holds.
Location & tenants
- Location reads 71/100 on livability (#225 in WA) — a middle-class / working-renter tenant base. Strengths: commute A+, employment A+, housing A+; Watch: crime F, amenities D-, cost of living F.
- Puyallup School District (suburban): math 53% / reading 66% proficiency, ranked #52 of 291 in WA (top 18%) — acceptable for families but not a draw, mixed tenant base, ~2y average lease.
- Market conditions: Rents flat; 36 active listings in the ZIP; 5 comparable units currently listed for rent nearby; rentals leasing fast (median 10d on market — plan ~1-2 weeks tenant-placement turnaround); solid renter incomes; 3,209 units permitted in Pierce County in 2024 (1,269 in 5+ unit buildings).
Forward outlook
- Local home prices are declining (-3.0%/yr); year-one equity from $325 of loan paydown is wiped out by about $1k of value loss. Plan a longer hold.
- Pierce County population projected at +26% by 2050 — long-run rental-demand tailwind backs the buy-and-hold thesis.
- At projected returns (-3.0% appreciation + 0.4% rent growth), your $13k cash investment doubles in ~2 years — after that, you're playing with house money.
Negotiation context
- It's been on market 19 days — a 2% lower offer ($46k) is reasonable based on typical stale-listing flexibility.
Risks & watch-outs
- Watch-outs: flood insurance adds $66/mo.
- Climate carrying-cost: major flood risk — expect insurance premiums to compound above CPI over the hold.
Questions for the listing agent
- Built in 1974 — when were the roof, HVAC, electrical panel, plumbing, and water heater last replaced?
- What's the actual annual flood-insurance premium (NFIP or private), and is the property in a SFHA with mandatory coverage?
- Is there a deadline driving the sale (1031 exchange, divorce, estate, relocation)? That informs how much negotiation room exists.
- Schools are B-rated — typically a magnet for longer-tenancy family renters. What's the average tenant stay here, and is there a school-zone premium baked into asking?
- Crime grade is F in this area — have there been break-ins, vandalism, or insurance claims at this property in the last 3 years? What carrier currently insures it and at what premium?
- What's the average days-on-market for RENTAL listings here right now (not sales)? A rising rental-DOM trend means longer vacancies and softer asking-rent achievability than the comps imply.
- What's the recent tenant-quality profile in this submarket — average credit score on applications, eviction rate, late-payment / NSF rate, and stable-employment percentage? A property-management company in the area should have these aggregated.
- How much new for-sale + rental construction is in the pipeline within 1–3 miles? Heavy new supply typically softens prices + rents 12–24 months out; constrained supply supports both.
Investment metrics
- 1% rule
- 4.08% ✓
- Cap rate
- 37.93%
- Cash-on-cash
- 112.97%
- DSCR
- 6.03
- GRM
- 2.0
CMA / ARV
- ARV (on-the-fly)
- $62,342
- Comps found
- 5
Show comp detail 5 sales within ~0.75 mi
| Address | Dist | Beds/Ba | Sqft | Sold | Price | $/sf | Match |
|---|---|---|---|---|---|---|---|
| 7102 49th St E #3 | 0.13mi | 2/2.0 | 924 (+8%) | 5mo | $95,000 | $103 | 76 |
| 7220 53rd Street Ct E #44 | 0.33mi | 2/1.0 | 784 (-8%) | 8mo | $45,000 | $57 | 60 |
| 5314 69th Avenue Ct E #39 | 0.38mi | 2/1.0 | 744 (-13%) | 1mo | $54,500 | $73 | 56 |
| 5219 71st Avenue Ct E #26 | 0.30mi | 2/1.0 | 960 (+12%) | 20mo | $70,000 | $73 | 44 |
| 8105 52nd St E | 0.57mi | 2/1.0 | 957 (+12%) | 10mo | $320,000 | $334 | 41 |
Match score weights: distance 35% · size 25% · config 20% · recency 20%. Top-matched comps best support the ARV.
Projected returns pro-forma
-3.0% appreciation · 0.42% rent growth · sell at horizon
- IRR
- —
- Equity multiple
- 5.73×
- Total profit
- $62,249
- Equity at exit
- $7,008
- IRR
- —
- Equity multiple
- 11.00×
- Total profit
- $131,617
- Equity at exit
- $4,064
Cash invested: $13,160 (down + closing). Projections, not guarantees.
Landlord ↔ Tenant lean methodology
- Overall (STATE)
- 28 Tenant-Leaning
- State Washington
- 28 Tenant-Leaning · D+8
- County
- — inherits STATE
- City
- — inherits STATE
ZIP-level market 98424
- Home prices YoY
- -17.8%
- Rents YoY
- 0.4%
- Active inventory
- 36
- Price-to-rent
- 2.0×
Monthly cashflow live
- Estimated rent
- $1,917 high interval (Pro) →
- Mortgage (P&I)
- −$246
- Tax from tax record
- −$10 /mo · $116/yr
- Insurance
- −$20
- Flood insurance flood zone
- −$66 /mo · $798/yr
- HOA
- −$0
- Vacancy / Maint / Mgmt
- −$403
- Net cashflow
- $1,173
Break-even live
UW: 25.0% down · 7.5% · 30yr · 1.5% tax · 5.0% vac · 8.0% maint · 8.0% mgmt
Financing live
Cash to close
- Down payment
- $11,750
- Closing costs
- $1,410
- Reserves months
- —
- Total cash needed
- —
Loan-product check · same deal, 3 products live
Conventional
25% down · 7.5% · 30yr
- Down + closing
- —
- Monthly P&I
- —
- Monthly cashflow
- —
- DSCR
- —
- Eligible?
- —
Personal DTI + credit; lowest rate.
DSCR
20% down · 8.5% · 30yr
- Down + closing
- —
- Monthly P&I
- —
- Monthly cashflow
- —
- DSCR
- —
- Eligible?
- —
No personal income docs; deal must DSCR.
Hard money
10% down · 12.0% · 12mo
- Down + closing
- —
- Monthly P&I
- —
- Monthly cashflow
- —
- DSCR
- —
- Eligible?
- —
Short-term bridge; refi at stabilization.
Rent comps 5 comps
| Address | Beds | Baths | Sqft | Rent | $/sqft | DOM | Units | Dist |
|---|---|---|---|---|---|---|---|---|
| 8009 50th St E Fife, WA | 2.0 | 1.0 | 1100 | $2,150 | $1.95 | 17d | 1 | 0.49mi |
| 1503 18th St NW Unit C301 Puyallup, WA | 1.0 | 1.0 | 740 | $1,630 | $2.20 | 43d | 1 | 0.91mi |
| 1503 18th St NW Puyallup, WA | 1.0–2.0 | 1.0 | 840 | $1,730 | $2.06 | 10d | 4 | 0.92mi |
| 3351 70th Ave E Fife, WA | 1.0–3.0 | 1.0–2.0 | 950 | $2,199 | $2.31 | 1d | 12 | 0.93mi |
| 2715 62nd Ave E Fife, WA | 1.0–2.0 | 1.0–2.0 | 951 | $2,175 | $2.29 | 3d | 6 | 1.45mi |
Listing history 15 events
-
2026-06-18days on market $47,000 Active 19 DOM
-
2026-06-17days on market $47,000 Active 18 DOM
-
2026-06-16days on market $47,000 Active 17 DOM
-
2026-06-15days on market $47,000 Active 16 DOM
-
2026-06-13days on market $47,000 Active 14 DOM
-
2026-06-13days on market $47,000 Active 13 DOM
-
2026-06-09days on market $47,000 Active 10 DOM
-
2026-06-08days on market $47,000 Active 9 DOM
-
2026-06-07days on market $47,000 Active 8 DOM
-
2026-06-04days on market $47,000 Active 5 DOM
-
2026-06-03days on market $47,000 Active 4 DOM
-
2026-06-02days on market $47,000 Active 3 DOM
-
2026-06-01days on market $47,000 Active 2 DOM
-
2026-06-01remarks 639-char remark
-
2026-06-01$47,000 Active 1 DOM
ⓘ Source: listings_history table (triggers on properties + properties_extension) + one-shot
backfill from property_details.listing_events for pre-trigger history.
Tax reassessment forecast WA · Resets to sale price
- Current annual tax
- $116 · $10/mo
- Projected year-2 tax
- $461 · $38/mo
- Expected delta
- +$345/yr (+$29/mo · 298.3%)
ⓘ Screening estimate from a state-policy table — verify with the county assessor before closing.
Climate risk First Street
- Flood 7/10 Severe FEMA zone X · 76% chance over 30 yrs
- Wildfire 1/10 Low
- Heat 3/10 Moderate 7 d/yr ≥89°F today · 16 d/yr by 30 yrs out
- Wind 1/10 Low
- Air quality 7/10 Severe 11 unhealthy d/yr today · 12 by 30 yrs out
Nearby sold comps map
Loading sold comps map…
Walkable amenities ~0.75 mi
Loading nearby amenities…
Taxation est. · year 1
- Rental income
- $23,007
- − Mortgage interest
- −$2,633
- − Property taxes
- −$116
- − Insurance
- −$1,032
- − Repairs & maintenance
- −$1,841
- − Management
- −$1,841
- − Depreciation
- −$1,367
- Taxable income
- $14,178
- Est. tax owed @ 24.0%
- −$3,403
- After-tax cash flow
- $10,667/yr
For passive investors: Depreciation is non-cash, so a rental often shows a tax loss while cash-flowing — sheltering income. Rental losses are passive: they offset passive income freely, and up to $25,000/yr can offset ordinary (W-2) income if you actively participate and your MAGI is under $100k (phasing out to $0 by $150k); unused losses carry forward. On sale, claimed depreciation is recaptured at up to 25%, and gains may owe capital-gains tax (a 1031 exchange can defer both). Figures are a year-1 estimate at your 24.0% rate — not tax advice; consult a CPA.
Schools (NCES district)
- District
- Puyallup School District
- NCES district ID
- 5306960
- Math proficiency
- 53% ▬ 0.00%
- Reading proficiency
- 66% ▬ 0.00%
- Median HH income
- $68,291
- Composite
- 54.01/100
- National rank
- #3006
- State rank
- #52 of 291 in WA
Livability — Fife
- Score
- 71/100
- State rank
- #225
- US rank
- #6558
Category grades
Schools grade is shown separately in the Schools card above.
Census & demographics
- Census place
- Fife, WA
- County
- Pierce County · 788,257 people
- City population
- 11,816
- Metro
- Seattle-Tacoma-Bellevue, WA
- Population (ZIP)
- 11,816
- Household income
- $94,122
- Rent vs Own
- Severe rent burden
- 477.0
Population outlook (Pierce County) Hauer SSP2
- Today (2025)
- 956,648 people
- By 2030
- 1,010,862 · +5.7%
- By 2040
- 1,113,170 · +16.4%
- By 2050
- 1,206,524 · +26.1%
- By 2075
- 1,436,425 · +50.2%
- By 2100
- 1,563,654 · +63.5%
Race, ethnicity, and origin ACS 2023
- Neighborhood character
- Highly diverse neighborhood (Simpson 0.77)
- Race & ethnicity
- White 41% Hispanic / Latino 16% Asian 16% Two or more races 14% Black 10% Pacific Islander 8% Native American 2%
- Hispanic origin (detail)
- Mexican 11%
- Common ancestry
- Subsaharan African 3% Italian 2% Portuguese 2%
- Foreign-born
- 24% · Canada, South Korea, Vietnam
- Languages at home
- 66% English-only · Spanish 11% Russian/Polish/Slavic 5% Other Asian/Pacific 5%
Political lean MEDSL · Pierce
- 2024 margin
- D (+10.8) · D 53.9% · R 43.1% · Other 3.0%
- 2008→2024 swing
- -1.4pp toward R · 2008: 12.2pp · 2024: 10.8pp
- All cycles
- 2024: D+10.8 2020: D+11.2 2016: D+7.5 2012: D+11.0 2008: D+12.2
Not yet ingested
- Civics
- —
Market trends
- HPI YoY
- ▼ -68.76%
- Current HPI
- 317.8974
- Rent YoY
- ▲ 0.42%
- Metro
- Seattle-Tacoma-Bellevue, WA
- State GDP YoY
- ▲ 4.65%
- F500 in state
- 22
Industry mix (Fortune 500 HQ in WA)
| Industry | F500 HQs | Revenue |
|---|---|---|
| Retail | 2 | $269B |
|
||
| Technology / Retail | 1 | $638B |
|
||
| Technology | 1 | $245B |
|
||
| Telecommunications | 1 | $38B |
|
||
| Food / Beverage | 1 | $36B |
|
||
| Automotive / Trucks | 1 | $34B |
|
||
Price history
1 event — show timeline
- 2026-05-30 Listed $47,000 NWMLS as Distributed by MLS Grid
Property tax history
+5.4%/yrLatest (2026): $116 · -6.8% YoY. Source: county tax records.
Cash-flow waterfall
monthlySold comps — $/sqft
last 12 mo · ≤1 miLoading sold comps…