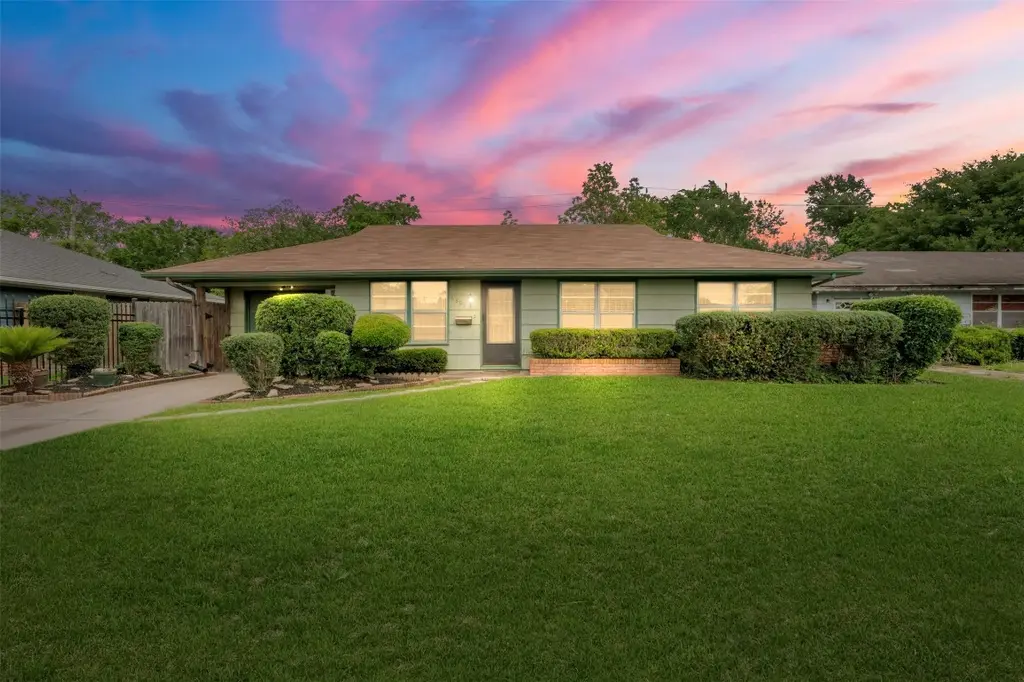
6807 Kingsway Dr · Houston, TX
Flood risk 3/10 · Minor
- FEMA flood zone
- X (unshaded)
- Chance of flooding over 30 yrs
- 0.2%
- Est. flood insurance / yr
- $507 – $1,088
Fire risk 1/10 · Minimal
- Est. fire insurance / yr
- $1,222 – $2,270
Heat risk 9/10 · Severe
- Hot days now (above 109°F)
- 7 days/yr
- Hot days in 30 yrs
- 25 days/yr
Wind risk 9/10 · Severe
- Chance of severe wind over 30 yrs
- 99.0%
Air-quality risk 2/10 · Minimal
- Unhealthy air days now
- 2 days/yr
- Unhealthy air days in 30 yrs
- 2 days/yr
Risk factors via First Street. Map © Google.
Why this score? — see what drove the D grade
The composite is a weighted blend of 9 inputs, each scored 0–100. Each bar is that input's sub-score; the figure is the points it added to the 100-point composite (weight × sub-score).
- ARV discount +14.6/15.0
- Cash flow +10.7/30.0
- Livability +3.7/5.0
- 1% rule +3.3/10.0
- DSCR +3.1/10.0
- Schools +2.7/10.0
- Rent growth +2.6/5.0
- Condition / age +2.5/5.0
- Appreciation +0.0/10.0
$175,000
🖨 Deal sheet (PDF) 📄 Offer letter ✓ Due diligence
Listing remarks
Lovely, preserved, move-in ready home nestled in the quiet Andover Place community. Single story, 3-bedroom, 1-bath, single-car attached garage, waiting for you to call this charming & serene house a home. The upkeep of the home is impeccable! Brand New PEX Pipes, New Roof & Fresh Paint throughout makes the home flawless! Front & back lawns are large, manicured & pristine with mature trees, great for family gatherings & barbecues, no back neighbors! Has a luxurious formal living room, spacious kitchen with numerous cabinets & pantries, hardwood floors & cozy carpeted bedrooms. Utility garage has a designated storage room & two customized, wood
Key facts
- Fresh paint
- Brand new pex pipes
- Formal living room
Tags
Property features AI
Finance
- HOA & community: Curbs
Exterior
- Parking: Attached garage (1 car); Driveway; Garage door opener
- Security: Prewired
- Utilities: Public water; Public sewer
- Home design: Residential property; Slab foundation; Composition roof; Built in 1957
- Construction: Vinyl siding; Wood siding
- Exterior features: Deck; Patio; Private yard; Fully fenced backyard; Paved driveway; Cleared lot; Backs to greenbelt/park; Side yard
Interior
- Kitchen: Free-standing range; Gas cooktop; Gas oven; Gas range; Oven; Refrigerator; ENERGY STAR qualified appliances
- Bedrooms: Primary bedroom on the first floor (14 x 11.5); Bedroom on the first floor (14 x 11); Bedroom on the first floor (13 x 11.5)
- Flooring: Carpet; Wood
- Bathrooms: 1 full bathroom
- Heating & cooling: Central heating (gas); Window unit(s) for cooling; Has heating and cooling
- Interior features: Pots & pan drawers; Pantry; Tile countertops; Window treatments; Ceiling fan(s); Kitchen/dining combo
- Laundry & utility: Washer hookup; Electric dryer hookup; Gas dryer hookup; Utility room on the first floor
Neighborhood map
What this means for you Summary
Snapshot
- This is a 3-bed/2.0-bath single-family listed at $175k.
Deal economics
- At list price, monthly cash flow is $-83 ($-999/yr) — negative.
- To cash-flow at today's rent, offer at most $160k (8.4% below list).
- To meet the 1% rule (rent ≥ 1% of price), the offer needs to be $146k (16.6% below list).
- Recommended offer: $146k (16.6% below list) — sets the bar for 1% rule.
- Cap rate 5.7% vs local median 3.2% in Houston — top-decile yield for the area; either an underpriced asset or a hidden risk that comps aren't pricing in. Stress-test before assuming the spread holds.
Location & tenants
- Location reads 74/100 on livability (#184 in TX, #4,771 nationally) — a middle-class / working-renter tenant base. Strengths: amenities A+, cost of living A+, housing A+; Watch: crime F.
- Houston ISD (urban): math 27% / reading 35% proficiency, ranked #593 of 826 in TX (top 72%) — families likely to look elsewhere, expect single-tenant / working-renter base with shorter leases; 71% free/reduced lunch — lower-income household profile, screen leases tightly.
- Zoned schools: Gregg El (math 32% / reading 32%, grade F, #2,268 of 4,322 statewide, top 55%, 373 students, 99% FRL); Hartman Middle (math 15% / reading 23%, grade F, #1,466 of 1,662 statewide, top 89%, 904 students, 96% FRL); Sterling H S (math 16% / reading 27%, grade F, #1,377 of 1,632 statewide, top 85%, 1,421 students, 92% FRL) — zoned schools average 96% FRL vs 71% district-wide (24 pts higher); higher-poverty schools than district average — tighter screening recommended.
- Market conditions: Rents flat; 84 active listings in the ZIP; 13 comparable units currently listed for rent nearby; rentals lingering (median 46d on market — plan ~5-8 weeks vacancy on turnover, expect pricing pressure); 62% of comp listings sitting > 30 days — soft ceiling on asking rent; 29,883 units permitted in Harris County in 2024 (8,621 in 5+ unit buildings).
- This rent runs 33% of the median local income ($53k/yr) — at the standard rent-burdened threshold; future hikes will face affordability resistance.
Forward outlook
- Local home prices are declining (-3.0%/yr); year-one equity from $1k of loan paydown is wiped out by about $5k of value loss. Plan a longer hold.
- Harris County population projected at +47% by 2050 — long-run rental-demand tailwind backs the buy-and-hold thesis.
Negotiation context
- It's been on market 58 days — a 3% lower offer ($170k) is reasonable based on typical stale-listing flexibility.
- 2 sale attempts; this cycle's ask has dropped $15k (8%) from the opening price — seller is motivated, your offer sets the floor, not the list.
Risks & watch-outs
- Watch-outs: built in 1957 — expect roof / HVAC / electrical / plumbing capex.
- Climate carrying-cost: severe wind risk, 99% chance of damaging wind over 30y; extreme-heat days projected 7→25/yr by 2055 (HVAC capex compounding) — expect insurance premiums to compound above CPI over the hold.
Questions for the listing agent
- What do current leases actually rent for vs. the listed asking? Can we see a recent rent roll and the last 12 months of T-12 income?
- It's been on market 58 days. Have you received any prior offers? Is the seller open to a 17% concession, seller financing, or rate buy-down credit?
- Built in 1957 — when were the roof, HVAC, electrical panel, plumbing, and water heater last replaced?
- Is there a deadline driving the sale (1031 exchange, divorce, estate, relocation)? That informs how much negotiation room exists.
- Schools are D-rated, which usually means shorter tenancies and higher turnover. Who's the typical renter profile here, and what's been the actual vacancy rate?
- Crime grade is F in this area — have there been break-ins, vandalism, or insurance claims at this property in the last 3 years? What carrier currently insures it and at what premium?
- The area grade is low — what's the realistic commute time and amenity access for the typical tenant pool here? Any planned neighborhood developments (good or bad) we should know about?
- What's the average days-on-market for RENTAL listings here right now (not sales)? A rising rental-DOM trend means longer vacancies and softer asking-rent achievability than the comps imply.
- What's the recent tenant-quality profile in this submarket — average credit score on applications, eviction rate, late-payment / NSF rate, and stable-employment percentage? A property-management company in the area should have these aggregated.
- How much new for-sale + rental construction is in the pipeline within 1–3 miles? Heavy new supply typically softens prices + rents 12–24 months out; constrained supply supports both.
Investment metrics
- 1% rule
- 0.83% ✗
- Cap rate
- 5.72%
- Cash-on-cash
- -2.04%
- DSCR
- 0.91
- GRM
- 10.0
CMA / ARV
- ARV (median comp)
- $207,724
- List price
- $175,000
- Delta
- -15.75%
- Verdict
- UNDERPRICED
- Comps
- 20 within 1.0 mi
Show comp detail 5 sales within ~0.75 mi
| Address | Dist | Beds/Ba | Sqft | Sold | Price | $/sf | Match |
|---|---|---|---|---|---|---|---|
| 6155 Andwood St | 0.30mi | 3/2.0 | 1,168 (+1%) | 22mo | $179,900 | $154 | 66 |
| 6722 Roxbury Rd | 0.19mi | 3/2.0 | 1,332 (+15%) | 3mo | $189,000 | $142 | 64 |
| 7168 Rook Blvd | 0.51mi | 3/1.0 | 1,064 (-8%) | 14mo | $103,000 | $97 | 47 |
| 6511 Belarbor St | 0.69mi | 4/2.0 (+1) | 1,258 (+8%) | 17mo | $214,900 | $171 | 34 |
| 5918 Lancaster St | 0.63mi | 2/1.0 (-1) | 1,004 (-14%) | 12mo | $160,000 | $159 | 29 |
Match score weights: distance 35% · size 25% · config 20% · recency 20%. Top-matched comps best support the ARV.
Projected returns pro-forma
-3.0% appreciation · 0.55% rent growth · sell at horizon
- IRR
- -22.5%
- Equity multiple
- 0.24×
- Total profit
- $-37,131
- Equity at exit
- $26,093
- IRR
- -24.6%
- Equity multiple
- -0.08×
- Total profit
- $-52,720
- Equity at exit
- $15,131
Cash invested: $49,000 (down + closing). Projections, not guarantees.
Landlord ↔ Tenant lean methodology
- Overall (STATE)
- 87 Strongly Landlord-Friendly
- State Texas
- 87 Strongly Landlord-Friendly · R+5
- County
- — inherits STATE
- City
- — inherits STATE
ZIP-level market 77087
- Home prices YoY
- -29.7%
- Rents YoY
- 0.6%
- Active inventory
- 84
- Price-to-rent
- 10.0×
Monthly cashflow live
- Estimated rent
- $1,459 high interval (Pro) →
- Mortgage (P&I)
- −$918
- Tax from tax record
- −$245 /mo · $2,941/yr
- Insurance
- −$73
- HOA
- −$0
- Vacancy / Maint / Mgmt
- −$306
- Net cashflow
- $-83
Break-even live
Sensitivity live
| Price | -10% $16 | -5% $-34 | +0% $-83 | +5% $-133 | +10% $-182 |
|---|---|---|---|---|---|
| Rent | -10% $-198 | -5% $-141 | +0% $-83 | +5% $-26 | +10% $32 |
| Rate | -1.0pp $5 | -0.5pp $-39 | base $-83 | +0.5pp $-129 | +1.0pp $-175 |
UW: 25.0% down · 7.5% · 30yr · 1.5% tax · 5.0% vac · 8.0% maint · 8.0% mgmt
Financing live
Cash to close
- Down payment
- $43,750
- Closing costs
- $5,250
- Reserves months
- —
- Total cash needed
- —
Loan-product check · same deal, 3 products live
Conventional
25% down · 7.5% · 30yr
- Down + closing
- —
- Monthly P&I
- —
- Monthly cashflow
- —
- DSCR
- —
- Eligible?
- —
Personal DTI + credit; lowest rate.
DSCR
20% down · 8.5% · 30yr
- Down + closing
- —
- Monthly P&I
- —
- Monthly cashflow
- —
- DSCR
- —
- Eligible?
- —
No personal income docs; deal must DSCR.
Hard money
10% down · 12.0% · 12mo
- Down + closing
- —
- Monthly P&I
- —
- Monthly cashflow
- —
- DSCR
- —
- Eligible?
- —
Short-term bridge; refi at stabilization.
Rent comps 13 comps
| Address | Beds | Baths | Sqft | Rent | $/sqft | DOM | Units | Dist |
|---|---|---|---|---|---|---|---|---|
| 6419 Belarbor St Houston, TX | 3.0 | 1.0 | 1240 | $1,425 | $1.15 | 45d | 1 | 0.72mi |
| 7623 Pecan Villas Dr Unit 7 Houston, TX | 2.0 | 1.0 | 800 | $1,050 | $1.31 | 45d | 1 | 1.22mi |
| 7615 Grahamcrest Dr Houston, TX | 1.0–2.0 | 1.0 | 778 | $1,095 | $1.41 | 1d | 8 | 1.23mi |
| 7952 Leonora St Houston, TX | 2.0 | 2.5 | 1300 | $1,350 | $1.04 | 45d | 1 | 1.25mi |
| 8100 Leonora St Houston, TX | 2.0–3.0 | 2.0–2.5 | 1575 | $1,400 | $0.89 | 45d | 3 | 1.27mi |
| 8100 Leonora St Houston, TX | 2.0–3.0 | 2.0–2.5 | 1575 | $1,400 | $0.89 | 21d | 2 | 1.27mi |
| 7901 Leonora St Houston, TX | 1.0–2.0 | 1.0 | 750 | $1,245 | $1.66 | 7d | 10 | 1.30mi |
| 3810 Weslow St Houston, TX | 2.0 | 1.0 | 924 | $1,449 | $1.57 | 45d | 1 | 1.31mi |
| 3810 Weslow St Unit B Houston, TX | 2.0 | 1.0 | 924 | $1,149 | $1.24 | 9d | 1 | 1.31mi |
| 5954 Doolittle Blvd Houston, TX | 3.0 | 2.0 | 1371 | $1,575 | $1.15 | 45d | 1 | 1.32mi |
| 8101 Leonora St Houston, TX | 1.0–2.0 | 1.0–2.0 | 975 | $1,300 | $1.33 | 4d | 4 | 1.36mi |
| 7437 Southway Dr Houston, TX | 2.0 | 1.0 | 714 | $920 | $1.29 | 45d | 1 | 1.37mi |
| 5942 Ridgeway Dr Houston, TX | 4.0 | 2.0 | 1490 | $2,250 | $1.51 | 45d | 1 | 1.42mi |
Listing history 16 events
-
2026-06-21days on market $175,000 Pending 58 DOM
-
2026-06-18days on market $175,000 Pending 55 DOM
-
2026-06-17days on market $175,000 Pending 54 DOM
-
2026-06-16days on market $175,000 Pending 53 DOM
-
2026-06-15status $175,000 Pending 52 DOM
-
2026-06-15days on market $175,000 Active 52 DOM
-
2026-06-13days on market $175,000 Active 50 DOM
-
2026-06-10days on market $175,000 Active 46 DOM
-
2026-06-08days on market $175,000 Active 45 DOM
-
2026-06-07pricestatusdays on market $175,000 Active 44 DOM
-
2026-06-04days on market $187,000 Pending 41 DOM
-
2026-06-01days on market $187,000 Pending 38 DOM
-
2026-05-31days on market $187,000 Pending 37 DOM
-
2026-05-07price $187,000 1040-char remark
-
2026-04-24$190,000 Active 1040-char remark
-
1988-01-02soldstatus
ⓘ Source: listings_history table (triggers on properties + properties_extension) + one-shot
backfill from property_details.listing_events for pre-trigger history.
Tax reassessment forecast TX · Resets to sale price
- Current annual tax
- $2,941 · $245/mo
- Projected year-2 tax
- $3,202 · $267/mo
- Expected delta
- +$261/yr (+$22/mo · 8.9%)
ⓘ Screening estimate from a state-policy table — verify with the county assessor before closing.
Climate risk First Street
- Flood 3/10 Moderate FEMA zone X (unshaded) · 20% chance over 30 yrs
- Wildfire 1/10 Low
- Heat 9/10 Extreme 7 d/yr ≥109°F today · 25 d/yr by 30 yrs out
- Wind 9/10 Extreme 99% chance of damaging wind over 30 yrs
- Air quality 2/10 Low 2 unhealthy d/yr today · 2 by 30 yrs out
Nearby sold comps map
Loading sold comps map…
Walkable amenities ~0.75 mi
Loading nearby amenities…
Taxation est. · year 1
- Rental income
- $17,506
- − Mortgage interest
- −$9,803
- − Property taxes
- −$2,941
- − Insurance
- −$875
- − Repairs & maintenance
- −$1,400
- − Management
- −$1,400
- − Depreciation
- −$5,091
- Taxable loss
- −$4,005
- Est. tax savings @ 24.0%
- +$961
- After-tax cash flow
- $-38/yr
For passive investors: Depreciation is non-cash, so a rental often shows a tax loss while cash-flowing — sheltering income. Rental losses are passive: they offset passive income freely, and up to $25,000/yr can offset ordinary (W-2) income if you actively participate and your MAGI is under $100k (phasing out to $0 by $150k); unused losses carry forward. On sale, claimed depreciation is recaptured at up to 25%, and gains may owe capital-gains tax (a 1031 exchange can defer both). Figures are a year-1 estimate at your 24.0% rate — not tax advice; consult a CPA.
Schools (NCES district)
- District
- Houston ISD
- NCES district ID
- 4823640
- Math proficiency
- 27% ▼ -18.00%
- Reading proficiency
- 35% ▼ -6.00%
- Median HH income
- $46,054
- Composite
- 26.63/100
- National rank
- #7173
- State rank
- #593 of 826 in TX
Livability — Houston
- Score
- 74/100
- State rank
- #184
- US rank
- #4771
Category grades
Schools grade is shown separately in the Schools card above.
Census & demographics
- Census place
- Houston, TX
- County
- Harris County · 4,702,590 people
- City population
- 3,226,434
- Metro
- Houston-The Woodlands-Sugar Land, TX
- Population (ZIP)
- 34,347
- Household income
- $52,847
- Rent vs Own
- Severe rent burden
- 1219.0
Population outlook (Harris County) Hauer SSP2
- Today (2025)
- 5,571,493 people
- By 2030
- 6,089,821 · +9.3%
- By 2040
- 7,142,806 · +28.2%
- By 2050
- 8,185,864 · +46.9%
- By 2075
- 10,574,329 · +89.8%
- By 2100
- 12,109,958 · +117.4%
Race, ethnicity, and origin ACS 2023
- Neighborhood character
- Predominantly Hispanic (78%)
- Race & ethnicity
- Hispanic / Latino 78% Two or more races 22% Black 16% White 5% Native American 2%
- Hispanic origin (detail)
- Mexican 64%
- Foreign-born
- 33% · Canada
- Languages at home
- 31% English-only · Spanish 69%
Political lean MEDSL · Harris
- 2024 margin
- Lean D (+5.5) · D 52.0% · R 46.4% · Other 1.6%
- 2008→2024 swing
- +3.9pp toward D · 2008: 1.6pp · 2024: 5.5pp
- All cycles
- 2024: D+5.5 2020: D+13.3 2016: D+12.4 2012: D+0.1 2008: D+1.6
Not yet ingested
- Civics
- —
Market trends
- HPI YoY
- ▼ -112.90%
- Current HPI
- 266.8467
- Rent YoY
- ▲ 0.55%
- Metro
- Houston-The Woodlands-Sugar Land, TX
- State GDP YoY
- ▲ 3.95%
- F500 in state
- 110
Industry mix (Fortune 500 HQ in TX)
| Industry | F500 HQs | Revenue |
|---|---|---|
| Energy | 16 | $1,198B |
|
||
| Technology | 5 | $198B |
|
||
| Engineering / Construction | 4 | $72B |
|
||
| Energy Services | 3 | $60B |
|
||
| Utilities | 3 | $41B |
|
||
| Healthcare | 2 | $330B |
|
||
Price history
-7.9% since first listed7 events — show timeline
- 2026-06-15 Pending — HARMLS
- 2026-06-04 Relisted — HARMLS
- 2026-06-04 Price Changed $175,000 HARMLS
- 2026-05-21 Pending — HARMLS
- 2026-05-07 Price Changed $187,000 HARMLS
- 2026-04-24 Listed $190,000 HARMLS
- 1988-01-02 Sold (Public Records) — Public Records
Property tax history
+6.1%/yrLatest (2025): $2,941 · +11.6% YoY. Source: county tax records.
Cash-flow waterfall
monthlySold comps — $/sqft
last 12 mo · ≤1 miLoading sold comps…