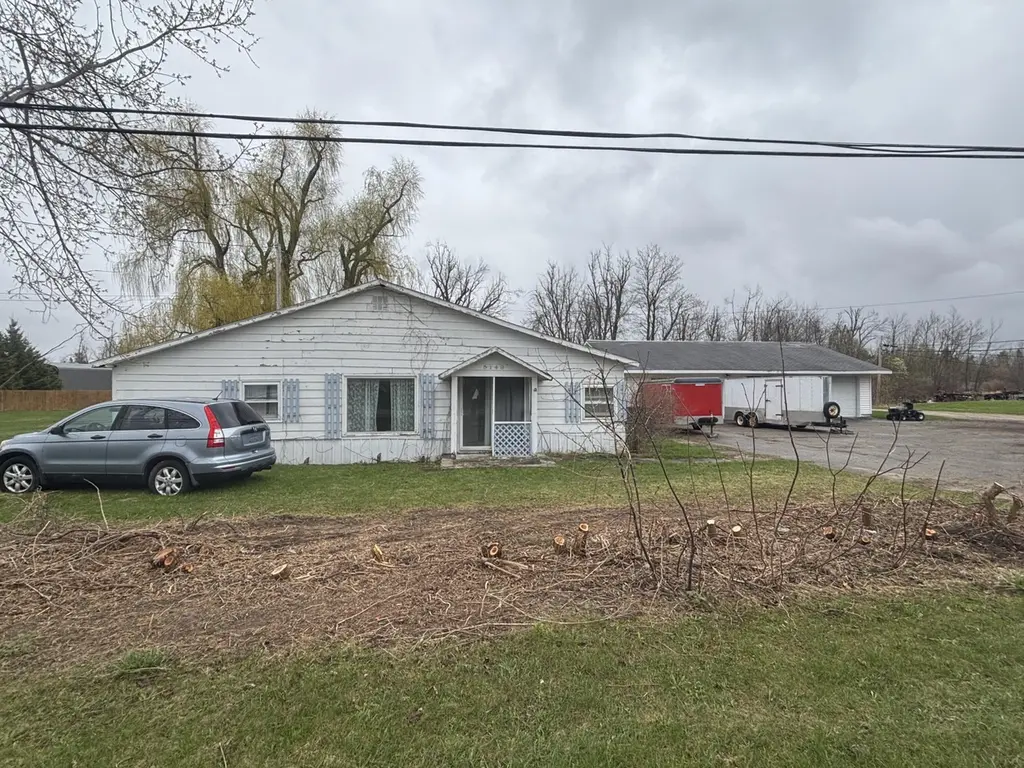
5149 Main St · Case, MI
Flood risk 1/10 · Minimal
- FEMA flood zone
- —
- Chance of flooding over 30 yrs
- 0.0%
- Est. flood insurance / yr
- —
Fire risk 4/10 · Minor
- Est. fire insurance / yr
- $784 – $1,456
Heat risk 1/10 · Minimal
- Hot days now (above 96°F)
- 7 days/yr
- Hot days in 30 yrs
- 13 days/yr
Wind risk 1/10 · Minimal
- Chance of severe wind over 30 yrs
- —
Air-quality risk 1/10 · Minimal
- Unhealthy air days now
- 0 days/yr
- Unhealthy air days in 30 yrs
- 0 days/yr
Risk factors via First Street. Map © Google.
Why this score? — see what drove the B+ grade
The composite is a weighted blend of 9 inputs, each scored 0–100. Each bar is that input's sub-score; the figure is the points it added to the 100-point composite (weight × sub-score).
- Cash flow +30.0/30.0
- ARV discount +15.0/15.0
- 1% rule +10.0/10.0
- DSCR +10.0/10.0
- Schools +2.8/10.0
- Rent growth +2.5/5.0
- Livability +2.5/5.0
- Condition / age +2.5/5.0
- Appreciation +0.0/10.0
$80,000
🖨 Deal sheet (PDF) 📄 Offer letter ✓ Due diligence
Listing remarks
Unique multi-lot opportunity on Main Street in Millersburg! This property includes three separate lots, each with its own driveway and structure--ideal for investment or multi-use living. The main home offers four bedrooms, a half bath, and spacious family, dining, and kitchen areas. A heated, insulated garage provides excellent potential for conversion into an apartment or guest quarters. A third smaller structure adds flexibility--renovate or remove for additional yard space. Perfect for rental income, multi-generational living, or a live/work setup. Endless potential in a convenient in-town location! Seller is motivated.
Key facts
- 0.54 acre lot
- 2 garage spots
- Built 1950
Property features AI
Exterior
- Parking: Detached heated garage; About 2.5 garage spaces
- Utilities: Public water; Septic sewer
- Home design: Single-family residence; Residential property
- Construction: Slab foundation
- Exterior features: Paved road access; Lot approximately 0.54 acres
Interior
- Bathrooms: One half bathroom
- Heating & cooling: Forced air heating; Natural gas heating
- Interior features: Crawl space basement; Deck
- Laundry & utility: Main-level laundry
Neighborhood map
What this means for you Summary
Snapshot
- This is a 4-bed/0.5-bath single-family listed at $80k.
Deal economics
- At list price, monthly cash flow is $501 ($6k/yr) — positive.
- The deal already cash-flows at list — no discount required.
- Meets the 1% rule at list price ($1k rent vs $80k).
- Recommended offer: $78k (3.0% below list) — sets the bar for market timing.
Location & tenants
- Location reads: area grade B — affects rentability + tenant quality, not the cash-flow math above.
- Onaway Area Community School District (rural): math 27% / reading 40% proficiency, ranked #328 of 540 in MI (top 61%) — families likely to look elsewhere, expect single-tenant / working-renter base with shorter leases.
- Zoned schools: Onaway Elementary School (math 32% / reading 32%, grade F, #814 of 1,397 statewide, top 61%, 257 students, 62% FRL); Onaway Middle School (math 27% / reading 47%, grade F, #248 of 493 statewide, top 53%, 124 students, 56% FRL); Onaway Senior High School (math 15% / reading 44%, grade F, #428 of 713 statewide, top 62%, 160 students, 48% FRL) — zoned schools at 55% FRL track the district average.
- Market conditions: 39 active listings in the ZIP; 46 units permitted in Presque Isle County in 2024 (0 in 5+ unit buildings).
Forward outlook
- Local home prices are declining (-3.0%/yr); year-one equity from $553 of loan paydown is wiped out by about $2k of value loss. Plan a longer hold.
- Presque Isle County population projected at -31% by 2050 — secular population decline; favor cash flow + early exit over multi-decade hold.
- At projected returns (-3.0% appreciation + 3.0% rent growth), your $22k cash investment doubles in ~5 years — after that, you're playing with house money.
Negotiation context
- It's been on market 52 days — a 3% lower offer ($78k) is reasonable based on typical stale-listing flexibility.
- Current owner paid $20k; list at $80k implies a 300% gain — meaningful room to come down on a strong offer.
Risks & watch-outs
- Watch-outs: built in 1950 — expect roof / HVAC / electrical / plumbing capex.
Questions for the listing agent
- It's been on market 52 days. Have you received any prior offers? Is the seller open to a 3% concession, seller financing, or rate buy-down credit?
- Built in 1950 — when were the roof, HVAC, electrical panel, plumbing, and water heater last replaced?
- Is there a deadline driving the sale (1031 exchange, divorce, estate, relocation)? That informs how much negotiation room exists.
- What's the average days-on-market for RENTAL listings here right now (not sales)? A rising rental-DOM trend means longer vacancies and softer asking-rent achievability than the comps imply.
- What's the recent tenant-quality profile in this submarket — average credit score on applications, eviction rate, late-payment / NSF rate, and stable-employment percentage? A property-management company in the area should have these aggregated.
- How much new for-sale + rental construction is in the pipeline within 1–3 miles? Heavy new supply typically softens prices + rents 12–24 months out; constrained supply supports both.
Investment metrics
- 1% rule
- 1.68% ✓
- Cap rate
- 13.81%
- Cash-on-cash
- 26.86%
- DSCR
- 2.19
- GRM
- 5.0
CMA / ARV
- ARV (median comp)
- $147,538
- List price
- $80,000
- Delta
- -45.78%
- Verdict
- UNDERPRICED
- Comps
- 2 within 1.0 mi
Projected returns pro-forma
-3.0% appreciation · 3.0% rent growth · sell at horizon
- IRR
- 20.8%
- Equity multiple
- 1.85×
- Total profit
- $18,989
- Equity at exit
- $11,928
- IRR
- 29.0%
- Equity multiple
- 3.58×
- Total profit
- $57,747
- Equity at exit
- $6,917
Cash invested: $22,400 (down + closing). Projections, not guarantees.
Landlord ↔ Tenant lean methodology
- Overall (STATE)
- 62 Landlord-Friendly
- State Michigan
- 62 Landlord-Friendly · EVEN
- County
- — inherits STATE
- City
- — inherits STATE
ZIP-level market 49759
- Home prices YoY
- -28.4%
- Active inventory
- 39
- Price-to-rent
- 5.0×
Monthly cashflow live
- Estimated rent
- $1,343 medium interval (Pro) →
- Mortgage (P&I)
- −$420
- Tax from tax record
- −$107 /mo · $1,278/yr
- Insurance
- −$33
- HOA
- −$0
- Vacancy / Maint / Mgmt
- −$282
- Net cashflow
- $501
Break-even live
Sensitivity live
| Price | -10% $547 | -5% $524 | +0% $501 | +5% $479 | +10% $456 |
|---|---|---|---|---|---|
| Rent | -10% $395 | -5% $448 | +0% $501 | +5% $554 | +10% $607 |
| Rate | -1.0pp $542 | -0.5pp $522 | base $501 | +0.5pp $481 | +1.0pp $459 |
UW: 25.0% down · 7.5% · 30yr · 1.5% tax · 5.0% vac · 8.0% maint · 8.0% mgmt
Financing live
Cash to close
- Down payment
- $20,000
- Closing costs
- $2,400
- Reserves months
- —
- Total cash needed
- —
Loan-product check · same deal, 3 products live
Conventional
25% down · 7.5% · 30yr
- Down + closing
- —
- Monthly P&I
- —
- Monthly cashflow
- —
- DSCR
- —
- Eligible?
- —
Personal DTI + credit; lowest rate.
DSCR
20% down · 8.5% · 30yr
- Down + closing
- —
- Monthly P&I
- —
- Monthly cashflow
- —
- DSCR
- —
- Eligible?
- —
No personal income docs; deal must DSCR.
Hard money
10% down · 12.0% · 12mo
- Down + closing
- —
- Monthly P&I
- —
- Monthly cashflow
- —
- DSCR
- —
- Eligible?
- —
Short-term bridge; refi at stabilization.
Listing history 19 events
-
2026-06-21days on market $80,000 Active 52 DOM
-
2026-06-21days on market $80,000 Active 51 DOM
-
2026-06-18days on market $80,000 Active 49 DOM
-
2026-06-17days on market $80,000 Active 48 DOM
-
2026-06-16days on market $80,000 Active 47 DOM
-
2026-06-15days on market $80,000 Active 46 DOM
-
2026-06-13days on market $80,000 Active 44 DOM
-
2026-06-12days on market $80,000 Active 43 DOM
-
2026-06-09days on market $80,000 Active 40 DOM
-
2026-06-08days on market $80,000 Active 39 DOM
-
2026-06-07days on market $80,000 Active 38 DOM
-
2026-06-07days on market $80,000 Active 37 DOM
-
2026-06-04days on market $80,000 Active 34 DOM
-
2026-06-02days on market $80,000 Active 33 DOM
-
2026-06-01days on market $80,000 Active 32 DOM
-
2026-05-31days on market $80,000 Active 31 DOM
-
2026-05-31days on market $80,000 Active 30 DOM
-
2026-04-30$80,000 Active 631-char remark
-
2025-02-14soldstatus $20,000
ⓘ Source: listings_history table (triggers on properties + properties_extension) + one-shot
backfill from property_details.listing_events for pre-trigger history.
Tax reassessment forecast MI · Partial reset (capped growth)
- Current annual tax
- $1,278 · $107/mo
- Projected year-2 tax
- $1,278 · $107/mo
- Expected delta
- $0/yr ($0/mo · 0.0%)
ⓘ Screening estimate from a state-policy table — verify with the county assessor before closing.
Climate risk First Street
- Flood 1/10 Low 0% chance over 30 yrs
- Wildfire 4/10 Moderate
- Heat 1/10 Low 7 d/yr ≥96°F today · 13 d/yr by 30 yrs out
- Wind 1/10 Low
- Air quality 1/10 Low 0 unhealthy d/yr today · 0 by 30 yrs out
Nearby sold comps map
Loading sold comps map…
Walkable amenities ~0.75 mi
Loading nearby amenities…
Taxation est. · year 1
- Rental income
- $16,111
- − Mortgage interest
- −$4,481
- − Property taxes
- −$1,278
- − Insurance
- −$400
- − Repairs & maintenance
- −$1,289
- − Management
- −$1,289
- − Depreciation
- −$2,327
- Taxable income
- $5,047
- Est. tax owed @ 24.0%
- −$1,211
- After-tax cash flow
- $4,804/yr
For passive investors: Depreciation is non-cash, so a rental often shows a tax loss while cash-flowing — sheltering income. Rental losses are passive: they offset passive income freely, and up to $25,000/yr can offset ordinary (W-2) income if you actively participate and your MAGI is under $100k (phasing out to $0 by $150k); unused losses carry forward. On sale, claimed depreciation is recaptured at up to 25%, and gains may owe capital-gains tax (a 1031 exchange can defer both). Figures are a year-1 estimate at your 24.0% rate — not tax advice; consult a CPA.
Schools (NCES district)
- District
- Onaway Area Community School District
- NCES district ID
- 2626400
- Math proficiency
- 27% ▼ -22.00%
- Reading proficiency
- 40% ▼ -5.00%
- Median HH income
- $36,848
- Composite
- 27.8/100
- National rank
- #6889
- State rank
- #328 of 540 in MI
Livability — Case
No livability data for this city. (Only ~50 U.S. cities are tracked.)
Census & demographics
- Census place
- Millersburg, MI
- Population (ZIP)
- 1,492
Population outlook (Presque Isle County) Hauer SSP2
- Today (2025)
- 11,675 people
- By 2030
- 10,939 · -6.3%
- By 2040
- 9,337 · -20.0%
- By 2050
- 8,046 · -31.1%
- By 2075
- 6,378 · -45.4%
- By 2100
- 5,045 · -56.8%
Race, ethnicity, and origin ACS 2023
- Neighborhood character
- Predominantly White (94%)
- Race & ethnicity
- White 94% Two or more races 3% Hispanic / Latino 2% Black 1%
- Common ancestry
- Romanian 12% Lithuanian 5% Slovak 3%
- Foreign-born
- 1% · Canada
- Languages at home
- 98% English-only · Spanish 1%
Political lean MEDSL · Presque Isle
- 2024 margin
- Strong R (+29.0) · D 34.7% · R 63.7% · Other 1.5%
- 2008→2024 swing
- -30.5pp toward R · 2008: 1.5pp · 2024: -29.0pp
- All cycles
- 2024: R+29.0 2020: R+29.1 2016: R+28.9 2012: R+8.5 2008: D+1.5
Not yet ingested
- Civics
- —
Market trends
- HPI YoY
- ▼ -61.37%
- Current HPI
- 155.061
- Rent YoY
- —
- Metro
- —
- State GDP YoY
- ▲ 1.37%
- F500 in state
- 28
Industry mix (Fortune 500 HQ in MI)
| Industry | F500 HQs | Revenue |
|---|---|---|
| Automotive Parts | 3 | $48B |
|
||
| Automotive | 2 | $372B |
|
||
| Chemicals | 1 | $45B |
|
||
| Automotive Retail | 1 | $29B |
|
||
| Healthcare / Medical Devices | 1 | $23B |
|
||
| Automotive Technology | 1 | $20B |
|
||
Price history
+300.0% since first listed2 events — show timeline
- 2026-04-30 Listed $80,000 WWMLS
- 2025-02-14 Sold (Public Records) $20,000 Public Records
Property tax history
+1.2%/yrLatest (2025): $1,278 · +19.9% YoY. Source: county tax records.
Cash-flow waterfall
monthlySold comps — $/sqft
last 12 mo · ≤1 miLoading sold comps…