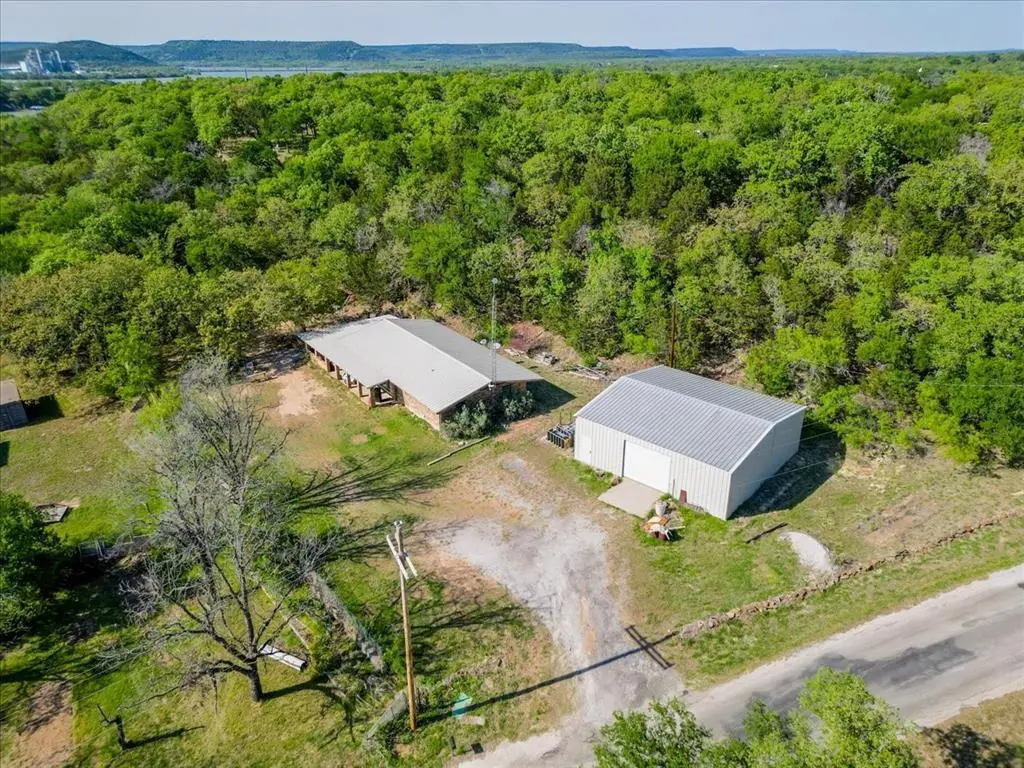
4550 S Lakeview Dr · Santo, TX
Flood risk 1/10 · Minimal
- FEMA flood zone
- X (unshaded)
- Chance of flooding over 30 yrs
- 0.0%
- Est. flood insurance / yr
- $507 – $1,088
Fire risk 6/10 · Moderate
- Est. fire insurance / yr
- $1,222 – $2,270
Heat risk 7/10 · Major
- Hot days now (above 108°F)
- 7 days/yr
- Hot days in 30 yrs
- 22 days/yr
Wind risk 4/10 · Minor
- Chance of severe wind over 30 yrs
- 20.0%
Air-quality risk 2/10 · Minimal
- Unhealthy air days now
- 0 days/yr
- Unhealthy air days in 30 yrs
- 1 days/yr
Risk factors via First Street. Map © Google.
Why this score? — see what drove the C+ grade
The composite is a weighted blend of 9 inputs, each scored 0–100. Each bar is that input's sub-score; the figure is the points it added to the 100-point composite (weight × sub-score).
- Cash flow +17.6/30.0
- ARV discount +15.0/15.0
- Appreciation +7.4/10.0
- DSCR +5.5/10.0
- Schools +4.6/10.0
- 1% rule +4.5/10.0
- Rent growth +2.5/5.0
- Livability +2.5/5.0
- Condition / age +2.5/5.0
$139,000
🖨 Deal sheet 📄 Offer letter ✓ Due diligence
Listing remarks MLS
Located just outside of Gordon down the road from Lake Palo Pinto lies this 2 bed 2 bath brick home and large insulated workshop with power. Workshop is only a few years old. Home needs love but can be quickly brought back to life. Boat ramp is about a half mile down the road into Palo Pinto Lake. Get a taste of lake living at a fraction of the price of any waterfront property. Property next door is also listed for sale. Property is fed by a well on adjacent property. Co-op water tap is being requested should their be a different buyer for the half acre lot next door. All offers need submitted via FinalOffer.com
Key facts
- Lake living
- Boat ramp
- 0.94 acre lot
Tags
Neighborhood map
What this means for you Summary
Snapshot
- This is a 2-bed/2.0-bath single-family listed at $139k.
Deal economics
- At list price, monthly cash flow is $110 ($1k/yr) — positive.
- The deal already cash-flows at list — no discount required.
- To meet the 1% rule (rent ≥ 1% of price), the offer needs to be $132k (5.0% below list).
- Recommended offer: $132k (5.0% below list) — sets the bar for 1% rule.
- Cap rate 7.2% vs local median 0.5% in Santo — top-decile yield for the area; either an underpriced asset or a hidden risk that comps aren't pricing in. Stress-test before assuming the spread holds.
Location & tenants
- Location reads: area grade C — affects rentability + tenant quality, not the cash-flow math above.
- Santo ISD (rural): math 55% / reading 52% proficiency, ranked #124 of 826 in TX (top 15%) — acceptable for families but not a draw, mixed tenant base, ~2y average lease.
- Market conditions: 72 active listings in the ZIP; 27 units permitted in Palo Pinto County in 2024 (0 in 5+ unit buildings).
Forward outlook
- In year one you build about $8k of equity ($961 loan paydown + $7k appreciation (4.8% local appreciation)).
- Palo Pinto County population projected to shrink 8% by 2050 — rents likely to lag national; underwrite the cash flow, not the appreciation.
- At projected returns (4.8% appreciation + 3.0% rent growth), your $39k cash investment doubles in ~4 years — after that, you're playing with house money.
- By year 5, paydown + projected appreciation supports a ~$33k cash-out refi (75% LTV) — recoverable capital for the next deal without selling this one.
Negotiation context
- It's been on market 53 days — a 3% lower offer ($135k) is reasonable based on typical stale-listing flexibility.
- 2 sale attempts since 17y ago; this cycle's ask has dropped $11k (7%) from the opening price — seller is motivated, your offer sets the floor, not the list.
Risks & watch-outs
- Climate carrying-cost: major wildfire risk; extreme-heat days projected 7→22/yr by 2055 (HVAC capex compounding) — expect insurance premiums to compound above CPI over the hold.
Questions for the listing agent
- It's been on market 53 days. Have you received any prior offers? Is the seller open to a 5% concession, seller financing, or rate buy-down credit?
- Is there a deadline driving the sale (1031 exchange, divorce, estate, relocation)? That informs how much negotiation room exists.
- What's the average days-on-market for RENTAL listings here right now (not sales)? A rising rental-DOM trend means longer vacancies and softer asking-rent achievability than the comps imply.
- What's the recent tenant-quality profile in this submarket — average credit score on applications, eviction rate, late-payment / NSF rate, and stable-employment percentage? A property-management company in the area should have these aggregated.
- How much new for-sale + rental construction is in the pipeline within 1–3 miles? Heavy new supply typically softens prices + rents 12–24 months out; constrained supply supports both.
Investment metrics
- 1% rule
- 0.95% ✗
- Cap rate
- 7.24%
- Cash-on-cash
- 3.38%
- DSCR
- 1.15
- GRM
- 8.8
CMA / ARV
- ARV (median comp)
- $231,124
- List price
- $139,000
- Delta
- -39.86%
- Verdict
- UNDERPRICED
- Comps
- 9 within 1.0 mi
Show comp detail 3 sales within ~0.75 mi
| Address | Dist | Beds/Ba | Sqft | Sold | Price | $/sf | Match |
|---|---|---|---|---|---|---|---|
| 38 Lake Point Dr | 0.15mi | 3/2.5 (+1) | 1,540 (-5%) | 15mo | $674,000 | $438 | 65 |
| 380 Chism Trl | 0.66mi | 3/2.0 (+1) | 1,624 (0%) | 8mo | $449,000 | $276 | 58 |
| 2350 N Lakeview Dr | 0.60mi | 3/2.0 (+1) | 1,749 (+8%) | 22mo | $525,000 | $300 | 36 |
Match score weights: distance 35% · size 25% · config 20% · recency 20%. Top-matched comps best support the ARV.
Projected returns pro-forma
4.77% appreciation · 3.0% rent growth · sell at horizon
- IRR
- 15.2%
- Equity multiple
- 1.95×
- Total profit
- $37,156
- Equity at exit
- $76,790
- IRR
- 15.8%
- Equity multiple
- 3.76×
- Total profit
- $107,229
- Equity at exit
- $130,920
Cash invested: $38,920 (down + closing). Projections, not guarantees.
Landlord ↔ Tenant lean methodology
- Overall (STATE)
- 87 Strongly Landlord-Friendly
- State Texas
- 87 Strongly Landlord-Friendly · R+5
- County
- — inherits STATE
- City
- — inherits STATE
ZIP-level market 76453
- Home prices YoY
- 1.9%
- Active inventory
- 72
- Price-to-rent
- 8.8×
Monthly cashflow live
- Estimated rent
- $1,321 medium interval (Pro) →
- Mortgage (P&I)
- −$729
- Tax from tax record
- −$147 /mo · $1,765/yr
- Insurance
- −$58
- HOA
- −$0
- Vacancy / Maint / Mgmt
- −$277
- Net cashflow
- $110
Break-even live
UW: 25.0% down · 7.5% · 30yr · 1.5% tax · 5.0% vac · 8.0% maint · 8.0% mgmt
Financing live
Cash to close
- Down payment
- $34,750
- Closing costs
- $4,170
- Reserves months
- —
- Total cash needed
- —
Loan-product check · same deal, 3 products live
Conventional
25% down · 7.5% · 30yr
- Down + closing
- —
- Monthly P&I
- —
- Monthly cashflow
- —
- DSCR
- —
- Eligible?
- —
Personal DTI + credit; lowest rate.
DSCR
20% down · 8.5% · 30yr
- Down + closing
- —
- Monthly P&I
- —
- Monthly cashflow
- —
- DSCR
- —
- Eligible?
- —
No personal income docs; deal must DSCR.
Hard money
10% down · 12.0% · 12mo
- Down + closing
- —
- Monthly P&I
- —
- Monthly cashflow
- —
- DSCR
- —
- Eligible?
- —
Short-term bridge; refi at stabilization.
Listing history 5 events
-
2026-05-05price $139,000 619-char remark
Show marketing remark (619 chars)
Located just outside of Gordon down the road from Lake Palo Pinto lies this 2 bed 2 bath brick home and large insulated workshop with power. Workshop is only a few years old. Home needs love but can be quickly brought back to life. Boat ramp is about a half mile down the road into Palo Pinto Lake. Get a taste of lake living at a fraction of the price of any waterfront property. Property next door is also listed for sale. Property is fed by a well on adjacent property. Co-op water tap is being requested should their be a different buyer for the half acre lot next door. All offers need submitted via FinalOffer.com
-
2026-04-03$150,000 Active 619-char remark
Show marketing remark (619 chars)
Located just outside of Gordon down the road from Lake Palo Pinto lies this 2 bed 2 bath brick home and large insulated workshop with power. Workshop is only a few years old. Home needs love but can be quickly brought back to life. Boat ramp is about a half mile down the road into Palo Pinto Lake. Get a taste of lake living at a fraction of the price of any waterfront property. Property next door is also listed for sale. Property is fed by a well on adjacent property. Co-op water tap is being requested should their be a different buyer for the half acre lot next door. All offers need submitted via FinalOffer.com
-
2010-11-24soldstatus Closed 132-char remark
Show marketing remark (132 chars)
Fixer Upper across the road from the lake, walk to public boat ramp. 3 lots, 2 houses. 1.58 acres in all. Property to be sold AS IS.
-
2010-10-15historical 132-char remark
Show marketing remark (132 chars)
Fixer Upper across the road from the lake, walk to public boat ramp. 3 lots, 2 houses. 1.58 acres in all. Property to be sold AS IS.
-
2009-02-10$50,000 132-char remark
Show marketing remark (132 chars)
Fixer Upper across the road from the lake, walk to public boat ramp. 3 lots, 2 houses. 1.58 acres in all. Property to be sold AS IS.
ⓘ Source: listings_history table (triggers on properties + properties_extension) + one-shot
backfill from property_details.listing_events for pre-trigger history.
Tax reassessment forecast TX · Resets to sale price
- Current annual tax
- $1,765 · $147/mo
- Projected year-2 tax
- $2,544 · $212/mo
- Expected delta
- +$779/yr (+$65/mo · 44.1%)
ⓘ Screening estimate from a state-policy table — verify with the county assessor before closing.
Climate risk First Street
- Flood 1/10 Low FEMA zone X (unshaded) · 0% chance over 30 yrs
- Wildfire 6/10 Major
- Heat 7/10 Severe 7 d/yr ≥108°F today · 22 d/yr by 30 yrs out
- Wind 4/10 Moderate 20% chance of damaging wind over 30 yrs
- Air quality 2/10 Low 0 unhealthy d/yr today · 1 by 30 yrs out
Nearby sold comps map
Loading sold comps map…
Walkable amenities ~0.75 mi
Loading nearby amenities…
Taxation est. · year 1
- Rental income
- $15,850
- − Mortgage interest
- −$7,786
- − Property taxes
- −$1,765
- − Insurance
- −$695
- − Repairs & maintenance
- −$1,268
- − Management
- −$1,268
- − Depreciation
- −$4,044
- Taxable loss
- −$976
- Est. tax savings @ 24.0%
- +$234
- After-tax cash flow
- $1,549/yr
For passive investors: Depreciation is non-cash, so a rental often shows a tax loss while cash-flowing — sheltering income. Rental losses are passive: they offset passive income freely, and up to $25,000/yr can offset ordinary (W-2) income if you actively participate and your MAGI is under $100k (phasing out to $0 by $150k); unused losses carry forward. On sale, claimed depreciation is recaptured at up to 25%, and gains may owe capital-gains tax (a 1031 exchange can defer both). Figures are a year-1 estimate at your 24.0% rate — not tax advice; consult a CPA.
Schools (NCES district)
- District
- Santo ISD
- NCES district ID
- 4839390
- Math proficiency
- 55% ▲ 3.00%
- Reading proficiency
- 52% ▲ 3.00%
- Median HH income
- $52,304
- Composite
- 45.93/100
- National rank
- #2543
- State rank
- #124 of 826 in TX
Livability — Santo
No livability data for this city. (Only ~50 U.S. cities are tracked.)
Census & demographics
- Population (ZIP)
- 1,474
Population outlook (Palo Pinto County) Hauer SSP2
- Today (2025)
- 27,500 people
- By 2030
- 27,079 · -1.5%
- By 2040
- 26,135 · -5.0%
- By 2050
- 25,215 · -8.3%
- By 2075
- 23,416 · -14.9%
- By 2100
- 20,300 · -26.2%
Race, ethnicity, and origin ACS 2023
- Neighborhood character
- Predominantly White (89%)
- Race & ethnicity
- White 89% Hispanic / Latino 8% Two or more races 3% Asian 2%
- Hispanic origin (detail)
- Mexican 7%
- Common ancestry
- Slovak 4% Iranian 2% Lithuanian 1%
- Foreign-born
- 4% · Canada
- Languages at home
- 97% English-only · Spanish 2% Tagalog/Filipino 1%
Political lean MEDSL · Palo Pinto
- 2024 margin
- Solid R (+67.1) · D 16.1% · R 83.2%
- 2008→2024 swing
- -18.9pp toward R · 2008: -48.2pp · 2024: -67.1pp
- All cycles
- 2024: R+67.1 2020: R+64.1 2016: R+64.1 2012: R+59.8 2008: R+48.2
Not yet ingested
- Civics
- —
Market trends
- HPI YoY
- ▲ 4.77%
- Current HPI
- 250.4798
- Rent YoY
- —
- Metro
- —
- State GDP YoY
- ▲ 3.95%
- F500 in state
- 110
Industry mix (Fortune 500 HQ in TX)
| Industry | F500 HQs | Revenue |
|---|---|---|
| Energy | 16 | $1,198B |
|
||
| Technology | 5 | $198B |
|
||
| Engineering / Construction | 4 | $72B |
|
||
| Energy Services | 3 | $60B |
|
||
| Utilities | 3 | $41B |
|
||
| Healthcare | 2 | $330B |
|
||
Price history
+178.0% since first listed5 events — show timeline
- 2026-05-05 Price Changed $139,000 NTREIS
- 2026-04-03 Listed $150,000 NTREIS
- 2010-11-24 Sold (MLS) — NTREIS
- 2010-10-15 Listing Removed — NTREIS
- 2009-02-10 Listed $50,000 NTREIS
Property tax history
+6.5%/yrLatest (2025): $1,765 · +9.5% YoY. Source: county tax records.
Cash-flow waterfall
monthlySold comps — $/sqft
last 12 mo · ≤1 miLoading sold comps…