109 Tennessee St · Taylor, TX
Flood risk 1/10 · Minimal
- FEMA flood zone
- X (unshaded)
- Chance of flooding over 30 yrs
- 0.0%
- Est. flood insurance / yr
- $507 – $1,088
Fire risk 3/10 · Minor
- Est. fire insurance / yr
- $1,222 – $2,270
Heat risk 8/10 · Major
- Hot days now (above 108°F)
- 7 days/yr
- Hot days in 30 yrs
- 23 days/yr
Wind risk 8/10 · Major
- Chance of severe wind over 30 yrs
- 80.0%
Air-quality risk 2/10 · Minimal
- Unhealthy air days now
- 0 days/yr
- Unhealthy air days in 30 yrs
- 1 days/yr
Risk factors via First Street. Map © Google.
Why this score? — see what drove the B grade
The composite is a weighted blend of 9 inputs, each scored 0–100. Each bar is that input's sub-score; the figure is the points it added to the 100-point composite (weight × sub-score).
- Cash flow +30.0/30.0
- ARV discount +15.0/15.0
- DSCR +10.0/10.0
- 1% rule +8.2/10.0
- Livability +3.6/5.0
- Rent growth +2.6/5.0
- Condition / age +2.5/5.0
- Schools +2.0/10.0
- Appreciation +0.0/10.0
$127,000
🖨 Deal sheet (PDF) 📄 Offer letter ✓ Due diligence
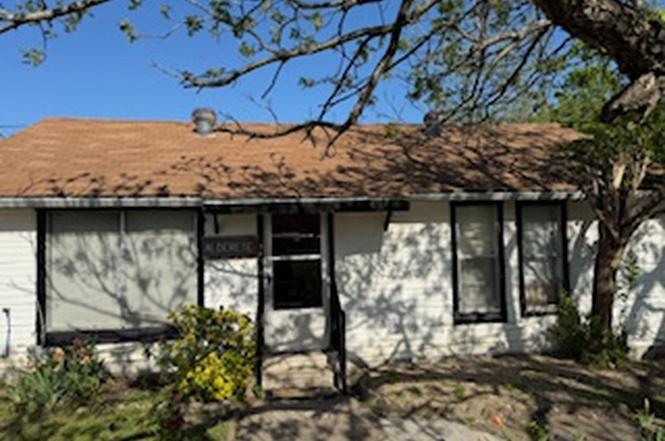
Listing remarks
Little cottage built approximately in 1945. It has three bedrooms, one bath, living area, eat in kitchen, quaint yard, just a few minutes from downtown Taylor. Home is centrally located, near a park and schools, also very close to main transportation arteries and shopping. The home would be a great opportunity for either an investor or someone who likes to update and change the architecture. Come take a look and see it's potential.
Key facts
- Near schools
- Near a park
- Centrally located
Tags
Property features AI
Finance
- HOA & community: Playground; Park
Exterior
- Parking: Driveway; 2 parking spaces
- Utilities: Cable available; Electricity connected; Propane available; Public water; Public sewer
- Home design: Single-story; Faces west; Resale property
- Construction: Frame construction with clapboard siding; Blown-in insulation; Asphalt, composition and metal roofing; Pillar/post/pier raised foundation; Built (year source: public records)
- Exterior features: Rain gutters; Chain-link fence; Back yard; Front yard; City lot; Level lot
Interior
- Kitchen: Free-standing range; Gas range
- Bedrooms: 3 main-level bedrooms
- Flooring: Carpet; Laminate
- Bathrooms: 1 full bathroom
- Heating & cooling: Propane heating; Space heater; Ceiling fans for cooling; Roof turbines
- Interior features: Ceiling fans; Eat-in kitchen; No interior steps; Blinds and window treatments
- Laundry & utility: Laundry closet and laundry room; Washer hookup; Electric dryer hookup; Outside access to laundry
Neighborhood map
What this means for you Summary
Snapshot
- This is a 3-bed/1.0-bath single-family listed at $127k.
Deal economics
- At list price, monthly cash flow is $489 ($6k/yr) — positive.
- The deal already cash-flows at list — no discount required.
- Meets the 1% rule at list price ($2k rent vs $127k).
- Cap rate 10.9% vs local median 4.3% in Taylor — top-decile yield for the area; either an underpriced asset or a hidden risk that comps aren't pricing in. Stress-test before assuming the spread holds.
Location & tenants
- Location reads 71/100 on livability (#312 in TX) — a middle-class / working-renter tenant base. Strengths: cost of living A+, housing A+; Watch: employment C-, schools D-, amenities F.
- Taylor ISD (town): math 20% / reading 27% proficiency, ranked #726 of 826 in TX (top 88%) — low school quality limits family demand, transient renter base, plan for 1-2y turnover; 61% free/reduced lunch — lower-income household profile, screen leases tightly.
- Market conditions: Rents flat; 314 active listings in the ZIP; 10 comparable units currently listed for rent nearby; rentals lingering (median 45d on market — plan ~5-8 weeks vacancy on turnover, expect pricing pressure); 50% of comp listings sitting > 30 days — soft ceiling on asking rent; solid renter incomes; 7,543 units permitted in Williamson County in 2024 (1,425 in 5+ unit buildings).
Forward outlook
- Local home prices are declining (-3.0%/yr); year-one equity from $878 of loan paydown is wiped out by about $4k of value loss. Plan a longer hold.
- Williamson County population projected at +69% by 2050 — long-run rental-demand tailwind backs the buy-and-hold thesis.
- At projected returns (-3.0% appreciation + 0.4% rent growth), your $36k cash investment doubles in ~10 years — after that, you're playing with house money.
Negotiation context
- Only 2 days on market — expect competitive offers; lowballing is unlikely to land.
- 3 sale attempts with the ask held roughly flat each time — persistent listings suggest the price (not the market) is what's stuck; bring a comps-based counter.
Risks & watch-outs
- Watch-outs: built in 1945 — expect roof / HVAC / electrical / plumbing capex.
- Climate carrying-cost: severe wind risk, 80% chance of damaging wind over 30y; extreme-heat days projected 7→23/yr by 2055 (HVAC capex compounding) — expect insurance premiums to compound above CPI over the hold.
Questions for the listing agent
- Built in 1945 — when were the roof, HVAC, electrical panel, plumbing, and water heater last replaced?
- Is there a deadline driving the sale (1031 exchange, divorce, estate, relocation)? That informs how much negotiation room exists.
- Schools are D-rated, which usually means shorter tenancies and higher turnover. Who's the typical renter profile here, and what's been the actual vacancy rate?
- What's the average days-on-market for RENTAL listings here right now (not sales)? A rising rental-DOM trend means longer vacancies and softer asking-rent achievability than the comps imply.
- What's the recent tenant-quality profile in this submarket — average credit score on applications, eviction rate, late-payment / NSF rate, and stable-employment percentage? A property-management company in the area should have these aggregated.
- How much new for-sale + rental construction is in the pipeline within 1–3 miles? Heavy new supply typically softens prices + rents 12–24 months out; constrained supply supports both.
Investment metrics
- 1% rule
- 1.32% ✓
- Cap rate
- 10.92%
- Cash-on-cash
- 16.51%
- DSCR
- 1.73
- GRM
- 6.3
CMA / ARV
- ARV (on-the-fly)
- $207,552
- Comps found
- 5
Show comp detail 5 sales within ~0.75 mi
| Address | Dist | Beds/Ba | Sqft | Sold | Price | $/sf | Match |
|---|---|---|---|---|---|---|---|
| 143 2nd Ave | 0.22mi | 3/2.0 | 1,111 (-2%) | 15mo | $265,000 | $239 | 71 |
| 409 Talley St | 0.42mi | 4/2.0 (+1) | 1,200 (+6%) | 1mo | $199,999 | $167 | 60 |
| 608 E Pecan St | 0.48mi | 3/2.0 | 1,184 (+5%) | 11mo | $139,500 | $118 | 57 |
| 404 Mariposa Ln E | 0.65mi | 3/1.0 | 1,086 (-4%) | 16mo | $199,900 | $184 | 50 |
| 402 E 4th St | 0.64mi | 2/1.0 (-1) | 1,088 (-4%) | 16mo | $390,000 | $358 | 46 |
Match score weights: distance 35% · size 25% · config 20% · recency 20%. Top-matched comps best support the ARV.
Projected returns pro-forma
-3.0% appreciation · 0.43% rent growth · sell at horizon
- IRR
- 4.7%
- Equity multiple
- 1.18×
- Total profit
- $6,347
- Equity at exit
- $18,936
- IRR
- 11.8%
- Equity multiple
- 1.82×
- Total profit
- $29,144
- Equity at exit
- $10,981
Cash invested: $35,560 (down + closing). Projections, not guarantees.
Landlord ↔ Tenant lean methodology
- Overall (STATE)
- 87 Strongly Landlord-Friendly
- State Texas
- 87 Strongly Landlord-Friendly · R+5
- County
- — inherits STATE
- City
- — inherits STATE
ZIP-level market 76574
- Home prices YoY
- -32.3%
- Rents YoY
- 0.4%
- Active inventory
- 314
- Price-to-rent
- 6.3×
Monthly cashflow live
- Estimated rent
- $1,681 high interval (Pro) →
- Mortgage (P&I)
- −$666
- Tax from tax record
- −$120 /mo · $1,435/yr
- Insurance
- −$53
- HOA
- −$0
- Vacancy / Maint / Mgmt
- −$353
- Net cashflow
- $489
Break-even live
Sensitivity live
| Price | -10% $561 | -5% $525 | +0% $489 | +5% $453 | +10% $417 |
|---|---|---|---|---|---|
| Rent | -10% $357 | -5% $423 | +0% $489 | +5% $556 | +10% $622 |
| Rate | -1.0pp $553 | -0.5pp $522 | base $489 | +0.5pp $456 | +1.0pp $423 |
UW: 25.0% down · 7.5% · 30yr · 1.5% tax · 5.0% vac · 8.0% maint · 8.0% mgmt
Financing live
Cash to close
- Down payment
- $31,750
- Closing costs
- $3,810
- Reserves months
- —
- Total cash needed
- —
Loan-product check · same deal, 3 products live
Conventional
25% down · 7.5% · 30yr
- Down + closing
- —
- Monthly P&I
- —
- Monthly cashflow
- —
- DSCR
- —
- Eligible?
- —
Personal DTI + credit; lowest rate.
DSCR
20% down · 8.5% · 30yr
- Down + closing
- —
- Monthly P&I
- —
- Monthly cashflow
- —
- DSCR
- —
- Eligible?
- —
No personal income docs; deal must DSCR.
Hard money
10% down · 12.0% · 12mo
- Down + closing
- —
- Monthly P&I
- —
- Monthly cashflow
- —
- DSCR
- —
- Eligible?
- —
Short-term bridge; refi at stabilization.
Rent comps 10 comps
| Address | Beds | Baths | Sqft | Rent | $/sqft | DOM | Units | Dist |
|---|---|---|---|---|---|---|---|---|
| 412 Booth St Unit A Taylor, TX | 2.0 | 2.0 | 837 | $1,395 | $1.67 | 44d | 1 | 0.75mi |
| 109 N Main St Unit A Taylor, TX | 2.0 | 1.0 | 1495 | $1,750 | $1.17 | 2d | 1 | 0.82mi |
| 400 Symes St Unit A Taylor, TX | 2.0 | 1.0 | 784 | $1,150 | $1.47 | 5d | 1 | 1.01mi |
| 604 W 4th St Taylor, TX | 2.0 | 1.0 | 946 | $1,295 | $1.37 | 44d | 1 | 1.19mi |
| 606 W 4th St Taylor, TX | 2.0 | 1.0 | 946 | $1,295 | $1.37 | 44d | 1 | 1.19mi |
| 415 N Doak St Taylor, TX | 2.0 | 1.0 | 880 | $1,400 | $1.59 | 44d | 1 | 1.25mi |
| 719 W 3rd St Taylor, TX | 2.0 | 1.0 | 966 | $1,750 | $1.81 | 18d | 1 | 1.26mi |
| 600 Kimbro St Taylor, TX | 3.0 | 2.5 | 1480 | $2,250 | $1.52 | 24d | 1 | 1.34mi |
| 401 Shaw St Taylor, TX | 2.0 | 1.0 | 1168 | $1,650 | $1.41 | 18d | 1 | 1.37mi |
| 806 W 8th St Taylor, TX | 3.0 | 1.0 | 892 | $1,600 | $1.79 | 44d | 1 | 1.42mi |
Listing history 3 events
-
2026-06-18days on market $127,000 Active 2 DOM
-
2026-06-17remarks 436-char remark
-
2026-06-17$127,000 Active 1 DOM
ⓘ Source: listings_history table (triggers on properties + properties_extension) + one-shot
backfill from property_details.listing_events for pre-trigger history.
Tax reassessment forecast TX · Resets to sale price
- Current annual tax
- $1,435 · $120/mo
- Projected year-2 tax
- $2,324 · $194/mo
- Expected delta
- +$889/yr (+$74/mo · 61.9%)
ⓘ Screening estimate from a state-policy table — verify with the county assessor before closing.
Climate risk First Street
- Flood 1/10 Low FEMA zone X (unshaded) · 0% chance over 30 yrs
- Wildfire 3/10 Moderate
- Heat 8/10 Severe 7 d/yr ≥108°F today · 23 d/yr by 30 yrs out
- Wind 8/10 Severe 80% chance of damaging wind over 30 yrs
- Air quality 2/10 Low 0 unhealthy d/yr today · 1 by 30 yrs out
Nearby sold comps map
Loading sold comps map…
Walkable amenities ~0.75 mi
Loading nearby amenities…
Taxation est. · year 1
- Rental income
- $20,169
- − Mortgage interest
- −$7,114
- − Property taxes
- −$1,435
- − Insurance
- −$635
- − Repairs & maintenance
- −$1,614
- − Management
- −$1,614
- − Depreciation
- −$3,695
- Taxable income
- $4,063
- Est. tax owed @ 24.0%
- −$975
- After-tax cash flow
- $4,896/yr
For passive investors: Depreciation is non-cash, so a rental often shows a tax loss while cash-flowing — sheltering income. Rental losses are passive: they offset passive income freely, and up to $25,000/yr can offset ordinary (W-2) income if you actively participate and your MAGI is under $100k (phasing out to $0 by $150k); unused losses carry forward. On sale, claimed depreciation is recaptured at up to 25%, and gains may owe capital-gains tax (a 1031 exchange can defer both). Figures are a year-1 estimate at your 24.0% rate — not tax advice; consult a CPA.
Schools (NCES district)
- District
- Taylor ISD
- NCES district ID
- 4842280
- Math proficiency
- 20% ▼ -15.00%
- Reading proficiency
- 27% ▼ -11.00%
- Median HH income
- $45,330
- Composite
- 20.35/100
- National rank
- #8606
- State rank
- #726 of 826 in TX
Livability — Taylor
- Score
- 71/100
- State rank
- #312
- US rank
- #7013
Category grades
Schools grade is shown separately in the Schools card above.
Census & demographics
- Census place
- Taylor, TX
- County
- Williamson County · 680,029 people
- City population
- 20,242
- Metro
- Austin-Round Rock-Georgetown, TX
- Population (ZIP)
- 20,242
- Household income
- $78,568
- Rent vs Own
- Severe rent burden
- 371.0
Population outlook (Williamson County) Hauer SSP2
- Today (2025)
- 699,027 people
- By 2030
- 795,537 · +13.8%
- By 2040
- 990,683 · +41.7%
- By 2050
- 1,184,292 · +69.4%
- By 2075
- 1,623,825 · +132.3%
- By 2100
- 1,924,153 · +175.3%
Race, ethnicity, and origin ACS 2023
- Neighborhood character
- Diverse neighborhood (Simpson 0.57)
- Race & ethnicity
- White 50% Hispanic / Latino 42% Two or more races 22% Black 5%
- Hispanic origin (detail)
- Mexican 37%
- Common ancestry
- Romanian 2% Italian 1% Lithuanian 1%
- Foreign-born
- 8% · Canada
- Languages at home
- 74% English-only · Spanish 23% Russian/Polish/Slavic 1%
Political lean MEDSL · Williamson
- 2024 margin
- Toss-up / Even · D 48.0% · R 50.4% · Other 1.6%
- 2008→2024 swing
- +10.6pp toward D · 2008: -13.0pp · 2024: -2.5pp
- All cycles
- 2024: R+2.5 2020: D+1.4 2016: R+9.9 2012: R+21.5 2008: R+13.0
Not yet ingested
- Civics
- —
Market trends
- HPI YoY
- ▼ -108.71%
- Current HPI
- 227.58
- Rent YoY
- ▲ 0.43%
- Metro
- Austin-Round Rock-Georgetown, TX
- State GDP YoY
- ▲ 3.95%
- F500 in state
- 110
Industry mix (Fortune 500 HQ in TX)
| Industry | F500 HQs | Revenue |
|---|---|---|
| Energy | 16 | $1,198B |
|
||
| Technology | 5 | $198B |
|
||
| Engineering / Construction | 4 | $72B |
|
||
| Energy Services | 3 | $60B |
|
||
| Utilities | 3 | $41B |
|
||
| Healthcare | 2 | $330B |
|
||
Price history
7 events — show timeline
- 2026-06-16 Listed $127,000 Unlock MLS
- 2025-10-14 Listed — Unlock MLS
- 2025-09-06 Price Changed — Unlock MLS
- 2025-04-18 Listed — Unlock MLS
- 2005-10-07 Sold (Public Records) — Public Records
- 2005-03-14 Sold (Public Records) — Public Records
- 1983-07-28 Sold (Public Records) — Public Records
Property tax history
+8.4%/yrLatest (2026): $1,435 · -5.7% YoY. Source: county tax records.
Cash-flow waterfall
monthlySold comps — $/sqft
last 12 mo · ≤1 miLoading sold comps…