 8-Plex
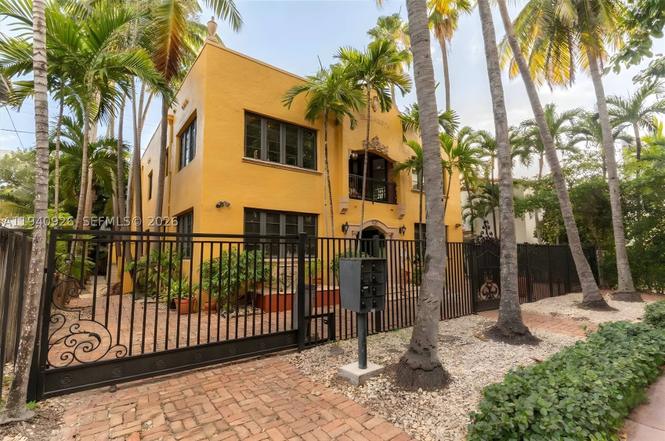
632 15th St · Miami Beach, FL
Flood risk 9/10 · Severe
- FEMA flood zone
- AE
- Chance of flooding over 30 yrs
- 0.99%
- Est. flood insurance / yr
- $1,737 – $8,500
Fire risk 3/10 · Minor
- Est. fire insurance / yr
- $947 – $1,759
Heat risk 10/10 · Severe
- Hot days now (above 101°F)
- 8 days/yr
- Hot days in 30 yrs
- 31 days/yr
Wind risk 10/10 · Severe
- Chance of severe wind over 30 yrs
- 99.0%
Air-quality risk 2/10 · Minimal
- Unhealthy air days now
- 1 days/yr
- Unhealthy air days in 30 yrs
- 1 days/yr
Risk factors via First Street. Map © Google.
Why this score? — see what drove the B grade
The composite is a weighted blend of 9 inputs, each scored 0–100. Each bar is that input's sub-score; the figure is the points it added to the 100-point composite (weight × sub-score).
- Cash flow +30.0/30.0
- DSCR +10.0/10.0
- 1% rule +8.6/10.0
- ARV discount +7.5/15.0
- Schools +4.2/10.0
- Livability +4.0/5.0
- Appreciation +3.9/10.0
- Condition / age +2.5/5.0
- Rent growth +2.4/5.0
$2,650,000
🖨 Deal sheet (PDF) 📄 Offer letter ✓ Due diligence
Multi-family units
County records classify this as Multi-Family (5+ Unit). Listing-text estimate: 8 units. confirmed
5+ unit building — per-unit beds/baths from public records are typically unavailable; the breakdown below (if shown) is an estimate from the listing text.
Listing remarks
THE ELIZABETH - PRIME SOUTH BEACH MULTIFAMILY | HIGH-RENT ASSET IN A+ LOCATION. Rare opportunity to acquire a 8-unit multifamily in the heart of South Beach, just steps from Lincoln Road, Flamingo Park, Española Way, and the beach—one of Miami Beach’s strongest rental corridors. 8 updated 1-beds/1-baths, every unit features CENTRAL A/C and IN-UNIT WASHER & DRYER, a rare combination that directly supports above-market rents, low vacancy, and strong tenant demand. 100% Leased. Additional features include impact windows, gated access, and private outdoor space. Fully 40-year recertified and zoned RM-1, this asset offers immediate cash flow with long-term upside in a su
Key facts
- Gated access
- 8 unit multifamily
- Central a/c
Tags
Property features AI
Finance
- Financial info: Multiple income-producing units with reported rents of $4,500 per unit; Units shown as leased
Exterior
- Parking: Parking spaces for multiple units (2 parking total reported)
- Utilities: Cable available; Public sewer
- Home design: 2-story property; Resale
- Construction: Block construction
- Exterior features: Less than quarter-acre lot
Interior
- Kitchen: Kitchen(s) included; Dishwasher; Microwave; Range; Refrigerator
- Bedrooms: Multiple 2-bedroom units (units are unfurnished)
- Flooring: Hardwood; Tile; Wood
- Bathrooms: Multiple full bathrooms
- Heating & cooling: Central air conditioning; Electric heating
- Interior features: Impact glass windows; Family room
- Laundry & utility: Washer; Dryer; Electric meter
Neighborhood map
What this means for you Summary
Snapshot
- This is a 8 × 2-bed/1.0-bath units multifamily listed at $2.65M.
Deal economics
- At list price, monthly cash flow is $10k ($122k/yr) — positive. Per door: $1k/mo.
- The deal already cash-flows at list — no discount required.
- Meets the 1% rule at list price ($36k rent vs $2.65M).
- Recommended offer: $2.33M (12.0% below list) — sets the bar for market timing.
- Cap rate 11.1% vs local median 1.5% in Miami Beach — top-decile yield for the area; either an underpriced asset or a hidden risk that comps aren't pricing in. Stress-test before assuming the spread holds.
Location & tenants
- Location reads 80/100 on livability (#108 in FL, #1,672 nationally) — a professional / high-income tenant draw. Strengths: crime A+, commute A+, health & safety A+; Watch: housing C-, amenities D-, cost of living F.
- Miami-Dade (suburban): math 45% / reading 54% proficiency, ranked #40 of 73 in FL (top 55%) — families likely to look elsewhere, expect single-tenant / working-renter base with shorter leases; 64% free/reduced lunch — lower-income household profile, screen leases tightly.
- Zoned schools: Miami Beach Feinberg/Fisher K-8 (math 37% / reading 34%, grade F, #1,684 of 2,144 statewide, top 79%, 842 students, 61% FRL); Miami Beach Nautilus Middle School (math 46% / reading 58%, grade C+, #217 of 571 statewide, top 40%, 918 students, 44% FRL); Miami Beach Senior High School (math 21% / reading 48%, grade F, #386 of 667 statewide, top 59%, 2,175 students, 40% FRL) — zoned schools average 48% FRL vs 64% district-wide (16 pts lower); this property's tenant base skews higher-income than the district average.
- Market conditions: Rents soft (-0.4%/yr); 1216 active listings in the ZIP; 1 comparable units currently listed for rent nearby; 10,051 units permitted in Miami-Dade County in 2024 (7,758 in 5+ unit buildings).
- At $35,998/mo this rent would consume 619% of the median local household income ($70k/yr) (locally 4052% of renters already pay >50% of income on rent) — very limited rent-growth headroom before tenants either downsize or default.
Forward outlook
- Local home prices are declining (-2.2%/yr); year-one equity from $18k of loan paydown is wiped out by about $58k of value loss. Plan a longer hold.
- Miami-Dade County population projected at +28% by 2050 — long-run rental-demand tailwind backs the buy-and-hold thesis.
- At projected returns (-2.2% appreciation + 0.0% rent growth), your $742k cash investment doubles in ~9 years — after that, you're playing with house money.
Negotiation context
- It's been on market 160 days — a 12% lower offer ($2.33M) is reasonable based on typical stale-listing flexibility.
- 3 sale attempts since 10y ago; this cycle's ask has dropped $350k (12%) from the opening price — seller is motivated, your offer sets the floor, not the list.
Risks & watch-outs
- Watch-outs: flood insurance adds $427/mo; built in 1930 — expect roof / HVAC / electrical / plumbing capex.
- Climate carrying-cost: in FEMA flood zone AE (mandatory federal flood insurance); severe wind risk, 99% chance of damaging wind over 30y; extreme-heat days projected 8→31/yr by 2055 (HVAC capex compounding) — expect insurance premiums to compound above CPI over the hold.
Questions for the listing agent
- It's been on market 160 days. Have you received any prior offers? Is the seller open to a 12% concession, seller financing, or rate buy-down credit?
- Can we see the unit-by-unit rent roll, current vacancy, and any below-market leases? What's the average tenancy length?
- What capital expenditures (roof, boiler, parking lot, exteriors) have been made in the last 5 years, and what's planned in the next 2?
- Built in 1930 — when were the roof, HVAC, electrical panel, plumbing, and water heater last replaced?
- What's the actual annual flood-insurance premium (NFIP or private), and is the property in a SFHA with mandatory coverage?
- Why hasn't it sold? Are there any deal-killer items the seller is aware of (foundation, flood, title, zoning, code violations)?
- Is there a deadline driving the sale (1031 exchange, divorce, estate, relocation)? That informs how much negotiation room exists.
- Schools are A-rated — typically a magnet for longer-tenancy family renters. What's the average tenant stay here, and is there a school-zone premium baked into asking?
- What's the average days-on-market for RENTAL listings here right now (not sales)? A rising rental-DOM trend means longer vacancies and softer asking-rent achievability than the comps imply.
- What's the recent tenant-quality profile in this submarket — average credit score on applications, eviction rate, late-payment / NSF rate, and stable-employment percentage? A property-management company in the area should have these aggregated.
- How much new apartment / multifamily construction is in the pipeline within 1–3 miles? Heavy new supply (>2% of stock underway) typically softens rents 12–24 months out; light construction supports rent growth.
Investment metrics
- 1% rule
- 1.36% ✓
- Cap rate
- 11.11%
- Cash-on-cash
- 17.19%
- DSCR
- 1.77
- GRM
- 6.1
CMA / ARV
No comps found within radius.
Projected returns pro-forma
-2.19% appreciation · 0.0% rent growth · sell at horizon
- IRR
- 7.0%
- Equity multiple
- 1.28×
- Total profit
- $206,695
- Equity at exit
- $492,065
- IRR
- 12.3%
- Equity multiple
- 1.93×
- Total profit
- $691,740
- Equity at exit
- $399,164
Cash invested: $742,000 (down + closing). Projections, not guarantees.
Landlord ↔ Tenant lean methodology
- Overall (STATE)
- 87 Strongly Landlord-Friendly
- State Florida
- 87 Strongly Landlord-Friendly · R+3
- County
- — inherits STATE
- City
- — inherits STATE
ZIP-level market 33139
- Home prices YoY
- -0.8%
- Rents YoY
- -0.4%
- Active inventory
- 1216
- Price-to-rent
- 49.1×
Monthly cashflow live
- Estimated rent
- $35,998 medium interval (Pro) →
- Mortgage (P&I)
- −$13,897
- Tax from tax record
- −$2,805 /mo · $33,665/yr
- Insurance
- −$1,104
- Flood insurance flood zone
- −$427 /mo · $5,118/yr
- HOA
- −$0
- Vacancy / Maint / Mgmt
- −$7,560
- Net cashflow
- $10,205
Break-even live
Sensitivity live
| Price | -10% $11,705 | -5% $10,955 | +0% $10,205 | +5% $9,455 | +10% $8,705 |
|---|---|---|---|---|---|
| Rent | -10% $7,362 | -5% $8,783 | +0% $10,205 | +5% $11,627 | +10% $13,049 |
| Rate | -1.0pp $11,540 | -0.5pp $10,879 | base $10,205 | +0.5pp $9,519 | +1.0pp $8,820 |
8-unit breakdown (identical units grouped — click to expand)
| Units | Beds | Baths | Est. rent |
|---|---|---|---|
| 8× units | 2 | 1 | $36,000 |
| #1 | 2 | 1 | $4,500 |
| #2 | 2 | 1 | $4,500 |
| #3 | 2 | 1 | $4,500 |
| #4 | 2 | 1 | $4,500 |
| #5 | 2 | 1 | $4,500 |
| #6 | 2 | 1 | $4,500 |
| #7 | 2 | 1 | $4,500 |
| #8 | 2 | 1 | $4,500 |
| Total (8 units) | $35,998 | ||
UW: 25.0% down · 7.5% · 30yr · 1.5% tax · 5.0% vac · 8.0% maint · 8.0% mgmt
Financing live
Cash to close
- Down payment
- $662,500
- Closing costs
- $79,500
- Reserves months
- —
- Total cash needed
- —
Loan-product check · same deal, 3 products live
Conventional
25% down · 7.5% · 30yr
- Down + closing
- —
- Monthly P&I
- —
- Monthly cashflow
- —
- DSCR
- —
- Eligible?
- —
Personal DTI + credit; lowest rate.
DSCR
20% down · 8.5% · 30yr
- Down + closing
- —
- Monthly P&I
- —
- Monthly cashflow
- —
- DSCR
- —
- Eligible?
- —
No personal income docs; deal must DSCR.
Hard money
10% down · 12.0% · 12mo
- Down + closing
- —
- Monthly P&I
- —
- Monthly cashflow
- —
- DSCR
- —
- Eligible?
- —
Short-term bridge; refi at stabilization.
Rent comps 1 comps
| Address | Beds | Baths | Sqft | Rent | $/sqft | DOM | Units | Dist |
|---|---|---|---|---|---|---|---|---|
| 2501 Pine Tree Dr Miami Beach, FL | 7.0 | 6.5 | 4530 | $20,000 | $4.42 | 25d | 1 | 1.10mi |
Listing history 25 events
-
2026-06-21days on market $2,650,000 Active 160 DOM
-
2026-06-18days on market $2,650,000 Active 157 DOM
-
2026-06-17days on market $2,650,000 Active 156 DOM
-
2026-06-16days on market $2,650,000 Active 155 DOM
-
2026-06-15days on market $2,650,000 Active 154 DOM
-
2026-06-13days on market $2,650,000 Active 152 DOM
-
2026-06-09days on market $2,650,000 Active 148 DOM
-
2026-06-08days on market $2,650,000 Active 147 DOM
-
2026-06-07days on market $2,650,000 Active 146 DOM
-
2026-06-04days on market $2,650,000 Active 143 DOM
-
2026-06-03days on market $2,650,000 Active 142 DOM
-
2026-06-02days on market $2,650,000 Active 141 DOM
-
2026-06-01days on market $2,650,000 Active 140 DOM
-
2026-05-31days on market $2,650,000 Active 139 DOM
-
2026-03-27price $2,650,000
-
2026-01-12$3,000,000 Active
-
2022-06-22price $2,300
-
2021-10-12soldstatus $2,500,000
-
2017-10-16soldstatus $1,150,000
-
2016-11-11historical
-
2016-11-11historical
-
2016-11-08$2,850,000 Active
-
2016-07-04$2,850,000
-
2007-06-20soldstatus $2,340,000
-
1998-02-12soldstatus $385,000
ⓘ Source: listings_history table (triggers on properties + properties_extension) + one-shot
backfill from property_details.listing_events for pre-trigger history.
Tax reassessment forecast FL · Resets to sale price
- Current annual tax
- $33,665 · $2,805/mo
- Projected year-2 tax
- $33,665 · $2,805/mo
- Expected delta
- $0/yr ($0/mo · 0.0%)
ⓘ Screening estimate from a state-policy table — verify with the county assessor before closing.
Climate risk First Street
- Flood 9/10 Extreme FEMA zone AE · 99% chance over 30 yrs
- Wildfire 3/10 Moderate
- Heat 10/10 Extreme 8 d/yr ≥101°F today · 31 d/yr by 30 yrs out
- Wind 10/10 Extreme 99% chance of damaging wind over 30 yrs
- Air quality 2/10 Low 1 unhealthy d/yr today · 1 by 30 yrs out
Nearby sold comps map
Loading sold comps map…
Walkable amenities ~0.75 mi
Loading nearby amenities…
Taxation est. · year 1
- Rental income
- $431,976
- − Mortgage interest
- −$148,441
- − Property taxes
- −$33,665
- − Insurance
- −$18,368
- − Repairs & maintenance
- −$34,558
- − Management
- −$34,558
- − Depreciation
- −$77,091
- Taxable income
- $85,294
- Est. tax owed @ 24.0%
- −$20,471
- After-tax cash flow
- $101,994/yr
For passive investors: Depreciation is non-cash, so a rental often shows a tax loss while cash-flowing — sheltering income. Rental losses are passive: they offset passive income freely, and up to $25,000/yr can offset ordinary (W-2) income if you actively participate and your MAGI is under $100k (phasing out to $0 by $150k); unused losses carry forward. On sale, claimed depreciation is recaptured at up to 25%, and gains may owe capital-gains tax (a 1031 exchange can defer both). Figures are a year-1 estimate at your 24.0% rate — not tax advice; consult a CPA.
Schools (NCES district)
- District
- Miami-Dade
- NCES district ID
- 1200390
- Math proficiency
- 45% ▼ -16.00%
- Reading proficiency
- 54% ▼ -5.00%
- Median HH income
- $43,928
- Composite
- 41.76/100
- National rank
- #3397
- State rank
- #40 of 73 in FL
Livability — Miami Beach
- Score
- 80/100
- State rank
- #108
- US rank
- #1672
Category grades
Schools grade is shown separately in the Schools card above.
Census & demographics
- Census place
- Miami Beach, FL
- County
- Miami-Dade County · 2,697,751 people
- City population
- 90,533
- Metro
- Miami-Fort Lauderdale-Pompano Beach, FL
- Population (ZIP)
- 33,753
- Household income
- $69,793
- Rent vs Own
- Severe rent burden
- 4052.0
Population outlook (Miami-Dade County) Hauer SSP2
- Today (2025)
- 3,126,439 people
- By 2030
- 3,325,765 · +6.4%
- By 2040
- 3,697,561 · +18.3%
- By 2050
- 4,012,134 · +28.3%
- By 2075
- 4,605,612 · +47.3%
- By 2100
- 4,866,598 · +55.7%
Race, ethnicity, and origin ACS 2023
- Neighborhood character
- Diverse neighborhood (Simpson 0.58)
- Race & ethnicity
- Hispanic / Latino 51% White 40% Two or more races 17% Black 4% Asian 3%
- Hispanic origin (detail)
- Mexican 2% Puerto Rican 2% Cuban 15% Salvadoran 3%
- Common ancestry
- Lithuanian 3% Scotch-Irish 2% Romanian 2%
- Foreign-born
- 56% · Canada, Jamaica, Dominican Republic
- Languages at home
- 37% English-only · Spanish 49% Other Indo-European 5% French/Haitian/Cajun 3%
Political lean MEDSL · Miami-Dade
- 2024 margin
- R (+11.4) · D 43.9% · R 55.4%
- 2008→2024 swing
- -27.6pp toward R · 2008: 16.1pp · 2024: -11.4pp
- All cycles
- 2024: R+11.4 2020: D+7.3 2016: D+29.6 2012: D+23.7 2008: D+16.1
Not yet ingested
- Civics
- —
Market trends
- HPI YoY
- ▼ -2.19%
- Current HPI
- 277.9321
- Rent YoY
- ▼ -0.36%
- Metro
- Miami-Fort Lauderdale-Pompano Beach, FL
- State GDP YoY
- ▲ 3.28%
- F500 in state
- 36
Industry mix (Fortune 500 HQ in FL)
| Industry | F500 HQs | Revenue |
|---|---|---|
| Industrial Technology | 2 | $29B |
|
||
| Insurance | 2 | $17B |
|
||
| Retail | 1 | $60B |
|
||
| Technology Distribution | 1 | $58B |
|
||
| Homebuilding | 1 | $35B |
|
||
| Technology Manufacturing | 1 | $35B |
|
||
Price history
+588.3% since first listed11 events — show timeline
- 2026-03-27 Price Changed $2,650,000 MARMLS
- 2026-01-12 Listed $3,000,000 MARMLS
- 2022-06-22 Price Changed $2,300 RENT.
- 2021-10-12 Sold (Public Records) $2,500,000 Public Records
- 2017-10-16 Sold (Public Records) $1,150,000 Public Records
- 2016-11-11 Listing Removed — MARMLS
- 2016-11-11 Listing Removed — MARMLS
- 2016-11-08 Listed $2,850,000 MARMLS
- 2016-07-04 Listed $2,850,000 MARMLS
- 2007-06-20 Sold (Public Records) $2,340,000 Public Records
- 1998-02-12 Sold (Public Records) $385,000 Public Records
Property tax history
+4.1%/yrLatest (2025): $33,665 · -9.6% YoY. Source: county tax records.
Cash-flow waterfall
monthlySold comps — $/sqft
last 12 mo · ≤1 miLoading sold comps…