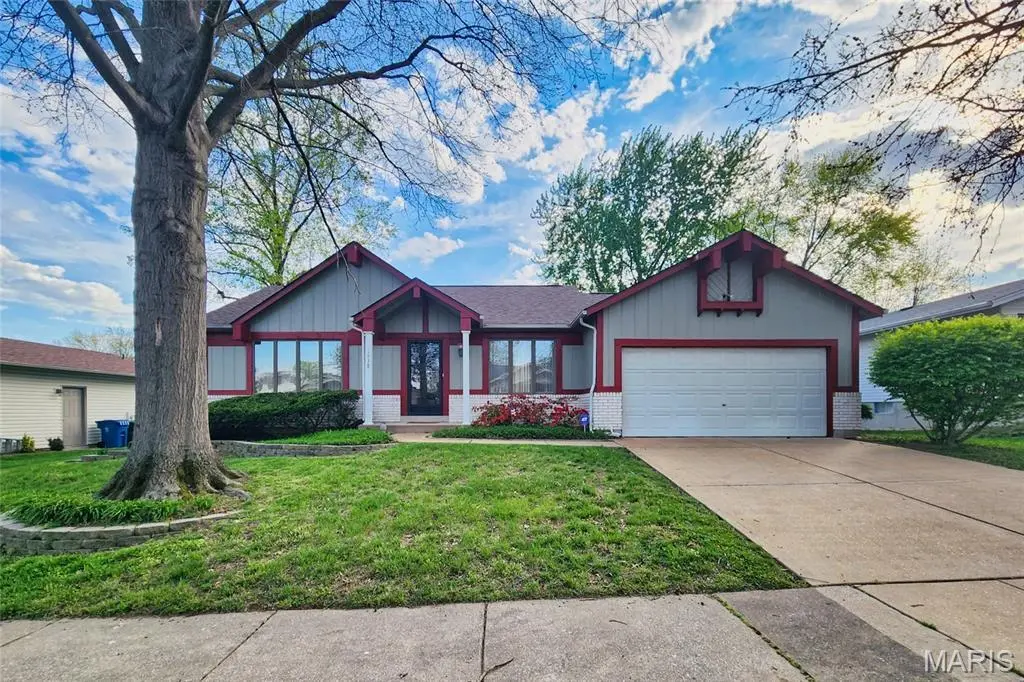
1938 Riverwood Trails Dr · Hazelwood, MO
Flood risk 1/10 · Minimal
- FEMA flood zone
- X (unshaded)
- Chance of flooding over 30 yrs
- 0.0%
- Est. flood insurance / yr
- $473 – $860
Fire risk 1/10 · Minimal
- Est. fire insurance / yr
- $1,054 – $1,958
Heat risk 4/10 · Minor
- Hot days now (above 106°F)
- 7 days/yr
- Hot days in 30 yrs
- 21 days/yr
Wind risk 2/10 · Minimal
- Chance of severe wind over 30 yrs
- 1.0%
Air-quality risk 2/10 · Minimal
- Unhealthy air days now
- 2 days/yr
- Unhealthy air days in 30 yrs
- 2 days/yr
Risk factors via First Street. Map © Google.
Why this score? — see what drove the D grade
The composite is a weighted blend of 9 inputs, each scored 0–100. Each bar is that input's sub-score; the figure is the points it added to the 100-point composite (weight × sub-score).
- Cash flow +13.6/30.0
- ARV discount +11.0/15.0
- DSCR +4.1/10.0
- 1% rule +4.0/10.0
- Rent growth +3.6/5.0
- Livability +3.1/5.0
- Condition / age +2.5/5.0
- Schools +1.7/10.0
- Appreciation +0.0/10.0
$205,000
🖨 Deal sheet (PDF) 📄 Offer letter ✓ Due diligence
Listing remarks
Discover this spacious ranch style home in desirable Riverwood Trails. The main level features an open floor plan. The great room features a gas fireplace and bookcases. There is a separate formal dining room. The well-designed kitchen includes a breakfast bar, pantry, and all appliances remain. Main-floor laundry is off the kitchen. All bedrooms are generously sized. Primary suite offers double closets and full bath. The finished lower level walks out to the yard via sliders and includes a bedroom, full bath, workshop and former recording studio—perfect for guests, teens, or in-laws. An oversized garage provides extra storage. This home has been well maintained and sellers will ensu
Key facts
- Open floor plan
- Formal dining room
- Gas fireplace
Tags
Property features AI
Finance
- HOA & community: Riverwood Trails HOA — $155 annually (includes common area maintenance)
Exterior
- Parking: 2-car garage (attached)
- Utilities: Public water; Public sewer; Electric service by Ameren; Cable available
- Home design: Single family residence; Attached property; One level
- Construction: Brick veneer and stone veneer exterior; Architectural shingle roof; Has basement — full, partially finished with concrete floor, exterior entry, bathroom and sump pump
- Exterior features: Deck; Back yard; Front yard; Level lot
Interior
- Kitchen: Dishwasher; Disposal; Microwave; Built-in gas range; Refrigerator
- Bedrooms: 4 bedrooms total — 3 on the main level, 1 in the lower level
- Bathrooms: 3 full bathrooms — 2 on the main level, 1 in the lower level
- Heating & cooling: Forced air heating; Central air conditioning; Attic fan
- Interior features: Bookcases; Breakfast bar; Ceiling fans; Open floorplan; Gas fireplace
- Laundry & utility: Main-level laundry room
Neighborhood map
What this means for you Summary
Snapshot
- This is a 3-bed/2.0-bath single-family listed at $205k.
Deal economics
- At list price, monthly cash flow is $10 ($115/yr) — positive.
- The deal already cash-flows at list — no discount required.
- To meet the 1% rule (rent ≥ 1% of price), the offer needs to be $184k (10.3% below list).
- Recommended offer: $184k (10.3% below list) — sets the bar for 1% rule.
Location & tenants
- Location reads 62/100 on livability (#395 in MO) — a middle-class / working-renter tenant base. Strengths: cost of living A+, housing A+; Watch: crime F, amenities F, commute F.
- Hazelwood (suburban): math 11% / reading 26% proficiency, ranked #306 of 324 in MO (top 94%) — low school quality limits family demand, transient renter base, plan for 1-2y turnover.
- Zoned schools: Russell Elem. (math 12% / reading 37%, grade F, #879 of 1,115 statewide, top 81%, 409 students, 49% FRL); Hazelwood West High (math 16% / reading 42%, grade F, #407 of 521 statewide, top 78%, 2,042 students, 54% FRL) — zoned schools at 52% FRL track the district average.
- Market conditions: Rents rising fast (+4.3%/yr); 271 active listings in the ZIP; 15 comparable units currently listed for rent nearby; rentals at typical pace (median 15d on market — plan ~3-4 weeks tenant-placement turnaround); 920 units permitted in St. Louis County in 2024 (250 in 5+ unit buildings).
- This rent runs 31% of the median local income ($71k/yr) — at the standard rent-burdened threshold; future hikes will face affordability resistance.
Forward outlook
- Local home prices are declining (-3.0%/yr); year-one equity from $1k of loan paydown is wiped out by about $6k of value loss. Plan a longer hold.
Negotiation context
- It's been on market 17 days — a 2% lower offer ($202k) is reasonable based on typical stale-listing flexibility.
- Current owner paid $148k; 39% above their basis — modest negotiation headroom, anchor on the comps not their cost.
Questions for the listing agent
- Built in 1978 — when were the roof, HVAC, electrical panel, plumbing, and water heater last replaced?
- What does the HOA fee cover, when was the last increase, and are there any pending special assessments or reserve-fund shortfalls?
- Is there a deadline driving the sale (1031 exchange, divorce, estate, relocation)? That informs how much negotiation room exists.
- Schools are D-rated, which usually means shorter tenancies and higher turnover. Who's the typical renter profile here, and what's been the actual vacancy rate?
- Crime grade is F in this area — have there been break-ins, vandalism, or insurance claims at this property in the last 3 years? What carrier currently insures it and at what premium?
- The area grade is low — what's the realistic commute time and amenity access for the typical tenant pool here? Any planned neighborhood developments (good or bad) we should know about?
- What's the average days-on-market for RENTAL listings here right now (not sales)? A rising rental-DOM trend means longer vacancies and softer asking-rent achievability than the comps imply.
- What's the recent tenant-quality profile in this submarket — average credit score on applications, eviction rate, late-payment / NSF rate, and stable-employment percentage? A property-management company in the area should have these aggregated.
- How much new for-sale + rental construction is in the pipeline within 1–3 miles? Heavy new supply typically softens prices + rents 12–24 months out; constrained supply supports both.
Investment metrics
- 1% rule
- 0.90% ✗
- Cap rate
- 6.35%
- Cash-on-cash
- 0.20%
- DSCR
- 1.01
- GRM
- 9.3
CMA / ARV
- ARV (on-the-fly)
- $222,376
- Comps found
- 12
Show comp detail 12 sales within ~0.75 mi
| Address | Dist | Beds/Ba | Sqft | Sold | Price | $/sf | Match |
|---|---|---|---|---|---|---|---|
| 1938 Riverwood Trails Dr | 0.00mi | 4/3.0 (+1) | 1,672 (0%) | 0mo | $205,000 | $123 | 91 |
| 1640 Tahoe Dr | 0.14mi | 3/2.0 | 1,717 (+3%) | 1mo | $228,000 | $133 | 88 |
| 1528 Coachway Ln | 0.22mi | 3/2.0 | 1,686 (+1%) | 3mo | $209,500 | $124 | 86 |
| 39 Radford Dr | 0.46mi | 3/1.0 | 1,652 (-1%) | 2mo | $194,900 | $118 | 71 |
| 1013 Driftwood Trails Dr | 0.22mi | 3/2.5 | 1,822 (+9%) | 3mo | $279,989 | $154 | 70 |
| 630 Lamplight Ln | 0.63mi | 3/3.0 | 1,647 (-2%) | 2mo | $195,500 | $119 | 62 |
| 1125 Florland Dr | 0.47mi | 3/3.0 | 1,482 (-11%) | 1mo | $229,900 | $155 | 54 |
| 1466 El Camino Dr | 0.72mi | 3/1.5 | 1,556 (-7%) | 1mo | $215,000 | $138 | 52 |
| 7057 Howdershell Rd | 0.75mi | 3/2.0 | 1,559 (-7%) | 3mo | $209,900 | $135 | 52 |
| 17 Glynn Dr | 0.64mi | 3/2.0 | 1,509 (-10%) | 3mo | $139,900 | $93 | 51 |
| 525 Fox Crest Dr | 0.58mi | 3/2.0 | 1,922 (+15%) | 2mo | $239,900 | $125 | 46 |
| 770 Kostka Ln | 0.62mi | 3/1.5 | 1,444 (-14%) | 1mo | $199,900 | $138 | 46 |
Match score weights: distance 35% · size 25% · config 20% · recency 20%. Top-matched comps best support the ARV.
Projected returns pro-forma
-3.0% appreciation · 4.27% rent growth · sell at horizon
- IRR
- -14.5%
- Equity multiple
- 0.47×
- Total profit
- $-30,184
- Equity at exit
- $30,566
- IRR
- -3.8%
- Equity multiple
- 0.73×
- Total profit
- $-15,300
- Equity at exit
- $17,725
Cash invested: $57,400 (down + closing). Projections, not guarantees.
Landlord ↔ Tenant lean methodology
- Overall (STATE)
- 81 Strongly Landlord-Friendly
- State Missouri
- 81 Strongly Landlord-Friendly · R+10
- County
- — inherits STATE
- City
- — inherits STATE
ZIP-level market 63031
- Rents YoY
- 4.3%
- Active inventory
- 271
- Price-to-rent
- 9.3×
Monthly cashflow live
- Estimated rent
- $1,839 high interval (Pro) →
- Mortgage (P&I)
- −$1,075
- Tax from tax record
- −$269 /mo · $3,233/yr
- Insurance
- −$85
- HOA
- −$13
- Vacancy / Maint / Mgmt
- −$386
- Net cashflow
- $10
Break-even live
Sensitivity live
| Price | -10% $126 | -5% $68 | +0% $10 | +5% $-48 | +10% $-106 |
|---|---|---|---|---|---|
| Rent | -10% $-136 | -5% $-63 | +0% $10 | +5% $82 | +10% $155 |
| Rate | -1.0pp $113 | -0.5pp $62 | base $10 | +0.5pp $-44 | +1.0pp $-98 |
UW: 25.0% down · 7.5% · 30yr · 1.5% tax · 5.0% vac · 8.0% maint · 8.0% mgmt
Financing live
Cash to close
- Down payment
- $51,250
- Closing costs
- $6,150
- Reserves months
- —
- Total cash needed
- —
Loan-product check · same deal, 3 products live
Conventional
25% down · 7.5% · 30yr
- Down + closing
- —
- Monthly P&I
- —
- Monthly cashflow
- —
- DSCR
- —
- Eligible?
- —
Personal DTI + credit; lowest rate.
DSCR
20% down · 8.5% · 30yr
- Down + closing
- —
- Monthly P&I
- —
- Monthly cashflow
- —
- DSCR
- —
- Eligible?
- —
No personal income docs; deal must DSCR.
Hard money
10% down · 12.0% · 12mo
- Down + closing
- —
- Monthly P&I
- —
- Monthly cashflow
- —
- DSCR
- —
- Eligible?
- —
Short-term bridge; refi at stabilization.
Rent comps 15 comps
| Address | Beds | Baths | Sqft | Rent | $/sqft | DOM | Units | Dist |
|---|---|---|---|---|---|---|---|---|
| 750 Carriage Ln Hazelwood, MO | 4.0 | 2.0 | 1701 | $2,026 | $1.19 | 12d | 1 | 0.51mi |
| 14 Rivermeadows Dr Florissant, MO | 3.0 | 2.0 | 1587 | $2,386 | $1.50 | 15d | 1 | 0.61mi |
| 17 Elwood Ct Florissant, MO | 3.0 | 2.0 | 1572 | $1,945 | $1.24 | 2d | 1 | 0.70mi |
| 785 Florland Dr Florissant, MO | 3.0 | 1.0 | 1100 | $1,700 | $1.55 | 18d | 1 | 0.70mi |
| 623 Holiday Ave Hazelwood, MO | 3.0 | 2.0 | 1176 | $1,591 | $1.35 | 13d | 1 | 0.71mi |
| 537 Lynn Haven Ln Hazelwood, MO | 3.0 | 2.0 | 1242 | $1,675 | $1.35 | 24d | 1 | 0.71mi |
| 855 Teson Rd Hazelwood, MO | 3.0 | 2.0 | 1562 | $1,799 | $1.15 | 18d | 1 | 0.84mi |
| 240 Chez Vant Ct Hazelwood, MO | 2.0 | 1.5 | 1440 | $1,350 | $0.94 | 44d | 1 | 1.14mi |
| 16 Mary Rose Ct Hazelwood, MO | 3.0 | 2.0 | 1506 | $1,706 | $1.13 | 15d | 1 | 1.17mi |
| 9 Charlotte Dr Florissant, MO | 3.0 | 1.5 | 1404 | $1,641 | $1.17 | 5d | 1 | 1.24mi |
| 2245 Lindsay Ln Florissant, MO | 4.0 | 2.0 | 1466 | $1,800 | $1.23 | 16d | 1 | 1.36mi |
| 116 Graham Rd Florissant, MO | 3.0 | 2.0 | 1578 | $1,495 | $0.95 | 2d | 1 | 1.41mi |
| 2400 Teakwood Manor Dr Florissant, MO | 3.0 | 2.0 | 1380 | $1,725 | $1.25 | 44d | 1 | 1.45mi |
| 4 Sharon Ct Florissant, MO | 3.0 | 2.0 | 1108 | $1,800 | $1.62 | 2d | 1 | 1.49mi |
| 1095 Cedar Pl Florissant, MO | 3.0 | 1.5 | 1107 | $1,710 | $1.54 | 2d | 1 | 1.49mi |
HOA detail
- Monthly dues
- $13 · $156/yr
- Likely covers
- gas
Listing history 5 events
-
2026-05-13historical Active Under Contract
-
2026-05-09$205,000 Active
-
2002-04-02soldstatus $147,500
-
1998-11-23soldstatus $111,500
-
1992-12-07soldstatus
ⓘ Source: listings_history table (triggers on properties + properties_extension) + one-shot
backfill from property_details.listing_events for pre-trigger history.
Tax reassessment forecast MO · Resets to sale price
- Current annual tax
- $3,233 · $269/mo
- Projected year-2 tax
- $3,233 · $269/mo
- Expected delta
- $0/yr ($0/mo · 0.0%)
ⓘ Screening estimate from a state-policy table — verify with the county assessor before closing.
Climate risk First Street
- Flood 1/10 Low FEMA zone X (unshaded) · 0% chance over 30 yrs
- Wildfire 1/10 Low
- Heat 4/10 Moderate 7 d/yr ≥106°F today · 21 d/yr by 30 yrs out
- Wind 2/10 Low 100% chance of damaging wind over 30 yrs
- Air quality 2/10 Low 2 unhealthy d/yr today · 2 by 30 yrs out
Nearby sold comps map
Loading sold comps map…
Walkable amenities ~0.75 mi
Loading nearby amenities…
Taxation est. · year 1
- Rental income
- $22,063
- − Mortgage interest
- −$11,483
- − Property taxes
- −$3,233
- − Insurance
- −$1,025
- − Repairs & maintenance
- −$1,765
- − Management
- −$1,765
- − HOA
- −$156
- − Depreciation
- −$5,964
- Taxable loss
- −$3,328
- Est. tax savings @ 24.0%
- +$799
- After-tax cash flow
- $914/yr
For passive investors: Depreciation is non-cash, so a rental often shows a tax loss while cash-flowing — sheltering income. Rental losses are passive: they offset passive income freely, and up to $25,000/yr can offset ordinary (W-2) income if you actively participate and your MAGI is under $100k (phasing out to $0 by $150k); unused losses carry forward. On sale, claimed depreciation is recaptured at up to 25%, and gains may owe capital-gains tax (a 1031 exchange can defer both). Figures are a year-1 estimate at your 24.0% rate — not tax advice; consult a CPA.
Schools (NCES district)
- District
- Hazelwood
- NCES district ID
- 2913830
- Math proficiency
- 11% ▼ -13.00%
- Reading proficiency
- 26% ▼ -6.00%
- Median HH income
- $51,621
- Composite
- 16.77/100
- National rank
- #9156
- State rank
- #306 of 324 in MO
Livability — Hazelwood
- Score
- 62/100
- State rank
- #395
- US rank
- #16956
Category grades
Schools grade is shown separately in the Schools card above.
Census & demographics
- Census place
- Hazelwood, MO
- County
- Saint Louis County · 888,823 people
- City population
- 17,813
- Metro
- St. Louis, MO-IL
- Population (ZIP)
- 50,196
- Household income
- $70,811
- Rent vs Own
- Severe rent burden
- 1279.0
Population outlook (St. Louis County) Hauer SSP2
- Today (2025)
- 1,025,227 people
- By 2030
- 1,028,023 · +0.3%
- By 2040
- 1,020,940 · -0.4%
- By 2050
- 1,007,280 · -1.8%
- By 2075
- 987,277 · -3.7%
- By 2100
- 921,984 · -10.1%
Race, ethnicity, and origin ACS 2023
- Neighborhood character
- Diverse neighborhood (Simpson 0.58)
- Race & ethnicity
- White 49% Black 41% Two or more races 7% Hispanic / Latino 2%
- Common ancestry
- Romanian 3% Lithuanian 3% Swedish 1%
- Foreign-born
- 5% · Canada, Jamaica
- Languages at home
- 94% English-only · Spanish 2% Arabic 1%
Political lean MEDSL · St. Louis
- 2024 margin
- Strong D (+23.4) · D 60.8% · R 37.4% · Other 1.7%
- 2008→2024 swing
- +3.5pp toward D · 2008: 19.9pp · 2024: 23.4pp
- All cycles
- 2024: D+23.4 2020: D+24.0 2016: D+16.2 2012: D+13.7 2008: D+19.9
Not yet ingested
- Civics
- —
Market trends
- HPI YoY
- ▼ -223.57%
- Current HPI
- 202.7192
- Rent YoY
- ▲ 4.27%
- Metro
- St. Louis, MO-IL
- State GDP YoY
- ▲ 1.84%
- F500 in state
- 20
Industry mix (Fortune 500 HQ in MO)
| Industry | F500 HQs | Revenue |
|---|---|---|
| Healthcare | 1 | $163B |
|
||
| Insurance | 1 | $21B |
|
||
| Industrial Technology | 1 | $17B |
|
||
| Retail | 1 | $16B |
|
||
| Industrial Distribution | 1 | $10B |
|
||
| Utilities | 1 | $9B |
|
||
Price history
+83.9% since first listed5 events — show timeline
- 2026-05-13 Contingent — MARIS as Distributed by MLS Grid
- 2026-05-09 Listed $205,000 MARIS as Distributed by MLS Grid
- 2002-04-02 Sold (Public Records) $147,500 Public Records
- 1998-11-23 Sold (Public Records) $111,500 Public Records
- 1992-12-07 Sold (Public Records) — Public Records
Property tax history
+2.5%/yrLatest (2022): $3,233 · +1.7% YoY. Source: county tax records.
Cash-flow waterfall
monthlySold comps — $/sqft
last 12 mo · ≤1 miLoading sold comps…