 Triplex
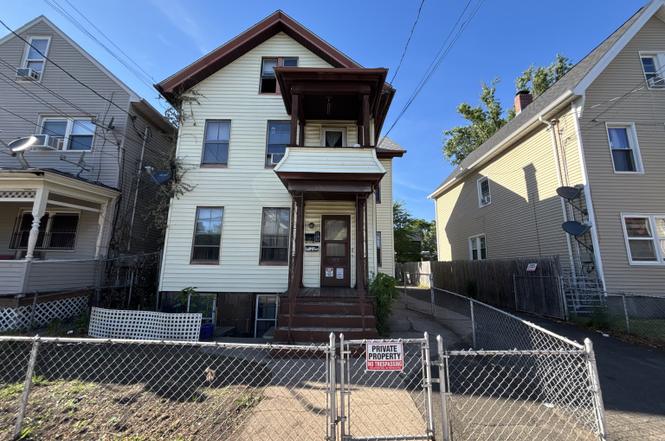
473 Lombard St · New Haven, CT
Flood risk 1/10 · Minimal
- FEMA flood zone
- X (unshaded)
- Chance of flooding over 30 yrs
- 0.0%
- Est. flood insurance / yr
- $473 – $860
Fire risk 1/10 · Minimal
- Est. fire insurance / yr
- $829 – $1,539
Heat risk 7/10 · Major
- Hot days now (above 99°F)
- 7 days/yr
- Hot days in 30 yrs
- 16 days/yr
Wind risk 6/10 · Moderate
- Chance of severe wind over 30 yrs
- 56.0%
Air-quality risk 5/10 · Moderate
- Unhealthy air days now
- 6 days/yr
- Unhealthy air days in 30 yrs
- 8 days/yr
Risk factors via First Street. Map © Google.
Why this score? — see what drove the B+ grade
The composite is a weighted blend of 9 inputs, each scored 0–100. Each bar is that input's sub-score; the figure is the points it added to the 100-point composite (weight × sub-score).
- Cash flow +30.0/30.0
- ARV discount +15.0/15.0
- 1% rule +10.0/10.0
- DSCR +10.0/10.0
- Livability +4.0/5.0
- Rent growth +3.5/5.0
- Condition / age +2.5/5.0
- Schools +1.5/10.0
- Appreciation +0.0/10.0
$355,000
🖨 Deal sheet (PDF) 📄 Offer letter ✓ Due diligence
Multi-family units
County records classify this as Multi-Family (2-4 Unit). Listing-text estimate: 3 units. confirmed
Listing remarks
Don't miss this fully occupied 3-family property at 473 Lombard Street in New Haven. This income-producing investment features three occupied units, offering immediate rental income from day one. A minimum of 24-hour notice is required for all showings, and access to each unit will be coordinated accordingly. The property is serviced by natural gas, public water, and public sewer. While the building offers tremendous investment potential, it does require repairs and updates. The property will not qualify for FHA financing and is being sold strictly "As Is. " Any inspections conducted will be for informational purposes only. Cash offers are strongly preferred. Whether you're lookin
Key facts
- 4,791 sq ft lot
- 6 parking spots
- Built 1900
Property features AI
Finance
- Other: Located in New Haven County, Connecticut; Near commuter bus service and walkable to bus lines
- Financial info: Multi-family investment property (3 units)
- HOA & community: No HOA information provided
Exterior
- Parking: Paved areas, parking lot, and on-street parking available; 6 total parking spaces
- Security: No security details provided
- Utilities: Public water connected; Public sewer connected; Natural gas hot water and heat
- Home design: Multi-family property (3-family)
- Construction: Frame construction; Concrete foundation
- Exterior features: Level lot; Shingle exterior siding; Asphalt shingle roof
Interior
- Kitchen: No kitchen appliance details provided
- Bedrooms: 6 bedrooms total (across units)
- Flooring: No flooring details provided
- Bathrooms: 3 full bathrooms
- Heating & cooling: Gas heating (natural gas); Window unit cooling; 50-gallon hot water tank
- Interior features: 12 total rooms; Basement is full, partially finished, and has a walk-out; Attic present with storage space, finished area, and walk-up access; Window unit cooling
- Laundry & utility: Basement laundry hook-ups
Neighborhood map
What this means for you Summary
Snapshot
- This is a 3 × 2-bed/1.0-bath units multifamily listed at $355k.
Deal economics
- At list price, monthly cash flow is $2k ($26k/yr) — positive. Per door: $733/mo.
- The deal already cash-flows at list — no discount required.
- Meets the 1% rule at list price ($6k rent vs $355k).
- Cap rate 13.7% vs local median 4.6% in New Haven — top-decile yield for the area; either an underpriced asset or a hidden risk that comps aren't pricing in. Stress-test before assuming the spread holds.
Location & tenants
- Location reads 79/100 on livability (#31 in CT, #2,190 nationally) — a middle-class / working-renter tenant base. Strengths: amenities A+, commute A+, health & safety A+; Watch: employment D, crime F.
- New Haven School District (urban): math 12% / reading 25% proficiency, ranked #147 of 153 in CT (top 96%) — low school quality limits family demand, transient renter base, plan for 1-2y turnover; 66% free/reduced lunch — lower-income household profile, screen leases tightly.
- Zoned schools: Betsy Ross Arts Magnet School (math 12% / reading 27%, grade F, #161 of 175 statewide, top 93%, 327 students, 70% FRL) — zoned schools at 70% FRL track the district average.
- Market conditions: Rents rising fast (+4.1%/yr); 102 active listings in the ZIP; 40 comparable units currently listed for rent nearby; rentals at typical pace (median 26d on market — plan ~3-4 weeks tenant-placement turnaround); 45% of comp listings sitting > 30 days — soft ceiling on asking rent; 1,059 units permitted in South Central Connecticut Planning Region in 2024 (779 in 5+ unit buildings).
- At $5,876/mo this rent would consume 145% of the median local household income ($48k/yr) (locally 2664% of renters already pay >50% of income on rent) — very limited rent-growth headroom before tenants either downsize or default.
Forward outlook
- Local home prices are declining (-3.0%/yr); year-one equity from $2k of loan paydown is wiped out by about $11k of value loss. Plan a longer hold.
- At projected returns (-3.0% appreciation + 4.1% rent growth), your $99k cash investment doubles in ~5 years — after that, you're playing with house money.
Negotiation context
- Only 5 days on market — expect competitive offers; lowballing is unlikely to land.
Risks & watch-outs
- Watch-outs: built in 1900 — expect roof / HVAC / electrical / plumbing capex.
- Climate carrying-cost: major wind risk, 56% chance of damaging wind over 30y; extreme-heat days projected 7→16/yr by 2055 (HVAC capex compounding) — expect insurance premiums to compound above CPI over the hold.
Questions for the listing agent
- Can we see the unit-by-unit rent roll, current vacancy, and any below-market leases? What's the average tenancy length?
- What capital expenditures (roof, boiler, parking lot, exteriors) have been made in the last 5 years, and what's planned in the next 2?
- Built in 1900 — when were the roof, HVAC, electrical panel, plumbing, and water heater last replaced?
- Is there a deadline driving the sale (1031 exchange, divorce, estate, relocation)? That informs how much negotiation room exists.
- Schools are D-rated, which usually means shorter tenancies and higher turnover. Who's the typical renter profile here, and what's been the actual vacancy rate?
- Crime grade is F in this area — have there been break-ins, vandalism, or insurance claims at this property in the last 3 years? What carrier currently insures it and at what premium?
- What's the average days-on-market for RENTAL listings here right now (not sales)? A rising rental-DOM trend means longer vacancies and softer asking-rent achievability than the comps imply.
- What's the recent tenant-quality profile in this submarket — average credit score on applications, eviction rate, late-payment / NSF rate, and stable-employment percentage? A property-management company in the area should have these aggregated.
- How much new apartment / multifamily construction is in the pipeline within 1–3 miles? Heavy new supply (>2% of stock underway) typically softens rents 12–24 months out; light construction supports rent growth.
Investment metrics
- 1% rule
- 1.66% ✓
- Cap rate
- 13.72%
- Cash-on-cash
- 26.54%
- DSCR
- 2.18
- GRM
- 5.0
CMA / ARV
- ARV (on-the-fly)
- $479,544
- Comps found
- 8
Show comp detail 8 sales within ~0.75 mi
| Address | Dist | Beds/Ba | Sqft | Sold | Price | $/sf | Match |
|---|---|---|---|---|---|---|---|
| 439 Lombard St | 0.05mi | 4/2.0 (+1) | 1,996 (-3%) | 4mo | $440,000 | $220 | 80 |
| 335 Blatchley Ave | 0.23mi | 4/2.0 (+1) | 2,180 (+6%) | 20mo | $293,000 | $134 | 54 |
| 44 Clark St | 0.74mi | 2/2.0 (-1) | 1,968 (-5%) | 8mo | $585,000 | $297 | 42 |
| 255 Front St | 0.65mi | 4/2.0 (+1) | 2,160 (+4%) | 14mo | $575,000 | $266 | 41 |
| 34 NASH St | 0.51mi | 4/2.5 (+1) | 2,361 (+14%) | 15mo | $600,000 | $254 | 32 |
| 276 Front St | 0.66mi | 4/2.5 (+1) | 1,872 (-9%) | 22mo | $365,000 | $195 | 29 |
| 187 Wolcott St | 0.60mi | 4/2.0 (+1) | 1,812 (-12%) | 18mo | $270,000 | $149 | 27 |
| 685 Orange St | 0.75mi | 2/2.0 (-1) | 2,265 (+10%) | 16mo | $525,000 | $232 | 27 |
Match score weights: distance 35% · size 25% · config 20% · recency 20%. Top-matched comps best support the ARV.
Projected returns pro-forma
-3.0% appreciation · 4.12% rent growth · sell at horizon
- IRR
- 21.6%
- Equity multiple
- 1.90×
- Total profit
- $89,248
- Equity at exit
- $52,932
- IRR
- 30.5%
- Equity multiple
- 3.88×
- Total profit
- $286,426
- Equity at exit
- $30,694
Cash invested: $99,400 (down + closing). Projections, not guarantees.
Landlord ↔ Tenant lean methodology
- Overall (STATE)
- 27 Tenant-Leaning
- State Connecticut
- 27 Tenant-Leaning · D+7
- County
- — inherits STATE
- City
- — inherits STATE
ZIP-level market 06513
- Home prices YoY
- -7.8%
- Rents YoY
- 4.1%
- Active inventory
- 102
- Price-to-rent
- 15.1×
Monthly cashflow live
- Estimated rent
- $5,876 high interval (Pro) →
- Mortgage (P&I)
- −$1,862
- Tax from tax record
- −$434 /mo · $5,213/yr
- Insurance
- −$148
- HOA
- −$0
- Lot rent
- −$0
- Vacancy / Maint / Mgmt
- −$1,234
- Net cashflow
- $2,198
Break-even live
Sensitivity live
| Price | -10% $2,399 | -5% $2,299 | +0% $2,198 | +5% $2,098 | +10% $1,997 |
|---|---|---|---|---|---|
| Rent | -10% $1,734 | -5% $1,966 | +0% $2,198 | +5% $2,430 | +10% $2,662 |
| Rate | -1.0pp $2,377 | -0.5pp $2,288 | base $2,198 | +0.5pp $2,106 | +1.0pp $2,012 |
3-unit breakdown (identical units grouped — click to expand)
| Units | Beds | Baths | Est. rent |
|---|---|---|---|
| 3× units | 2 | 1 | $5,877 |
| #1 | 2 | 1 | $1,959 |
| #2 | 2 | 1 | $1,959 |
| #3 | 2 | 1 | $1,959 |
| Total (3 units) | $5,876 | ||
UW: 25.0% down · 7.5% · 30yr · 1.5% tax · 5.0% vac · 8.0% maint · 8.0% mgmt
Financing live
Cash to close
- Down payment
- $88,750
- Closing costs
- $10,650
- Reserves months
- —
- Total cash needed
- —
Loan-product check · same deal, 3 products live
Conventional
25% down · 7.5% · 30yr
- Down + closing
- —
- Monthly P&I
- —
- Monthly cashflow
- —
- DSCR
- —
- Eligible?
- —
Personal DTI + credit; lowest rate.
DSCR
20% down · 8.5% · 30yr
- Down + closing
- —
- Monthly P&I
- —
- Monthly cashflow
- —
- DSCR
- —
- Eligible?
- —
No personal income docs; deal must DSCR.
Hard money
10% down · 12.0% · 12mo
- Down + closing
- —
- Monthly P&I
- —
- Monthly cashflow
- —
- DSCR
- —
- Eligible?
- —
Short-term bridge; refi at stabilization.
Rent comps 40 comps
| Address | Beds | Baths | Sqft | Rent | $/sqft | DOM | Units | Dist |
|---|---|---|---|---|---|---|---|---|
| 426 Poplar St New Haven, CT | 3.0 | 1.0 | 1658 | $1,800 | $1.09 | 46d | 1 | 0.14mi |
| 426 Poplar St Unit 2 New Haven, CT | 4.0 | 2.0 | 1405 | $1,800 | $1.28 | 5d | 1 | 0.14mi |
| 548 Ferry St Unit 1 New Haven, CT | 2.0 | 1.0 | 1610 | $2,150 | $1.34 | 17d | 1 | 0.15mi |
| 199 English St Unit 2 New Haven, CT | 3.0 | 1.0 | 2776 | $2,000 | $0.72 | 46d | 1 | 0.25mi |
| 295 Lloyd St Unit 2 New Haven, CT | 4.0 | 2.0 | 2621 | $2,400 | $0.92 | 5d | 1 | 0.34mi |
| 262 Lloyd St Unit 1 New Haven, CT | 3.0 | 2.0 | 1460 | $2,400 | $1.64 | 6d | 1 | 0.39mi |
| 71 Mechanic St New Haven, CT | 2.0 | 1.0 | 2878 | $2,400 | $0.83 | 46d | 1 | 0.44mi |
| 54 Mechanic St Unit 2nd floor New Haven, CT | 4.0 | 2.0 | 1412 | $3,600 | $2.55 | 46d | 1 | 0.47mi |
| 120 Downing St Unit 3 New Haven, CT | 3.0 | 2.0 | 1800 | $2,450 | $1.36 | 46d | 1 | 0.55mi |
| 28 Edwards St Unit 2 New Haven, CT | 4.0 | 2.0 | 1800 | $3,850 | $2.14 | 17d | 1 | 0.56mi |
| 342 Exchange St New Haven, CT | 2.0 | 1.0 | 2996 | $1,500 | $0.50 | 46d | 1 | 0.59mi |
| 52 Edwards St Unit 1 New Haven, CT | 2.0 | 1.0 | 2348 | $2,850 | $1.21 | 5d | 1 | 0.60mi |
| 902 State St #2 New Haven, CT | 3.0 | 2.5 | 1950 | $3,750 | $1.92 | 26d | 1 | 0.62mi |
| 318 Front St Unit one New Haven, CT | 3.0 | 1.5 | 1400 | $3,100 | $2.21 | 24d | 1 | 0.64mi |
| 52 Canner St Unit 2 New Haven, CT | 2.0 | 1.0 | 1400 | $2,800 | $2.00 | 46d | 1 | 0.71mi |
| 115 Lloyd St #2 New Haven, CT | 4.0 | 2.0 | 2100 | $2,500 | $1.19 | 46d | 1 | 0.72mi |
| 300 Humphrey St Unit 2 New Haven, CT | 3.0 | 2.0 | 2868 | $3,295 | $1.15 | 46d | 1 | 0.73mi |
| 31 Clark St New Haven, CT | 4.0 | 2.0 | 1694 | $4,200 | $2.48 | 6d | 1 | 0.73mi |
| 315 Humphrey St Unit A New Haven, CT | 4.0 | 3.5 | 2465 | $4,500 | $1.83 | 6d | 1 | 0.73mi |
| 68 Anderson St Unit A New Haven, CT | 3.0 | 2.5 | 1693 | $4,500 | $2.66 | 46d | 1 | 0.75mi |
| 39 Houston St Unit 2 New Haven, CT | 3.0 | 1.0 | 2863 | $2,200 | $0.77 | 46d | 1 | 0.76mi |
| 39 Houston St Unit 3 New Haven, CT | 2.0 | 1.0 | 2863 | $2,100 | $0.73 | 6d | 1 | 0.76mi |
| 59 Clark St New Haven, CT | 4.0 | 1.0 | 1541 | $3,250 | $2.11 | 26d | 1 | 0.77mi |
| 37 E Pearl St New Haven, CT | 3.0 | 1.0 | 1600 | $2,595 | $1.62 | 46d | 1 | 0.80mi |
| 826 Orange St Unit 2 New Haven, CT | 2.0 | 1.0 | 1600 | $3,000 | $1.88 | 46d | 1 | 0.81mi |
| 591 Orange St #1 New Haven, CT | 2.0 | 2.0 | 1653 | $4,225 | $2.56 | 46d | 1 | 0.82mi |
| 84 Clark St Unit 1 New Haven, CT | 2.0 | 1.0 | 1400 | $3,000 | $2.14 | 46d | 1 | 0.83mi |
| 187 Lawrence St New Haven, CT | 2.0 | 1.0 | 1500 | $2,950 | $1.97 | 14d | 1 | 0.85mi |
| 506 Orange St Unit 2 New Haven, CT | 3.0 | 1.5 | 1553 | $3,600 | $2.32 | 46d | 1 | 0.93mi |
| 251 Edwards St Unit 2 New Haven, CT | 4.0 | 1.5 | 1522 | $3,900 | $2.56 | 6d | 1 | 0.97mi |
| 48 Lyon St Unit 1 New Haven, CT | 3.0 | 1.0 | 1402 | $2,950 | $2.10 | 21d | 1 | 0.98mi |
| 339 Willow St Unit 1 New Haven, CT | 4.0 | 2.0 | 2163 | $4,050 | $1.87 | 14d | 1 | 0.99mi |
| 441 Chapel St Unit 2A1 (shared) New Haven, CT | 4.0 | 4.0 | 2151 | $3,600 | $1.67 | 5d | 1 | 1.01mi |
| 239 Bradley St Unit 1 New Haven, CT | 3.0 | 1.0 | 1982 | $3,650 | $1.84 | 46d | 1 | 1.03mi |
| 896 Quinnipiac Ave #3 New Haven, CT | 2.0 | 2.0 | 1600 | $2,750 | $1.72 | 0d | 1 | 1.03mi |
| 399 Orange St New Haven, CT | 4.0 | 1.5 | 1650 | $3,200 | $1.94 | 14d | 1 | 1.04mi |
| 904 Quinnipiac Ave New Haven, CT | 3.0 | 1.5 | 2125 | $3,298 | $1.55 | 0d | 1 | 1.05mi |
| 395 Orange St Unit 2 New Haven, CT | 4.0 | 1.5 | 1650 | $3,000 | $1.82 | 46d | 1 | 1.05mi |
| 493 Whitney Ave Unit 3 New Haven, CT | 2.0 | 1.5 | 1400 | $3,150 | $2.25 | 26d | 1 | 1.05mi |
| 420 Whitney Ave New Haven, CT | 3.0–4.0 | 2.0–3.0 | 1800 | $2,395 | $1.33 | 14d | 2 | 1.07mi |
Listing history 5 events
-
2026-06-23days on market $355,000 Active 5 DOM
-
2026-06-21days on market $355,000 Active 4 DOM
-
2026-06-18status $355,000 Active 1 DOM
-
2026-06-16remarks 689-char remark
-
2026-06-16$355,000 Coming Soon 1 DOM
ⓘ Source: listings_history table (triggers on properties + properties_extension) + one-shot
backfill from property_details.listing_events for pre-trigger history.
Tax reassessment forecast CT · Partial reset (capped growth)
- Current annual tax
- $5,213 · $434/mo
- Projected year-2 tax
- $6,405 · $534/mo
- Expected delta
- +$1,192/yr (+$99/mo · 22.9%)
ⓘ Screening estimate from a state-policy table — verify with the county assessor before closing.
Climate risk First Street
- Flood 1/10 Low FEMA zone X (unshaded) · 0% chance over 30 yrs
- Wildfire 1/10 Low
- Heat 7/10 Severe 7 d/yr ≥99°F today · 16 d/yr by 30 yrs out
- Wind 6/10 Major 56% chance of damaging wind over 30 yrs
- Air quality 5/10 Major 6 unhealthy d/yr today · 8 by 30 yrs out
Nearby sold comps map
Loading sold comps map…
Walkable amenities ~0.75 mi
Loading nearby amenities…
Taxation est. · year 1
- Rental income
- $70,512
- − Mortgage interest
- −$19,886
- − Property taxes
- −$5,213
- − Insurance
- −$1,775
- − Repairs & maintenance
- −$5,641
- − Management
- −$5,641
- − Depreciation
- −$10,327
- Taxable income
- $22,029
- Est. tax owed @ 24.0%
- −$5,287
- After-tax cash flow
- $21,090/yr
For passive investors: Depreciation is non-cash, so a rental often shows a tax loss while cash-flowing — sheltering income. Rental losses are passive: they offset passive income freely, and up to $25,000/yr can offset ordinary (W-2) income if you actively participate and your MAGI is under $100k (phasing out to $0 by $150k); unused losses carry forward. On sale, claimed depreciation is recaptured at up to 25%, and gains may owe capital-gains tax (a 1031 exchange can defer both). Figures are a year-1 estimate at your 24.0% rate — not tax advice; consult a CPA.
Schools (NCES district)
- District
- New Haven School District
- NCES district ID
- 0902790
- Math proficiency
- 12% ▼ -10.00%
- Reading proficiency
- 25% ▼ -10.00%
- Median HH income
- $38,058
- Composite
- 15.48/100
- National rank
- #9308
- State rank
- #147 of 153 in CT
Livability — New Haven
- Score
- 79/100
- State rank
- #31
- US rank
- #2190
Category grades
Schools grade is shown separately in the Schools card above.
Census & demographics
- Census place
- New Haven, CT
- County
- New Haven County · 688,236 people
- City population
- 132,813
- Metro
- New Haven-Milford, CT
- Population (ZIP)
- 38,888
- Household income
- $48,500
- Rent vs Own
- Severe rent burden
- 2664.0
Population outlook (South Central Connecticut County) Hauer SSP2
- By 2040
- 608,362
Race, ethnicity, and origin ACS 2023
- Neighborhood character
- Diverse neighborhood (Simpson 0.66)
- Race & ethnicity
- Hispanic / Latino 47% White 26% Black 22% Two or more races 12% Asian 1%
- Hispanic origin (detail)
- Mexican 7% Puerto Rican 25% Dominican 2%
- Common ancestry
- Romanian 2% Lithuanian 1% Slovak 1%
- Foreign-born
- 17% · Canada, Jamaica, South Korea
- Languages at home
- 56% English-only · Spanish 39% Other Indo-European 1% Russian/Polish/Slavic 1%
Political lean MEDSL · South Central Connecticut
- 2024 margin
- Strong D (+20.1) · D 59.0% · R 38.9% · Other 2.1%
- All cycles
- 2024: D+20.1
Not yet ingested
- Civics
- —
Market trends
- HPI YoY
- ▼ -30.87%
- Current HPI
- 364.006
- Rent YoY
- ▲ 4.12%
- Metro
- New Haven-Milford, CT
- State GDP YoY
- ▲ 1.06%
- F500 in state
- 38
Industry mix (Fortune 500 HQ in CT)
| Industry | F500 HQs | Revenue |
|---|---|---|
| Industrial Machinery | 4 | $38B |
|
||
| Insurance | 3 | $71B |
|
||
| Financial Services | 2 | $25B |
|
||
| Transportation / Logistics | 2 | $18B |
|
||
| Healthcare | 1 | $247B |
|
||
| Telecommunications | 1 | $55B |
|
||
Price history
1 event — show timeline
- 2026-06-16 Coming Soon $355,000 Smart MLS
Property tax history
+6.2%/yrLatest (2023): $5,213 · -6.4% YoY. Source: county tax records.
Cash-flow waterfall
monthlySold comps — $/sqft
last 12 mo · ≤1 miLoading sold comps…