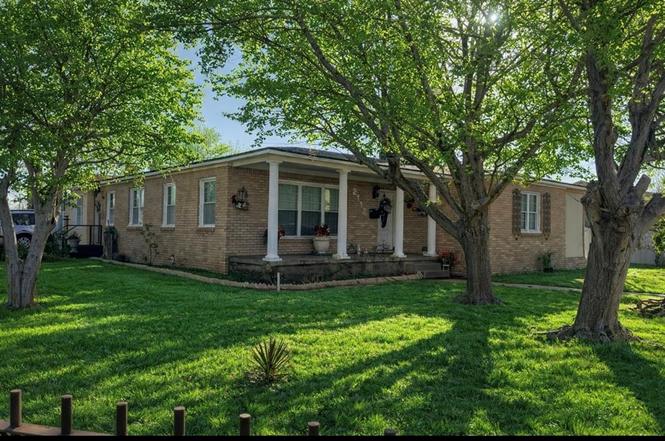
2112 N Washington Ave · Odessa, TX
Flood risk 1/10 · Minimal
- FEMA flood zone
- X (unshaded)
- Chance of flooding over 30 yrs
- 0.0%
- Est. flood insurance / yr
- $507 – $1,088
Fire risk 2/10 · Minimal
- Est. fire insurance / yr
- $1,222 – $2,270
Heat risk 6/10 · Moderate
- Hot days now (above 101°F)
- 7 days/yr
- Hot days in 30 yrs
- 21 days/yr
Wind risk 2/10 · Minimal
- Chance of severe wind over 30 yrs
- 2.0%
Air-quality risk 1/10 · Minimal
- Unhealthy air days now
- 0 days/yr
- Unhealthy air days in 30 yrs
- 0 days/yr
Risk factors via First Street. Map © Google.
Why this score? — see what drove the C+ grade
The composite is a weighted blend of 9 inputs, each scored 0–100. Each bar is that input's sub-score; the figure is the points it added to the 100-point composite (weight × sub-score).
- Cash flow +27.9/30.0
- DSCR +9.9/10.0
- ARV discount +7.5/15.0
- 1% rule +7.0/10.0
- Livability +3.8/5.0
- Condition / age +2.5/5.0
- Rent growth +2.3/5.0
- Schools +2.2/10.0
- Appreciation +0.0/10.0
$185,000
🖨 Deal sheet (PDF) 📄 Offer letter ✓ Due diligence
Listing remarks MLS
Spacious 4-bedroom, 3-bath home on a corner lot close to schools in Odessa. Features original wood flooring, two large living areas, and oversized bedrooms. Newly remodeled primary bathroom. Abundant storage with multiple walk-in closets. Kitchen offers tons of cabinet space plus a wet bar. Large laundry room. Huge barn-style entertainment area perfect for gatherings, with separate his-and-her bathrooms behind the home.
Key facts
- Oversized bedrooms
- Abundant storage
- 8,712 sq ft lot
Tags
Neighborhood map
What this means for you Summary
Snapshot
- This is a 4-bed/3.0-bath single-family listed at $185k.
Deal economics
- At list price, monthly cash flow is $569 ($7k/yr) — positive.
- The deal already cash-flows at list — no discount required.
- Meets the 1% rule at list price ($2k rent vs $185k).
- Recommended offer: $174k (6.0% below list) — sets the bar for market timing.
Location & tenants
- Location reads 75/100 on livability (#132 in TX, #3,928 nationally) — a middle-class / working-renter tenant base. Strengths: cost of living A+, housing A+, health & safety A+; Watch: commute D+, amenities D, schools F.
- Ector County ISD (urban): math 22% / reading 27% proficiency, ranked #707 of 826 in TX (top 86%) — low school quality limits family demand, transient renter base, plan for 1-2y turnover.
- Market conditions: Rents soft (-0.7%/yr); 96 active listings in the ZIP; 6 comparable units currently listed for rent nearby; rentals at typical pace (median 22d on market — plan ~3-4 weeks tenant-placement turnaround); 1,004 units permitted in Ector County in 2024 (0 in 5+ unit buildings).
- This rent runs 39% of the median local income ($68k/yr) — at the standard rent-burdened threshold; future hikes will face affordability resistance.
Forward outlook
- Local home prices are declining (-3.0%/yr); year-one equity from $1k of loan paydown is wiped out by about $6k of value loss. Plan a longer hold.
- Ector County population projected at +78% by 2050 — long-run rental-demand tailwind backs the buy-and-hold thesis.
Negotiation context
- It's been on market 83 days — a 6% lower offer ($174k) is reasonable based on typical stale-listing flexibility.
Risks & watch-outs
- Watch-outs: built in 1949 — expect roof / HVAC / electrical / plumbing capex.
- Climate carrying-cost: extreme-heat days projected 7→21/yr by 2055 (HVAC capex compounding) — expect insurance premiums to compound above CPI over the hold.
Questions for the listing agent
- It's been on market 83 days. Have you received any prior offers? Is the seller open to a 6% concession, seller financing, or rate buy-down credit?
- Built in 1949 — when were the roof, HVAC, electrical panel, plumbing, and water heater last replaced?
- Why hasn't it sold? Are there any deal-killer items the seller is aware of (foundation, flood, title, zoning, code violations)?
- Is there a deadline driving the sale (1031 exchange, divorce, estate, relocation)? That informs how much negotiation room exists.
- Schools are F-rated, which usually means shorter tenancies and higher turnover. Who's the typical renter profile here, and what's been the actual vacancy rate?
- What's the average days-on-market for RENTAL listings here right now (not sales)? A rising rental-DOM trend means longer vacancies and softer asking-rent achievability than the comps imply.
- What's the recent tenant-quality profile in this submarket — average credit score on applications, eviction rate, late-payment / NSF rate, and stable-employment percentage? A property-management company in the area should have these aggregated.
- How much new for-sale + rental construction is in the pipeline within 1–3 miles? Heavy new supply typically softens prices + rents 12–24 months out; constrained supply supports both.
Investment metrics
- 1% rule
- 1.20% ✓
- Cap rate
- 9.98%
- Cash-on-cash
- 13.18%
- DSCR
- 1.59
- GRM
- 6.9
CMA / ARV
- ARV (median comp)
- $69,791
- List price
- $185,000
- Delta
- 165.08%
- Verdict
- OVERPRICED
- Comps
- 2 within 1.0 mi
Show comp detail 1 sale within ~0.75 mi
| Address | Dist | Beds/Ba | Sqft | Sold | Price | $/sf | Match |
|---|---|---|---|---|---|---|---|
| 709 W 20th St | 0.26mi | 3/2.0 (-1) | 2,084 (-12%) | 24mo | $44,900 | $22 | 39 |
Match score weights: distance 35% · size 25% · config 20% · recency 20%. Top-matched comps best support the ARV.
Projected returns pro-forma
-3.0% appreciation · 0.0% rent growth · sell at horizon
- IRR
- -0.1%
- Equity multiple
- 0.99×
- Total profit
- $-282
- Equity at exit
- $27,584
- IRR
- 6.3%
- Equity multiple
- 1.41×
- Total profit
- $21,141
- Equity at exit
- $15,995
Cash invested: $51,800 (down + closing). Projections, not guarantees.
Landlord ↔ Tenant lean methodology
- Overall (STATE)
- 87 Strongly Landlord-Friendly
- State Texas
- 87 Strongly Landlord-Friendly · R+5
- County
- — inherits STATE
- City
- — inherits STATE
ZIP-level market 79761
- Home prices YoY
- -31.4%
- Rents YoY
- -0.7%
- Active inventory
- 96
- Price-to-rent
- 6.9×
Monthly cashflow live
- Estimated rent
- $2,223 high interval (Pro) →
- Mortgage (P&I)
- −$970
- Tax from tax record
- −$140 /mo · $1,683/yr
- Insurance
- −$77
- HOA
- −$0
- Vacancy / Maint / Mgmt
- −$467
- Net cashflow
- $569
Break-even live
Sensitivity live
| Price | -10% $674 | -5% $621 | +0% $569 | +5% $517 | +10% $464 |
|---|---|---|---|---|---|
| Rent | -10% $393 | -5% $481 | +0% $569 | +5% $657 | +10% $745 |
| Rate | -1.0pp $662 | -0.5pp $616 | base $569 | +0.5pp $521 | +1.0pp $472 |
UW: 25.0% down · 7.5% · 30yr · 1.5% tax · 5.0% vac · 8.0% maint · 8.0% mgmt
Financing live
Cash to close
- Down payment
- $46,250
- Closing costs
- $5,550
- Reserves months
- —
- Total cash needed
- —
Loan-product check · same deal, 3 products live
Conventional
25% down · 7.5% · 30yr
- Down + closing
- —
- Monthly P&I
- —
- Monthly cashflow
- —
- DSCR
- —
- Eligible?
- —
Personal DTI + credit; lowest rate.
DSCR
20% down · 8.5% · 30yr
- Down + closing
- —
- Monthly P&I
- —
- Monthly cashflow
- —
- DSCR
- —
- Eligible?
- —
No personal income docs; deal must DSCR.
Hard money
10% down · 12.0% · 12mo
- Down + closing
- —
- Monthly P&I
- —
- Monthly cashflow
- —
- DSCR
- —
- Eligible?
- —
Short-term bridge; refi at stabilization.
Rent comps 6 comps
| Address | Beds | Baths | Sqft | Rent | $/sqft | DOM | Units | Dist |
|---|---|---|---|---|---|---|---|---|
| 1506 N Alleghaney Ave Odessa, TX | 4.0 | 2.0 | 2400 | $2,650 | $1.10 | 22d | 1 | 0.53mi |
| 314 Santa Rita Dr Odessa, TX | 3.0 | 2.0 | 2072 | $1,875 | $0.90 | 22d | 1 | 0.78mi |
| 237 Orchard Dr Odessa, TX | 4.0 | 2.0 | 1768 | $2,000 | $1.13 | 14d | 1 | 0.82mi |
| 1800 W 23rd St Odessa, TX | 3.0 | 2.5 | 1880 | $2,650 | $1.41 | 45d | 1 | 1.15mi |
| 1401 E 18th St Odessa, TX | 3.0 | 2.0 | 1690 | $2,000 | $1.18 | 14d | 1 | 1.34mi |
| 406 San Jacinto St Odessa, TX | 5.0 | 3.0 | 3308 | $2,500 | $0.76 | 14d | 1 | 1.47mi |
Listing history 9 events
-
2026-06-21days on market $185,000 Active 83 DOM
-
2026-06-19days on market $185,000 Active 81 DOM
-
2026-06-18remarks 442-char remark
-
2026-06-18pricestatusdays on market $185,000 Active 80 DOM
-
2026-05-15price $190,000 423-char remark
Show marketing remark (423 chars)
Spacious 4-bedroom, 3-bath home on a corner lot close to schools in Odessa. Features original wood flooring, two large living areas, and oversized bedrooms. Newly remodeled primary bathroom. Abundant storage with multiple walk-in closets. Kitchen offers tons of cabinet space plus a wet bar. Large laundry room. Huge barn-style entertainment area perfect for gatherings, with separate his-and-her bathrooms behind the home.
-
2026-04-01price $250,000 423-char remark
Show marketing remark (423 chars)
Spacious 4-bedroom, 3-bath home on a corner lot close to schools in Odessa. Features original wood flooring, two large living areas, and oversized bedrooms. Newly remodeled primary bathroom. Abundant storage with multiple walk-in closets. Kitchen offers tons of cabinet space plus a wet bar. Large laundry room. Huge barn-style entertainment area perfect for gatherings, with separate his-and-her bathrooms behind the home.
-
2026-03-02$290,000 Active 423-char remark
Show marketing remark (423 chars)
Spacious 4-bedroom, 3-bath home on a corner lot close to schools in Odessa. Features original wood flooring, two large living areas, and oversized bedrooms. Newly remodeled primary bathroom. Abundant storage with multiple walk-in closets. Kitchen offers tons of cabinet space plus a wet bar. Large laundry room. Huge barn-style entertainment area perfect for gatherings, with separate his-and-her bathrooms behind the home.
-
2025-08-23price $348,000
-
2003-02-14soldstatus
ⓘ Source: listings_history table (triggers on properties + properties_extension) + one-shot
backfill from property_details.listing_events for pre-trigger history.
Tax reassessment forecast TX · Resets to sale price
- Current annual tax
- $1,683 · $140/mo
- Projected year-2 tax
- $3,386 · $282/mo
- Expected delta
- +$1,703/yr (+$142/mo · 101.2%)
ⓘ Screening estimate from a state-policy table — verify with the county assessor before closing.
Climate risk First Street
- Flood 1/10 Low FEMA zone X (unshaded) · 0% chance over 30 yrs
- Wildfire 2/10 Low
- Heat 6/10 Major 7 d/yr ≥101°F today · 21 d/yr by 30 yrs out
- Wind 2/10 Low 2% chance of damaging wind over 30 yrs
- Air quality 1/10 Low 0 unhealthy d/yr today · 0 by 30 yrs out
Nearby sold comps map
Loading sold comps map…
Walkable amenities ~0.75 mi
Loading nearby amenities…
Taxation est. · year 1
- Rental income
- $26,679
- − Mortgage interest
- −$10,363
- − Property taxes
- −$1,683
- − Insurance
- −$925
- − Repairs & maintenance
- −$2,134
- − Management
- −$2,134
- − Depreciation
- −$5,382
- Taxable income
- $4,058
- Est. tax owed @ 24.0%
- −$974
- After-tax cash flow
- $5,853/yr
For passive investors: Depreciation is non-cash, so a rental often shows a tax loss while cash-flowing — sheltering income. Rental losses are passive: they offset passive income freely, and up to $25,000/yr can offset ordinary (W-2) income if you actively participate and your MAGI is under $100k (phasing out to $0 by $150k); unused losses carry forward. On sale, claimed depreciation is recaptured at up to 25%, and gains may owe capital-gains tax (a 1031 exchange can defer both). Figures are a year-1 estimate at your 24.0% rate — not tax advice; consult a CPA.
Schools (NCES district)
- District
- Ector County ISD
- NCES district ID
- 4818000
- Math proficiency
- 22% ▼ -9.00%
- Reading proficiency
- 27% ▼ -4.00%
- Median HH income
- $52,740
- Composite
- 21.89/100
- National rank
- #8233
- State rank
- #707 of 826 in TX
Livability — Odessa
- Score
- 75/100
- State rank
- #132
- US rank
- #3928
Category grades
Schools grade is shown separately in the Schools card above.
Census & demographics
- Census place
- Odessa, TX
- County
- Ector County · 131,169 people
- City population
- 131,169
- Metro
- Odessa, TX
- Population (ZIP)
- 30,164
- Household income
- $68,228
- Rent vs Own
- Severe rent burden
- 1352.0
Population outlook (Ector County) Hauer SSP2
- Today (2025)
- 212,765 people
- By 2030
- 241,962 · +13.7%
- By 2040
- 306,582 · +44.1%
- By 2050
- 379,755 · +78.5%
- By 2075
- 568,991 · +167.4%
- By 2100
- 709,829 · +233.6%
Race, ethnicity, and origin ACS 2023
- Neighborhood character
- Predominantly Hispanic (67%)
- Race & ethnicity
- Hispanic / Latino 67% White 23% Two or more races 20% Black 8% Asian 1%
- Hispanic origin (detail)
- Mexican 61%
- Common ancestry
- Slovak 1%
- Foreign-born
- 18% · Canada
- Languages at home
- 50% English-only · Spanish 48%
Political lean MEDSL · Ector
- 2024 margin
- Solid R (+52.9) · D 23.2% · R 76.1%
- 2008→2024 swing
- -4.9pp toward R · 2008: -48.0pp · 2024: -52.9pp
- All cycles
- 2024: R+52.9 2020: R+47.8 2016: R+40.6 2012: R+48.9 2008: R+48.0
Not yet ingested
- Civics
- —
Market trends
- HPI YoY
- ▼ -116.66%
- Current HPI
- 254.9159
- Rent YoY
- ▼ -0.66%
- Metro
- Odessa, TX
- State GDP YoY
- ▲ 3.95%
- F500 in state
- 110
Industry mix (Fortune 500 HQ in TX)
| Industry | F500 HQs | Revenue |
|---|---|---|
| Energy | 16 | $1,198B |
|
||
| Technology | 5 | $198B |
|
||
| Engineering / Construction | 4 | $72B |
|
||
| Energy Services | 3 | $60B |
|
||
| Utilities | 3 | $41B |
|
||
| Healthcare | 2 | $330B |
|
||
Price history
-45.4% since first listed5 events — show timeline
- 2026-05-15 Price Changed $190,000 ODMLS
- 2026-04-01 Price Changed $250,000 ODMLS
- 2026-03-02 Listed $290,000 ODMLS
- 2025-08-23 Price Changed $348,000 ODMLS
- 2003-02-14 Sold (Public Records) — Public Records
Property tax history
-4.8%/yrLatest (2025): $1,683 · -37.2% YoY. Source: county tax records.
Cash-flow waterfall
monthlySold comps — $/sqft
last 12 mo · ≤1 miLoading sold comps…