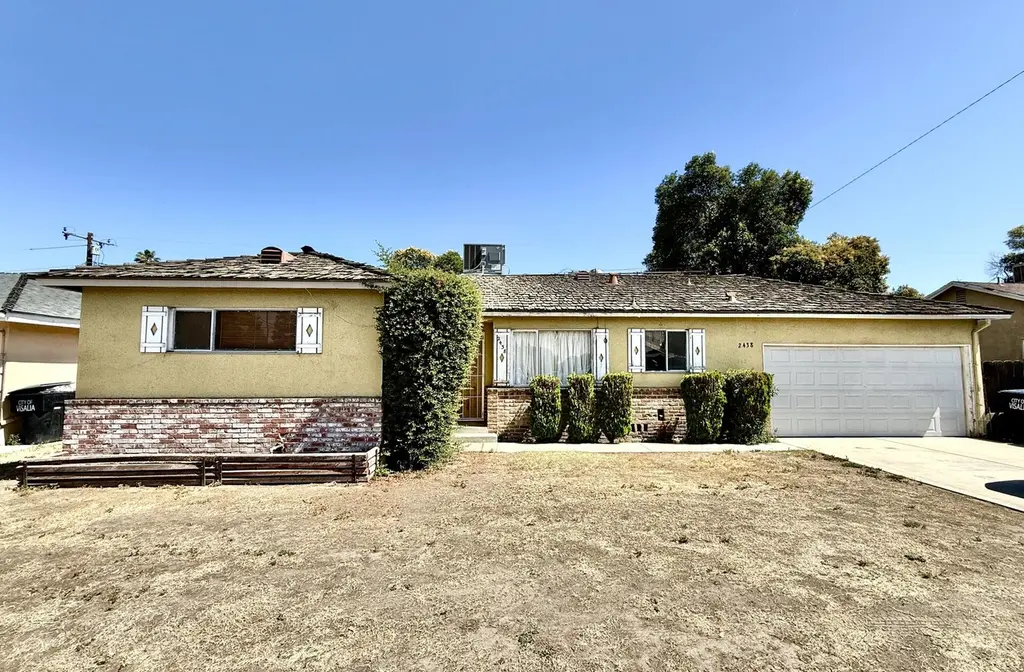
2438 W Walnut Ave · Visalia, CA
Flood risk 3/10 · Minor
- FEMA flood zone
- X (shaded)
- Chance of flooding over 30 yrs
- 0.07%
- Est. flood insurance / yr
- $507 – $1,088
Fire risk 1/10 · Minimal
- Est. fire insurance / yr
- $659 – $1,223
Heat risk 8/10 · Major
- Hot days now (above 105°F)
- 7 days/yr
- Hot days in 30 yrs
- 17 days/yr
Wind risk 1/10 · Minimal
- Chance of severe wind over 30 yrs
- —
Air-quality risk 10/10 · Severe
- Unhealthy air days now
- 40 days/yr
- Unhealthy air days in 30 yrs
- 43 days/yr
Risk factors via First Street. Map © Google.
Why this score? — see what drove the D+ grade
The composite is a weighted blend of 9 inputs, each scored 0–100. Each bar is that input's sub-score; the figure is the points it added to the 100-point composite (weight × sub-score).
- ARV discount +15.0/15.0
- Cash flow +13.7/30.0
- DSCR +4.1/10.0
- Livability +3.6/5.0
- Rent growth +3.3/5.0
- 1% rule +3.0/10.0
- Schools +3.0/10.0
- Condition / age +2.5/5.0
- Appreciation +0.0/10.0
$245,000
🖨 Deal sheet (PDF) 📄 Offer letter ✓ Due diligence
Listing remarks
Fixer-upper situated across from the Visalia Mall. This all original home offers comfortable living space with three bedrooms and two bathrooms to accommodate your household needs. Set on a spacious 8,046-square-foot lot, the property provides ample outdoor space for recreation, gardening, or future expansion. Located near Mooney Blvd's businesses, shopping and restaurants, this residence presents an excellent opportunity for those seeking a solid foundation for their next project.
Key facts
- Near businesses
- Near shopping
- Near restaurants
Tags
Property features AI
Exterior
- Parking: 2-car garage with garage door opener
- Utilities: Public water; Public sewer; Natural gas available and connected; Electricity connected
- Home design: Single-family residence; One-story; Faces south; Listed as fixer; Suitable for investment or vacant residential use
- Construction: Brick and stucco construction; Raised foundation; Shake wood roof
- Exterior features: Patio
Interior
- Kitchen: Free-standing gas range
- Flooring: Hardwood; Vinyl; Carpet
- Bathrooms: Two three-quarter bathrooms
- Heating & cooling: Forced air heating; Natural gas heating; Fireplace heating; Central air conditioning; Electric cooling
- Interior features: Living room masonry fireplace; Water heater; Free-standing gas range
- Laundry & utility: Laundry located in the garage; 220V outlet in laundry
Neighborhood map
What this means for you Summary
Snapshot
- This is a 3-bed/2.0-bath single-family listed at $245k.
Deal economics
- At list price, monthly cash flow is $16 ($195/yr) — positive.
- The deal already cash-flows at list — no discount required.
- To meet the 1% rule (rent ≥ 1% of price), the offer needs to be $195k (20.3% below list).
- Recommended offer: $195k (20.3% below list) — sets the bar for 1% rule.
- Cap rate 6.4% vs local median 3.3% in Visalia — top-decile yield for the area; either an underpriced asset or a hidden risk that comps aren't pricing in. Stress-test before assuming the spread holds.
Location & tenants
- Location reads 72/100 on livability (#196 in CA) — a middle-class / working-renter tenant base. Strengths: commute A+, housing A+, employment B; Watch: amenities D, crime D-, cost of living F.
- Visalia Unified (urban): math 30% / reading 40% proficiency, ranked #273 of 517 in CA (top 53%) — families likely to look elsewhere, expect single-tenant / working-renter base with shorter leases.
- Market conditions: Rents rising (+3.3%/yr); 239 active listings in the ZIP; 33 comparable units currently listed for rent nearby; rentals lingering (median 45d on market — plan ~5-8 weeks vacancy on turnover, expect pricing pressure); 52% of comp listings sitting > 30 days — soft ceiling on asking rent; solid renter incomes; 1,447 units permitted in Tulare County in 2024 (307 in 5+ unit buildings).
Forward outlook
- Local home prices are declining (-3.0%/yr); year-one equity from $2k of loan paydown is wiped out by about $7k of value loss. Plan a longer hold.
- Tulare County population projected at +10% by 2050 — modest demand growth; plan on rents tracking national, not racing it.
Negotiation context
- Only 4 days on market — expect competitive offers; lowballing is unlikely to land.
Risks & watch-outs
- Watch-outs: built in 1955 — expect roof / HVAC / electrical / plumbing capex.
- Climate carrying-cost: extreme-heat days projected 7→17/yr by 2055 (HVAC capex compounding) — expect insurance premiums to compound above CPI over the hold.
Questions for the listing agent
- Built in 1955 — when were the roof, HVAC, electrical panel, plumbing, and water heater last replaced?
- Is there a deadline driving the sale (1031 exchange, divorce, estate, relocation)? That informs how much negotiation room exists.
- Crime grade is D in this area — have there been break-ins, vandalism, or insurance claims at this property in the last 3 years? What carrier currently insures it and at what premium?
- The area grade is low — what's the realistic commute time and amenity access for the typical tenant pool here? Any planned neighborhood developments (good or bad) we should know about?
- What's the average days-on-market for RENTAL listings here right now (not sales)? A rising rental-DOM trend means longer vacancies and softer asking-rent achievability than the comps imply.
- What's the recent tenant-quality profile in this submarket — average credit score on applications, eviction rate, late-payment / NSF rate, and stable-employment percentage? A property-management company in the area should have these aggregated.
- How much new for-sale + rental construction is in the pipeline within 1–3 miles? Heavy new supply typically softens prices + rents 12–24 months out; constrained supply supports both.
Investment metrics
- 1% rule
- 0.80% ✗
- Cap rate
- 6.37%
- Cash-on-cash
- 0.28%
- DSCR
- 1.01
- GRM
- 10.5
CMA / ARV
- ARV (on-the-fly)
- $327,684
- Comps found
- 12
Show comp detail 12 sales within ~0.75 mi
| Address | Dist | Beds/Ba | Sqft | Sold | Price | $/sf | Match |
|---|---|---|---|---|---|---|---|
| 1645 S Duke St | 0.22mi | 3/2.0 | 1,253 (-5%) | 2mo | $345,000 | $275 | 80 |
| 2626 W Princeton Ave | 0.18mi | 3/2.0 | 1,455 (+11%) | 1mo | $349,000 | $240 | 73 |
| 2709 W Royal Oaks | 0.30mi | 3/2.0 | 1,443 (+10%) | 0mo | $360,000 | $249 | 70 |
| 2607 W Dartmouth Ave | 0.21mi | 3/2.0 | 1,478 (+12%) | 1mo | $360,000 | $244 | 68 |
| 2634 W Iris Ave | 0.45mi | 3/2.0 | 1,237 (-6%) | 4mo | $325,000 | $263 | 66 |
| 1436 S Fairway St | 0.52mi | 3/2.0 | 1,400 (+6%) | 3mo | $332,000 | $237 | 62 |
| 2805 W Beech Ave | 0.35mi | 3/2.0 | 1,159 (-12%) | 3mo | $355,000 | $306 | 61 |
| 2323 S Dollner St | 0.64mi | 3/2.0 | 1,384 (+5%) | 1mo | $363,000 | $262 | 60 |
| 3325 W Laurel Ave | 0.75mi | 3/2.0 | 1,363 (+4%) | 0mo | $330,000 | $242 | 59 |
| 2601 W Country Ave | 0.48mi | 3/2.0 | 1,495 (+14%) | 3mo | $330,000 | $221 | 52 |
| 1502 W Tulare Ave | 0.74mi | 4/2.0 (+1) | 1,391 (+6%) | 2mo | $350,000 | $252 | 50 |
| 2922 S Linda Vista St | 0.64mi | 3/2.0 | 1,505 (+14%) | 4mo | $350,000 | $233 | 43 |
Match score weights: distance 35% · size 25% · config 20% · recency 20%. Top-matched comps best support the ARV.
Projected returns pro-forma
-3.0% appreciation · 3.32% rent growth · sell at horizon
- IRR
- -15.6%
- Equity multiple
- 0.44×
- Total profit
- $-38,109
- Equity at exit
- $36,530
- IRR
- -6.7%
- Equity multiple
- 0.57×
- Total profit
- $-29,544
- Equity at exit
- $21,183
Cash invested: $68,600 (down + closing). Projections, not guarantees.
Landlord ↔ Tenant lean methodology
- Overall (STATE)
- 18 Strongly Tenant-Friendly
- State California
- 18 Strongly Tenant-Friendly · D+13
- County
- — inherits STATE
- City
- — inherits STATE
ZIP-level market 93277
- Rents YoY
- 3.3%
- Active inventory
- 239
- Price-to-rent
- 10.5×
Monthly cashflow live
- Estimated rent
- $1,953 high interval (Pro) →
- Mortgage (P&I)
- −$1,285
- Tax from tax record
- −$140 /mo · $1,676/yr
- Insurance
- −$102
- HOA
- −$0
- Vacancy / Maint / Mgmt
- −$410
- Net cashflow
- $16
Break-even live
Sensitivity live
| Price | -10% $155 | -5% $86 | +0% $16 | +5% $-53 | +10% $-122 |
|---|---|---|---|---|---|
| Rent | -10% $-138 | -5% $-61 | +0% $16 | +5% $93 | +10% $171 |
| Rate | -1.0pp $140 | -0.5pp $79 | base $16 | +0.5pp $-47 | +1.0pp $-112 |
UW: 25.0% down · 7.5% · 30yr · 1.5% tax · 5.0% vac · 8.0% maint · 8.0% mgmt
Financing live
Cash to close
- Down payment
- $61,250
- Closing costs
- $7,350
- Reserves months
- —
- Total cash needed
- —
Loan-product check · same deal, 3 products live
Conventional
25% down · 7.5% · 30yr
- Down + closing
- —
- Monthly P&I
- —
- Monthly cashflow
- —
- DSCR
- —
- Eligible?
- —
Personal DTI + credit; lowest rate.
DSCR
20% down · 8.5% · 30yr
- Down + closing
- —
- Monthly P&I
- —
- Monthly cashflow
- —
- DSCR
- —
- Eligible?
- —
No personal income docs; deal must DSCR.
Hard money
10% down · 12.0% · 12mo
- Down + closing
- —
- Monthly P&I
- —
- Monthly cashflow
- —
- DSCR
- —
- Eligible?
- —
Short-term bridge; refi at stabilization.
Rent comps 33 comps
| Address | Beds | Baths | Sqft | Rent | $/sqft | DOM | Units | Dist |
|---|---|---|---|---|---|---|---|---|
| 2344 W Walnut Ave Visalia, CA | 4.0 | 3.0 | 1838 | $2,375 | $1.29 | 14d | 1 | 0.05mi |
| 1323 S Crowe St Unit D Visalia, CA | 2.0 | 2.0 | 900 | $1,575 | $1.75 | 22d | 1 | 0.44mi |
| 1317 S Crowe St Unit A Visalia, CA | 2.0 | 2.0 | 900 | $1,575 | $1.75 | 14d | 1 | 0.44mi |
| 1311 S Crowe St Unit 1317A Visalia, CA | 2.0 | 2.0 | 900 | $1,575 | $1.75 | 14d | 1 | 0.44mi |
| 1311 S Crowe St Unit 1323D Visalia, CA | 2.0 | 2.0 | 900 | $1,575 | $1.75 | 22d | 1 | 0.44mi |
| 2704 W Whitendale Ave Visalia, CA | 3.0 | 2.0 | 1583 | $1,895 | $1.20 | 22d | 1 | 0.50mi |
| 1917 W Whitendale Ave Unit 1917 Visalia, CA | 2.0 | 2.0 | 1048 | $1,295 | $1.24 | 44d | 1 | 0.66mi |
| 2546 W Victor Ct Unit 102 Visalia, CA | 3.0 | 2.0 | 1200 | $1,995 | $1.66 | 44d | 1 | 0.78mi |
| 1231 W Whispering Pines Ct Visalia, CA | 3.0 | 2.0 | 1258 | $1,895 | $1.51 | 44d | 1 | 0.80mi |
| 3618 W Country Ave Visalia, CA | 3.0 | 2.0 | 1618 | $2,095 | $1.29 | 44d | 1 | 0.84mi |
| 1212 S Demaree St Visalia, CA | 4.0 | 2.0 | 1644 | $2,500 | $1.52 | 44d | 1 | 0.89mi |
| 1120 W Howard Ave Visalia, CA | 4.0 | 2.0 | 1850 | $2,800 | $1.51 | 22d | 1 | 0.89mi |
| 3417 W Campus Ave Visalia, CA | 2.0 | 2.0 | 1050 | $1,450 | $1.38 | 14d | 1 | 0.99mi |
| 815 S Demaree St Unit 33 Visalia, CA | 2.0 | 1.5 | 890 | $1,300 | $1.46 | 22d | 1 | 1.09mi |
| 815 S Demaree St Apt 40 Visalia, CA | 2.0 | 1.5 | 890 | $1,300 | $1.46 | 44d | 1 | 1.09mi |
| 815 S Demaree St Unit 11 Visalia, CA | 3.0 | 1.5 | 924 | $1,400 | $1.52 | 44d | 1 | 1.09mi |
| 3936 W Meadow Ave Visalia, CA | 2.0 | 1.0 | 877 | $1,365 | $1.56 | 44d | 1 | 1.11mi |
| 3900-4054 W Meadow Ave Unit 3936 Visalia, CA | 2.0 | 1.0 | 877 | $1,365 | $1.56 | 44d | 1 | 1.11mi |
| 3900-4054 W Meadow Ave Unit 4052 Visalia, CA | 2.0 | 1.0 | 877 | $1,340 | $1.53 | 22d | 1 | 1.11mi |
| 3432 S Martin Ct Visalia, CA | 4.0 | 2.0 | 1696 | $2,300 | $1.36 | 22d | 1 | 1.12mi |
| 1927 S Julieann Ct Visalia, CA | 3.0 | 2.0 | 1671 | $2,000 | $1.20 | 22d | 1 | 1.13mi |
| 1107 W Victor Ave Visalia, CA | 3.0 | 2.0 | 1710 | $2,500 | $1.46 | 14d | 1 | 1.14mi |
| 4052 W Meadow Ave Visalia, CA | 2.0 | 1.0 | 877 | $1,340 | $1.53 | 22d | 1 | 1.16mi |
| 1642 S West St Visalia, CA | 3.0 | 2.0 | 1266 | $1,795 | $1.42 | 44d | 1 | 1.21mi |
| 3919 S Sallee Ct Visalia, CA | 3.0 | 2.0 | 1642 | $2,400 | $1.46 | 22d | 1 | 1.21mi |
| 3940 S Shady Ct Apt 223 Visalia, CA | 2.0 | 2.0 | 910 | $1,950 | $2.14 | 44d | 1 | 1.24mi |
| 3940 S Shady Ct Unit 123 Visalia, CA | 2.0 | 1.0 | 910 | $1,695 | $1.86 | 44d | 1 | 1.24mi |
| 3940 S Shady Ct Apt 107 Visalia, CA | 2.0 | 2.0 | 950 | $1,695 | $1.78 | 44d | 1 | 1.24mi |
| 3133 W Mill Creek Dr Visalia, CA | 3.0 | 2.0 | 1753 | $2,250 | $1.28 | 44d | 1 | 1.31mi |
| 2548 S Watson St Visalia, CA | 3.0 | 2.0 | 1596 | $1,900 | $1.19 | 22d | 1 | 1.34mi |
| 1849 S Noyes St Visalia, CA | 3.0 | 2.0 | 1497 | $2,250 | $1.50 | 44d | 1 | 1.38mi |
| 1650 S Bardo St Visalia, CA | 2.0 | 1.0 | 900 | $1,525 | $1.69 | 44d | 1 | 1.38mi |
| 700 S Linwood St Unit 720 Visalia, CA | 2.0 | 1.0 | 1054 | $1,650 | $1.57 | 44d | 1 | 1.48mi |
Listing history 4 events
-
2026-06-13statusdays on market $245,000 Pending 4 DOM
-
2026-06-10days on market $245,000 Active 2 DOM
-
2026-06-09remarks 486-char remark
-
2026-06-09$245,000 Active 1 DOM
ⓘ Source: listings_history table (triggers on properties + properties_extension) + one-shot
backfill from property_details.listing_events for pre-trigger history.
Tax reassessment forecast CA · Resets to sale price
- Current annual tax
- $1,676 · $140/mo
- Projected year-2 tax
- $1,862 · $155/mo
- Expected delta
- +$186/yr (+$15/mo · 11.1%)
ⓘ Screening estimate from a state-policy table — verify with the county assessor before closing.
Climate risk First Street
- Flood 3/10 Moderate FEMA zone X (shaded) · 7% chance over 30 yrs
- Wildfire 1/10 Low
- Heat 8/10 Severe 7 d/yr ≥105°F today · 17 d/yr by 30 yrs out
- Wind 1/10 Low
- Air quality 10/10 Extreme 40 unhealthy d/yr today · 43 by 30 yrs out
Nearby sold comps map
Loading sold comps map…
Walkable amenities ~0.75 mi
Loading nearby amenities…
Taxation est. · year 1
- Rental income
- $23,435
- − Mortgage interest
- −$13,724
- − Property taxes
- −$1,676
- − Insurance
- −$1,225
- − Repairs & maintenance
- −$1,875
- − Management
- −$1,875
- − Depreciation
- −$7,127
- Taxable loss
- −$4,067
- Est. tax savings @ 24.0%
- +$976
- After-tax cash flow
- $1,171/yr
For passive investors: Depreciation is non-cash, so a rental often shows a tax loss while cash-flowing — sheltering income. Rental losses are passive: they offset passive income freely, and up to $25,000/yr can offset ordinary (W-2) income if you actively participate and your MAGI is under $100k (phasing out to $0 by $150k); unused losses carry forward. On sale, claimed depreciation is recaptured at up to 25%, and gains may owe capital-gains tax (a 1031 exchange can defer both). Figures are a year-1 estimate at your 24.0% rate — not tax advice; consult a CPA.
Schools (NCES district)
- District
- Visalia Unified
- NCES district ID
- 0641160
- Math proficiency
- 30% ▼ -3.00%
- Reading proficiency
- 40% ▼ -10.00%
- Median HH income
- $51,672
- Composite
- 30.47/100
- National rank
- #6223
- State rank
- #273 of 517 in CA
Livability — Visalia
- Score
- 72/100
- State rank
- #196
- US rank
- #6351
Category grades
Schools grade is shown separately in the Schools card above.
Census & demographics
- Census place
- Visalia, CA
- County
- Tulare County · 323,826 people
- City population
- 163,333
- Metro
- Visalia, CA
- Population (ZIP)
- 53,985
- Household income
- $80,548
- Rent vs Own
- Severe rent burden
- 1896.0
Population outlook (Tulare County) Hauer SSP2
- Today (2025)
- 484,681 people
- By 2030
- 496,241 · +2.4%
- By 2040
- 518,507 · +7.0%
- By 2050
- 534,920 · +10.4%
- By 2075
- 548,417 · +13.2%
- By 2100
- 513,085 · +5.9%
Race, ethnicity, and origin ACS 2023
- Neighborhood character
- Diverse neighborhood (Simpson 0.60)
- Race & ethnicity
- Hispanic / Latino 48% White 40% Two or more races 21% Asian 4% Black 2% Native American 2%
- Hispanic origin (detail)
- Mexican 44%
- Common ancestry
- Russian 3% Iranian 2% Italian 2%
- Foreign-born
- 12% · Canada, China
- Languages at home
- 73% English-only · Spanish 22% Chinese 2% Other Asian/Pacific 1%
Political lean MEDSL · Tulare
- 2024 margin
- Strong R (+20.7) · D 38.5% · R 59.2% · Other 2.3%
- 2008→2024 swing
- -5.4pp toward R · 2008: -15.3pp · 2024: -20.7pp
- All cycles
- 2024: R+20.7 2020: R+7.8 2016: R+12.1 2012: R+17.8 2008: R+15.3
Not yet ingested
- Civics
- —
Market trends
- HPI YoY
- ▼ -371.43%
- Current HPI
- 310.349
- Rent YoY
- ▲ 3.32%
- Metro
- Visalia, CA
- State GDP YoY
- ▲ 3.21%
- F500 in state
- 116
Industry mix (Fortune 500 HQ in CA)
| Industry | F500 HQs | Revenue |
|---|---|---|
| Technology | 27 | $1,492B |
|
||
| Financial Services | 3 | $174B |
|
||
| Retail | 3 | $44B |
|
||
| Insurance | 3 | $26B |
|
||
| Media / Entertainment | 2 | $115B |
|
||
| Pharmaceuticals / Biotech | 2 | $62B |
|
||
Price history
1 event — show timeline
- 2026-06-08 Listed $245,000 TCMLS
Property tax history
+2.1%/yrLatest (2025): $1,676 · +3.0% YoY. Source: county tax records.
Cash-flow waterfall
monthlySold comps — $/sqft
last 12 mo · ≤1 miLoading sold comps…