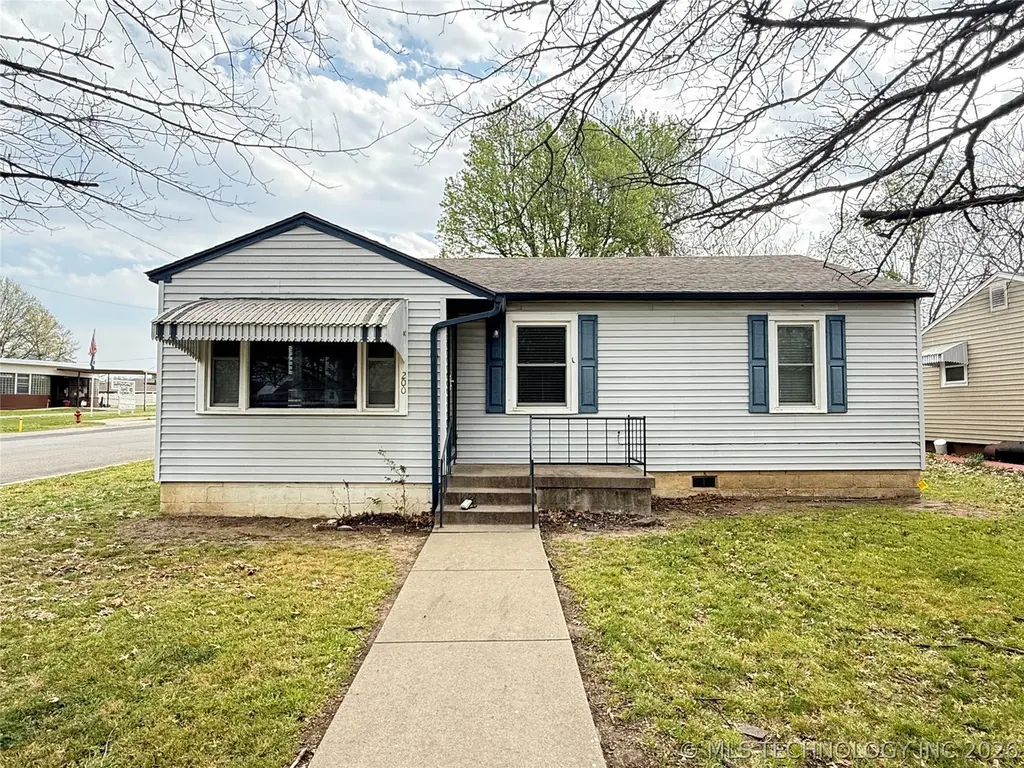
200 S Delaware St · Dewey, OK
Flood risk 1/10 · Minimal
- FEMA flood zone
- X (unshaded)
- Chance of flooding over 30 yrs
- 0.0%
- Est. flood insurance / yr
- $507 – $1,088
Fire risk 6/10 · Moderate
- Est. fire insurance / yr
- $2,463 – $4,575
Heat risk 6/10 · Moderate
- Hot days now (above 113°F)
- 7 days/yr
- Hot days in 30 yrs
- 18 days/yr
Wind risk 2/10 · Minimal
- Chance of severe wind over 30 yrs
- 4.0%
Air-quality risk 2/10 · Minimal
- Unhealthy air days now
- 2 days/yr
- Unhealthy air days in 30 yrs
- 2 days/yr
Risk factors via First Street. Map © Google.
Why this score? — see what drove the B- grade
The composite is a weighted blend of 9 inputs, each scored 0–100. Each bar is that input's sub-score; the figure is the points it added to the 100-point composite (weight × sub-score).
- Cash flow +28.3/30.0
- ARV discount +12.3/15.0
- DSCR +10.0/10.0
- 1% rule +7.3/10.0
- Livability +3.2/5.0
- Rent growth +2.5/5.0
- Condition / age +2.5/5.0
- Schools +1.9/10.0
- Appreciation +0.0/10.0
$85,000
🖨 Deal sheet 📄 Offer letter ✓ Due diligence
Listing remarks MLS
Nice home , sets on a corner lot, has three bedrooms and one bathroom. nice kitchen, utility room and a attached one car garage with a opener. (To be sold in as is condition)
Key facts
- 6,550 sq ft lot
- Garage
- Built 1950
Neighborhood map
What this means for you Summary
Snapshot
- This is a 3-bed/1.0-bath single-family listed at $85k.
Deal economics
- At list price, monthly cash flow is $272 ($3k/yr) — positive.
- The deal already cash-flows at list — no discount required.
- Meets the 1% rule at list price ($1k rent vs $85k).
- Recommended offer: $84k (1.5% below list) — sets the bar for market timing.
Location & tenants
- Location reads 65/100 on livability (#128 in OK) — a middle-class / working-renter tenant base. Strengths: cost of living A+, housing A+; Watch: employment C-, schools F, amenities F.
- Dewey (town): math 21% / reading 25% proficiency, ranked #145 of 270 in OK (top 54%) — low school quality limits family demand, transient renter base, plan for 1-2y turnover.
- Market conditions: 38 active listings in the ZIP; 46 units permitted in Washington County in 2024 (0 in 5+ unit buildings).
Forward outlook
- Local home prices are declining (-3.0%/yr); year-one equity from $588 of loan paydown is wiped out by about $3k of value loss. Plan a longer hold.
- Washington County population projected at +12% by 2050 — modest demand growth; plan on rents tracking national, not racing it.
- At projected returns (-3.0% appreciation + 3.0% rent growth), your $24k cash investment doubles in ~9 years — after that, you're playing with house money.
Negotiation context
- It's been on market 15 days — a 2% lower offer ($84k) is reasonable based on typical stale-listing flexibility.
- 4 sale attempts since 15y ago with the ask held roughly flat each time — persistent listings suggest the price (not the market) is what's stuck; bring a comps-based counter.
- Current owner paid $70k; 22% above their basis — modest negotiation headroom, anchor on the comps not their cost.
Risks & watch-outs
- Watch-outs: built in 1950 — expect roof / HVAC / electrical / plumbing capex.
- Climate carrying-cost: major wildfire risk; extreme-heat days projected 7→18/yr by 2055 (HVAC capex compounding) — expect insurance premiums to compound above CPI over the hold.
Questions for the listing agent
- Built in 1950 — when were the roof, HVAC, electrical panel, plumbing, and water heater last replaced?
- Is there a deadline driving the sale (1031 exchange, divorce, estate, relocation)? That informs how much negotiation room exists.
- Schools are F-rated, which usually means shorter tenancies and higher turnover. Who's the typical renter profile here, and what's been the actual vacancy rate?
- What's the average days-on-market for RENTAL listings here right now (not sales)? A rising rental-DOM trend means longer vacancies and softer asking-rent achievability than the comps imply.
- What's the recent tenant-quality profile in this submarket — average credit score on applications, eviction rate, late-payment / NSF rate, and stable-employment percentage? A property-management company in the area should have these aggregated.
- How much new for-sale + rental construction is in the pipeline within 1–3 miles? Heavy new supply typically softens prices + rents 12–24 months out; constrained supply supports both.
Investment metrics
- 1% rule
- 1.23% ✓
- Cap rate
- 10.13%
- Cash-on-cash
- 13.69%
- DSCR
- 1.61
- GRM
- 6.8
CMA / ARV
- ARV (on-the-fly)
- $95,040
- Comps found
- 6
Show comp detail 6 sales within ~0.75 mi
| Address | Dist | Beds/Ba | Sqft | Sold | Price | $/sf | Match |
|---|---|---|---|---|---|---|---|
| 200 S Delaware St | 0.00mi | 3/1.0 | 864 (0%) | 1mo | $87,250 | $101 | 99 |
| 216 S Delaware St | 0.08mi | 2/1.0 (-1) | 840 (-3%) | 3mo | $102,500 | $122 | 84 |
| 340 N Oak St | 0.45mi | 3/1.0 | 846 (-2%) | 0mo | $52,000 | $61 | 75 |
| 409 E 5th | 0.48mi | 2/1.0 (-1) | 900 (+4%) | 16mo | $98,900 | $110 | 52 |
| 820 E 7th St | 0.71mi | 2/1.0 (-1) | 872 (+1%) | 14mo | $117,000 | $134 | 49 |
| 406 N Delaware St | 0.42mi | 2/1.0 (-1) | 986 (+14%) | 21mo | $106,000 | $108 | 34 |
Match score weights: distance 35% · size 25% · config 20% · recency 20%. Top-matched comps best support the ARV.
Projected returns pro-forma
-3.0% appreciation · 3.0% rent growth · sell at horizon
- IRR
- 3.8%
- Equity multiple
- 1.15×
- Total profit
- $3,521
- Equity at exit
- $12,674
- IRR
- 13.3%
- Equity multiple
- 2.06×
- Total profit
- $25,322
- Equity at exit
- $7,349
Cash invested: $23,800 (down + closing). Projections, not guarantees.
Landlord ↔ Tenant lean methodology
- Overall (STATE)
- 83 Strongly Landlord-Friendly
- State Oklahoma
- 83 Strongly Landlord-Friendly · R+20
- County
- — inherits STATE
- City
- — inherits STATE
ZIP-level market 74029
- Home prices YoY
- -10.9%
- Active inventory
- 38
- Price-to-rent
- 6.8×
Monthly cashflow live
- Estimated rent
- $1,045 medium interval (Pro) →
- Mortgage (P&I)
- −$446
- Tax from tax record
- −$73 /mo · $874/yr
- Insurance
- −$35
- HOA
- −$0
- Vacancy / Maint / Mgmt
- −$219
- Net cashflow
- $272
Break-even live
UW: 25.0% down · 7.5% · 30yr · 1.5% tax · 5.0% vac · 8.0% maint · 8.0% mgmt
Financing live
Cash to close
- Down payment
- $21,250
- Closing costs
- $2,550
- Reserves months
- —
- Total cash needed
- —
Loan-product check · same deal, 3 products live
Conventional
25% down · 7.5% · 30yr
- Down + closing
- —
- Monthly P&I
- —
- Monthly cashflow
- —
- DSCR
- —
- Eligible?
- —
Personal DTI + credit; lowest rate.
DSCR
20% down · 8.5% · 30yr
- Down + closing
- —
- Monthly P&I
- —
- Monthly cashflow
- —
- DSCR
- —
- Eligible?
- —
No personal income docs; deal must DSCR.
Hard money
10% down · 12.0% · 12mo
- Down + closing
- —
- Monthly P&I
- —
- Monthly cashflow
- —
- DSCR
- —
- Eligible?
- —
Short-term bridge; refi at stabilization.
Listing history 14 events
-
2026-04-21status Pending
-
2026-04-06$85,000 Active
-
2023-01-02soldstatus $69,900 Closed 174-char remark
Show marketing remark (174 chars)
Nice home , sets on a corner lot, has three bedrooms and one bathroom. nice kitchen, utility room and a attached one car garage with a opener. (To be sold in as is condition)
-
2022-11-21status Pending 174-char remark
Show marketing remark (174 chars)
Nice home , sets on a corner lot, has three bedrooms and one bathroom. nice kitchen, utility room and a attached one car garage with a opener. (To be sold in as is condition)
-
2022-10-25$69,900 Active 174-char remark
Show marketing remark (174 chars)
Nice home , sets on a corner lot, has three bedrooms and one bathroom. nice kitchen, utility room and a attached one car garage with a opener. (To be sold in as is condition)
-
2018-06-15soldstatus $67,500
-
2018-06-13soldstatus $67,490 Closed 247-char remark
Show marketing remark (247 chars)
Updated & Maintained 3 Bdrm Home on a Corner Lot. This Adorable Home has had only 2 Owners since 1950! Well Cared for. Newer Vinyl Windows, New Paint, Newer Ext. Doors, Hardwoods & Carpet. Lrg Utility, 1 Car Garage & Fenced Yard.
-
2018-05-18status Pending 247-char remark
Show marketing remark (247 chars)
Updated & Maintained 3 Bdrm Home on a Corner Lot. This Adorable Home has had only 2 Owners since 1950! Well Cared for. Newer Vinyl Windows, New Paint, Newer Ext. Doors, Hardwoods & Carpet. Lrg Utility, 1 Car Garage & Fenced Yard.
-
2018-05-08price $66,500 247-char remark
Show marketing remark (247 chars)
Updated & Maintained 3 Bdrm Home on a Corner Lot. This Adorable Home has had only 2 Owners since 1950! Well Cared for. Newer Vinyl Windows, New Paint, Newer Ext. Doors, Hardwoods & Carpet. Lrg Utility, 1 Car Garage & Fenced Yard.
-
2018-04-06$69,500 Active 247-char remark
Show marketing remark (247 chars)
Updated & Maintained 3 Bdrm Home on a Corner Lot. This Adorable Home has had only 2 Owners since 1950! Well Cared for. Newer Vinyl Windows, New Paint, Newer Ext. Doors, Hardwoods & Carpet. Lrg Utility, 1 Car Garage & Fenced Yard.
-
2012-01-12historical
-
2011-07-07$61,500
-
2009-07-24soldstatus $45,000
-
2000-12-27soldstatus $29,000
ⓘ Source: listings_history table (triggers on properties + properties_extension) + one-shot
backfill from property_details.listing_events for pre-trigger history.
Tax reassessment forecast OK · Resets to sale price
- Current annual tax
- $874 · $73/mo
- Projected year-2 tax
- $874 · $73/mo
- Expected delta
- $0/yr ($0/mo · -0.0%)
ⓘ Screening estimate from a state-policy table — verify with the county assessor before closing.
Climate risk First Street
- Flood 1/10 Low FEMA zone X (unshaded) · 0% chance over 30 yrs
- Wildfire 6/10 Major
- Heat 6/10 Major 7 d/yr ≥113°F today · 18 d/yr by 30 yrs out
- Wind 2/10 Low 4% chance of damaging wind over 30 yrs
- Air quality 2/10 Low 2 unhealthy d/yr today · 2 by 30 yrs out
Nearby sold comps map
Loading sold comps map…
Walkable amenities ~0.75 mi
Loading nearby amenities…
Taxation est. · year 1
- Rental income
- $12,541
- − Mortgage interest
- −$4,761
- − Property taxes
- −$874
- − Insurance
- −$425
- − Repairs & maintenance
- −$1,003
- − Management
- −$1,003
- − Depreciation
- −$2,473
- Taxable income
- $2,001
- Est. tax owed @ 24.0%
- −$480
- After-tax cash flow
- $2,779/yr
For passive investors: Depreciation is non-cash, so a rental often shows a tax loss while cash-flowing — sheltering income. Rental losses are passive: they offset passive income freely, and up to $25,000/yr can offset ordinary (W-2) income if you actively participate and your MAGI is under $100k (phasing out to $0 by $150k); unused losses carry forward. On sale, claimed depreciation is recaptured at up to 25%, and gains may owe capital-gains tax (a 1031 exchange can defer both). Figures are a year-1 estimate at your 24.0% rate — not tax advice; consult a CPA.
Schools (NCES district)
- District
- Dewey
- NCES district ID
- 4009810
- Math proficiency
- 21% ▼ -9.00%
- Reading proficiency
- 25% ▼ -6.00%
- Median HH income
- $38,795
- Composite
- 19.32/100
- National rank
- #8793
- State rank
- #145 of 270 in OK
Livability — Dewey
- Score
- 65/100
- State rank
- #128
- US rank
- #12461
Category grades
Schools grade is shown separately in the Schools card above.
Census & demographics
- Census place
- Dewey, OK
- Population (ZIP)
- 5,270
Population outlook (Washington County) Hauer SSP2
- Today (2025)
- 54,946 people
- By 2030
- 56,249 · +2.4%
- By 2040
- 58,867 · +7.1%
- By 2050
- 61,600 · +12.1%
- By 2075
- 69,355 · +26.2%
- By 2100
- 73,067 · +33.0%
Race, ethnicity, and origin ACS 2023
- Neighborhood character
- Predominantly White (69%)
- Race & ethnicity
- White 69% Native American 13% Two or more races 12% Hispanic / Latino 7% Asian 2%
- Hispanic origin (detail)
- Mexican 4%
- Common ancestry
- Slovak 3% Lithuanian 1% Serbian 1%
- Foreign-born
- 3% · Canada, China, South Korea
- Languages at home
- 94% English-only · Spanish 4% Chinese 1%
Political lean MEDSL · Washington
- 2024 margin
- Solid R (+47.6) · D 25.0% · R 72.7% · Other 2.4%
- 2008→2024 swing
- -3.1pp toward R · 2008: -44.6pp · 2024: -47.6pp
- All cycles
- 2024: R+47.6 2020: R+48.0 2016: R+48.5 2012: R+47.8 2008: R+44.6
Not yet ingested
- Civics
- —
Market trends
- HPI YoY
- ▼ -29.89%
- Current HPI
- 244.528
- Rent YoY
- —
- Metro
- —
- State GDP YoY
- ▲ 1.55%
- F500 in state
- 6
Industry mix (Fortune 500 HQ in OK)
| Industry | F500 HQs | Revenue |
|---|---|---|
| Energy | 3 | $48B |
|
||
Price history
+193.1% since first listed14 events — show timeline
- 2026-04-21 Pending — MLS Technology, Inc.
- 2026-04-06 Listed $85,000 MLS Technology, Inc.
- 2023-01-02 Sold (MLS) $69,900 MLS Technology, Inc.
- 2022-11-21 Pending — MLS Technology, Inc.
- 2022-10-25 Listed $69,900 MLS Technology, Inc.
- 2018-06-15 Sold (Public Records) $67,500 Public Records
- 2018-06-13 Sold (MLS) $67,490 MLS Technology, Inc.
- 2018-05-18 Pending — MLS Technology, Inc.
- 2018-05-08 Price Changed $66,500 MLS Technology, Inc.
- 2018-04-06 Listed $69,500 MLS Technology, Inc.
- 2012-01-12 Listing Removed — MLS Technology, Inc.
- 2011-07-07 Listed $61,500 MLS Technology, Inc.
- 2009-07-24 Sold (Public Records) $45,000 Public Records
- 2000-12-27 Sold (Public Records) $29,000 Public Records
Property tax history
+6.1%/yrLatest (2025): $874 · -2.2% YoY. Source: county tax records.
Cash-flow waterfall
monthlySold comps — $/sqft
last 12 mo · ≤1 miLoading sold comps…