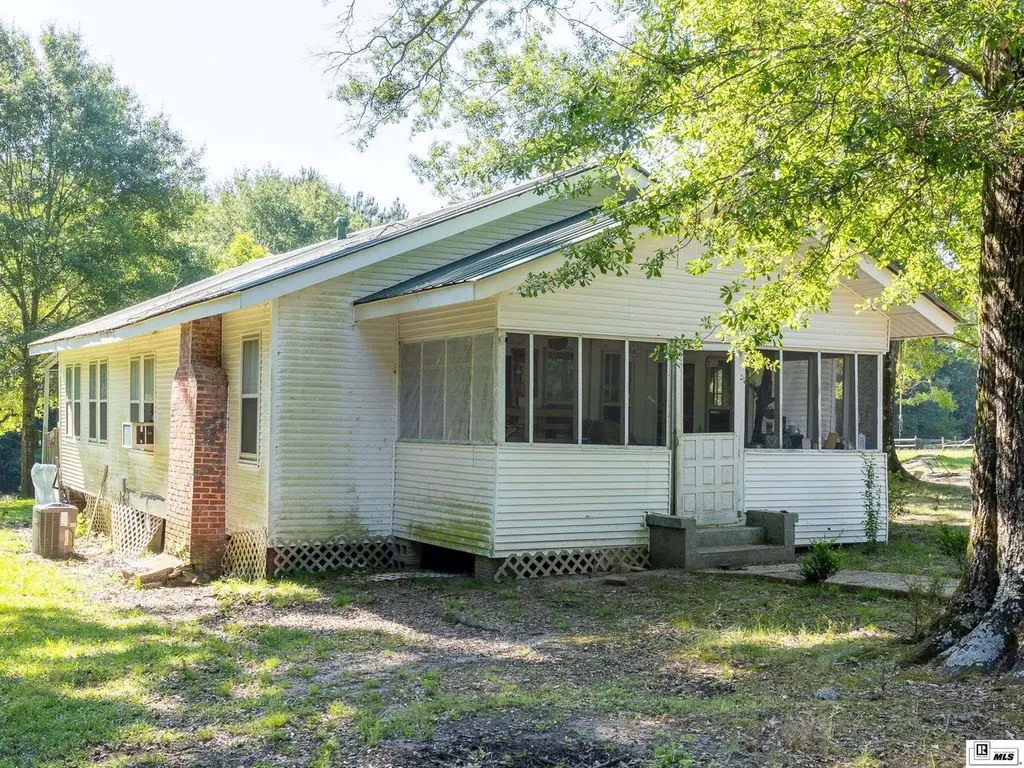
755 Highway 33 · Huttig, AR
Flood risk No data
- FEMA flood zone
- —
- Chance of flooding over 30 yrs
- —
- Est. flood insurance / yr
- —
Fire risk No data
- Est. fire insurance / yr
- —
Heat risk No data
- Hot days now (above threshold)
- —
- Hot days in 30 yrs
- —
Wind risk No data
- Chance of severe wind over 30 yrs
- —
Air-quality risk No data
- Unhealthy air days now
- —
- Unhealthy air days in 30 yrs
- —
Risk factors via First Street. Map © Google.
Why this score? — see what drove the C- grade
The composite is a weighted blend of 9 inputs, each scored 0–100. Each bar is that input's sub-score; the figure is the points it added to the 100-point composite (weight × sub-score).
- Cash flow +18.4/30.0
- ARV discount +7.5/15.0
- Appreciation +6.6/10.0
- DSCR +5.8/10.0
- 1% rule +3.8/10.0
- Livability +2.9/5.0
- Rent growth +2.5/5.0
- Condition / age +2.5/5.0
- Schools +1.3/10.0
$115,000
🖨 Deal sheet 📄 Offer letter ✓ Due diligence
Listing remarks
Enjoy peaceful country living with this charming 2 bedroom, 1 bath home situated on a beautiful property filled with outdoor features and natural scenery. Relax on the screened-in front porch with your morning coffee or unwind on the covered back porch overlooking the backyard. The property includes a garden area perfect for growing vegetables or flowers, a storage shed for tools and equipment, a duck pond, and an additional pond located at the back of the property. With plenty of outdoor space to enjoy, this property offers a quiet retreat with room for gardening, recreation, livestock, and enjoying nature. Please note: neither pond is stocked.
Key facts
- Duck pond
- Garden area
- Storage shed
Tags
Property features AI
Finance
- Other: Paved road access; 7-acre lot, landscaped and cleared
- HOA & community: No association amenities
Exterior
- Utilities: Public water; Septic tank; Propane available
- Home design: Single family residence; Site-built home; One story; Entry level: 1; On waterfront with a pond
- Construction: Vinyl siding; Metal roof; Crawl space foundation; Built on site
- Exterior features: Garden; Screened covered porch; Wire fencing; Shed(s) and storage
Interior
- Kitchen: Electric range
- Bedrooms: 2 bedrooms on the main level
- Bathrooms: 1 full bathroom on the main level
- Heating & cooling: Propane heating; Central air; Ceiling fans
- Interior features: Ceiling fans; Double pane windows; Fireplace (1)
- Laundry & utility: Electric water heater
Neighborhood map
What this means for you Summary
Snapshot
- This is a 3-bed/1.0-bath single-family listed at $115k.
Deal economics
- At list price, monthly cash flow is $107 ($1k/yr) — positive.
- The deal already cash-flows at list — no discount required.
- To meet the 1% rule (rent ≥ 1% of price), the offer needs to be $101k (11.8% below list).
- Recommended offer: $101k (11.8% below list) — sets the bar for 1% rule.
Location & tenants
- Location reads 57/100 on livability (#369 in AR) — a working-class tenant base; expect higher turnover. Strengths: cost of living A+, health & safety A+, housing A-; Watch: schools F, crime F, amenities F.
- Union Parish (rural): math 12% / reading 20% proficiency, ranked #74 of 98 in LA (top 76%) — low school quality limits family demand, transient renter base, plan for 1-2y turnover; 76% free/reduced lunch — lower-income household profile, screen leases tightly.
- Market conditions: 1 active listings in the ZIP; 2 units permitted in Union Parish in 2024 (0 in 5+ unit buildings).
Forward outlook
- In year one you build about $4k of equity ($795 loan paydown + $4k appreciation (3.1% local appreciation)).
- Union County population projected at -14% by 2050 — secular population decline; favor cash flow + early exit over multi-decade hold.
- At projected returns (3.1% appreciation + 3.0% rent growth), your $32k cash investment doubles in ~5 years — after that, you're playing with house money.
- By year 8, paydown + projected appreciation supports a ~$32k cash-out refi (75% LTV) — recoverable capital for the next deal without selling this one.
Negotiation context
- It's been on market 33 days — a 3% lower offer ($112k) is reasonable based on typical stale-listing flexibility.
Risks & watch-outs
- Watch-outs: built in 1958 — expect roof / HVAC / electrical / plumbing capex.
Questions for the listing agent
- It's been on market 33 days. Have you received any prior offers? Is the seller open to a 12% concession, seller financing, or rate buy-down credit?
- Built in 1958 — when were the roof, HVAC, electrical panel, plumbing, and water heater last replaced?
- Is there a deadline driving the sale (1031 exchange, divorce, estate, relocation)? That informs how much negotiation room exists.
- Schools are F-rated, which usually means shorter tenancies and higher turnover. Who's the typical renter profile here, and what's been the actual vacancy rate?
- Crime grade is F in this area — have there been break-ins, vandalism, or insurance claims at this property in the last 3 years? What carrier currently insures it and at what premium?
- What's the average days-on-market for RENTAL listings here right now (not sales)? A rising rental-DOM trend means longer vacancies and softer asking-rent achievability than the comps imply.
- What's the recent tenant-quality profile in this submarket — average credit score on applications, eviction rate, late-payment / NSF rate, and stable-employment percentage? A property-management company in the area should have these aggregated.
- How much new for-sale + rental construction is in the pipeline within 1–3 miles? Heavy new supply typically softens prices + rents 12–24 months out; constrained supply supports both.
Investment metrics
- 1% rule
- 0.88% ✗
- Cap rate
- 7.41%
- Cash-on-cash
- 3.98%
- DSCR
- 1.18
- GRM
- 9.5
CMA / ARV
No comps found within radius.
Projected returns pro-forma
3.12% appreciation · 3.0% rent growth · sell at horizon
- IRR
- 11.5%
- Equity multiple
- 1.66×
- Total profit
- $21,358
- Equity at exit
- $52,497
- IRR
- 13.6%
- Equity multiple
- 3.04×
- Total profit
- $65,527
- Equity at exit
- $81,523
Cash invested: $32,200 (down + closing). Projections, not guarantees.
Landlord ↔ Tenant lean methodology
- Overall (STATE)
- 92 Strongly Landlord-Friendly
- State Arkansas
- 92 Strongly Landlord-Friendly · R+14
- County
- — inherits STATE
- City
- — inherits STATE
ZIP-level market 71260
- Home prices YoY
- 2.5%
- Active inventory
- 1
- Price-to-rent
- 9.5×
Monthly cashflow live
- Estimated rent
- $1,014 medium interval (Pro) →
- Mortgage (P&I)
- −$603
- Tax from tax record
- −$43 /mo · $515/yr
- Insurance
- −$48
- HOA
- −$0
- Vacancy / Maint / Mgmt
- −$213
- Net cashflow
- $107
Break-even live
UW: 25.0% down · 7.5% · 30yr · 1.5% tax · 5.0% vac · 8.0% maint · 8.0% mgmt
Financing live
Cash to close
- Down payment
- $28,750
- Closing costs
- $3,450
- Reserves months
- —
- Total cash needed
- —
Loan-product check · same deal, 3 products live
Conventional
25% down · 7.5% · 30yr
- Down + closing
- —
- Monthly P&I
- —
- Monthly cashflow
- —
- DSCR
- —
- Eligible?
- —
Personal DTI + credit; lowest rate.
DSCR
20% down · 8.5% · 30yr
- Down + closing
- —
- Monthly P&I
- —
- Monthly cashflow
- —
- DSCR
- —
- Eligible?
- —
No personal income docs; deal must DSCR.
Hard money
10% down · 12.0% · 12mo
- Down + closing
- —
- Monthly P&I
- —
- Monthly cashflow
- —
- DSCR
- —
- Eligible?
- —
Short-term bridge; refi at stabilization.
Listing history 14 events
-
2026-06-16days on market $115,000 Active 33 DOM
-
2026-06-15days on market $115,000 Active 32 DOM
-
2026-06-14days on market $115,000 Active 30 DOM
-
2026-06-13days on market $115,000 Active 29 DOM
-
2026-06-10days on market $115,000 Active 27 DOM
-
2026-06-09days on market $115,000 Active 26 DOM
-
2026-06-08days on market $115,000 Active 25 DOM
-
2026-06-07days on market $115,000 Active 24 DOM
-
2026-06-05days on market $115,000 Active 21 DOM
-
2026-06-02days on market $115,000 Active 19 DOM
-
2026-06-01days on market $115,000 Active 18 DOM
-
2026-05-31days on market $115,000 Active 17 DOM
-
2026-05-30days on market $115,000 Active 16 DOM
-
2026-05-14$115,000 Active 653-char remark
ⓘ Source: listings_history table (triggers on properties + properties_extension) + one-shot
backfill from property_details.listing_events for pre-trigger history.
Tax reassessment forecast AR · Resets to sale price
- Current annual tax
- $515 · $43/mo
- Projected year-2 tax
- $736 · $61/mo
- Expected delta
- +$221/yr (+$18/mo · 42.8%)
ⓘ Screening estimate from a state-policy table — verify with the county assessor before closing.
Nearby sold comps map
Loading sold comps map…
Walkable amenities ~0.75 mi
Loading nearby amenities…
Taxation est. · year 1
- Rental income
- $12,165
- − Mortgage interest
- −$6,442
- − Property taxes
- −$515
- − Insurance
- −$575
- − Repairs & maintenance
- −$973
- − Management
- −$973
- − Depreciation
- −$3,345
- Taxable loss
- −$659
- Est. tax savings @ 24.0%
- +$158
- After-tax cash flow
- $1,441/yr
For passive investors: Depreciation is non-cash, so a rental often shows a tax loss while cash-flowing — sheltering income. Rental losses are passive: they offset passive income freely, and up to $25,000/yr can offset ordinary (W-2) income if you actively participate and your MAGI is under $100k (phasing out to $0 by $150k); unused losses carry forward. On sale, claimed depreciation is recaptured at up to 25%, and gains may owe capital-gains tax (a 1031 exchange can defer both). Figures are a year-1 estimate at your 24.0% rate — not tax advice; consult a CPA.
Schools (NCES district)
- District
- Union Parish
- NCES district ID
- 2201770
- Math proficiency
- 12% ▼ -37.00%
- Reading proficiency
- 20% ▼ -34.00%
- Median HH income
- $37,279
- Composite
- 13.35/100
- National rank
- #9537
- State rank
- #74 of 98 in LA
Livability — Huttig
- Score
- 57/100
- State rank
- #369
- US rank
- #22286
Category grades
Schools grade is shown separately in the Schools card above.
Census & demographics
- Population (ZIP)
- 3,232
Population outlook (Union County) Hauer SSP2
- Today (2025)
- 21,722 people
- By 2030
- 21,226 · -2.3%
- By 2040
- 20,026 · -7.8%
- By 2050
- 18,682 · -14.0%
- By 2075
- 15,725 · -27.6%
- By 2100
- 12,509 · -42.4%
Race, ethnicity, and origin ACS 2023
- Neighborhood character
- Predominantly White (76%)
- Race & ethnicity
- White 76% Black 21% Two or more races 2%
- Common ancestry
- Slovak 2% Lithuanian 2%
- Foreign-born
- 0%
- Languages at home
- 99% English-only · Spanish 0%
Political lean MEDSL · Union
- 2024 margin
- Solid R (+57.0) · D 21.1% · R 78.0%
- 2008→2024 swing
- -15.4pp toward R · 2008: -41.5pp · 2024: -57.0pp
- All cycles
- 2024: R+57.0 2020: R+51.4 2016: R+48.5 2012: R+41.7 2008: R+41.5
Not yet ingested
- Civics
- —
Market trends
- HPI YoY
- ▲ 3.12%
- Current HPI
- 128.2115
- Rent YoY
- —
- Metro
- —
- State GDP YoY
- ▲ 3.80%
- F500 in state
- 10
Industry mix (Fortune 500 HQ in AR)
| Industry | F500 HQs | Revenue |
|---|---|---|
| Retail | 1 | $681B |
|
||
| Food / Agriculture | 1 | $53B |
|
||
| Retail / Energy | 1 | $22B |
|
||
| Transportation / Logistics | 1 | $12B |
|
||
| Energy | 1 | $4B |
|
||
Price history
1 event — show timeline
- 2026-05-14 Listed $115,000 NELABOR
Property tax history
+5.1%/yrLatest (2025): $515 · +27.2% YoY. Source: county tax records.
Cash-flow waterfall
monthlySold comps — $/sqft
last 12 mo · ≤1 miLoading sold comps…