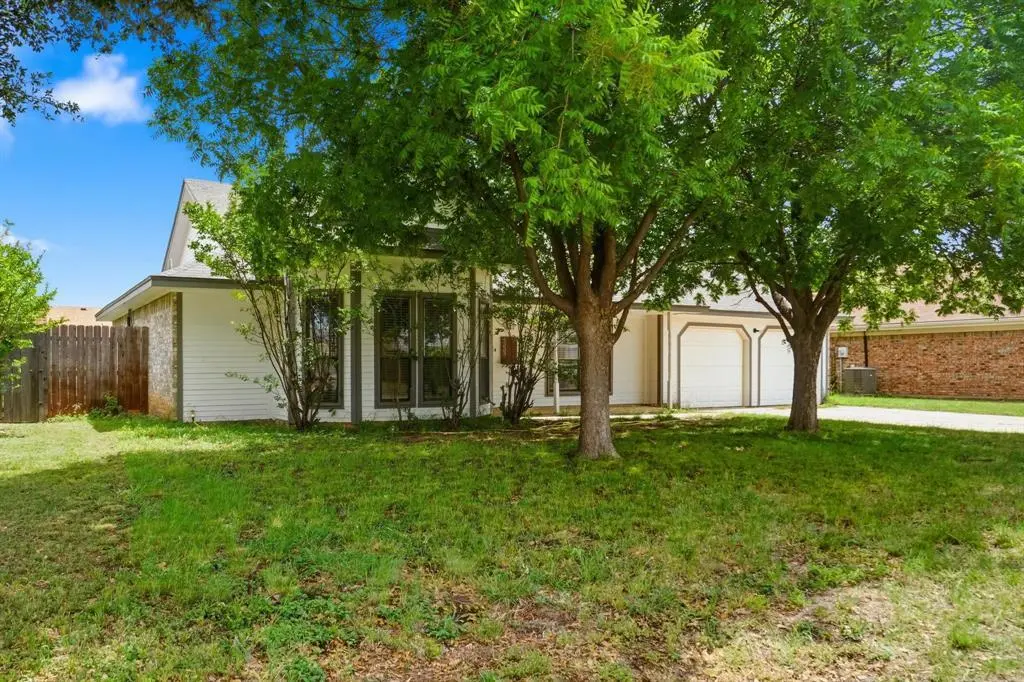
4333 Bluebonnet Ct · Abilene, TX
Flood risk 1/10 · Minimal
- FEMA flood zone
- X (unshaded)
- Chance of flooding over 30 yrs
- 0.0%
- Est. flood insurance / yr
- $507 – $1,088
Fire risk 8/10 · Major
- Est. fire insurance / yr
- $1,222 – $2,270
Heat risk 7/10 · Major
- Hot days now (above 103°F)
- 7 days/yr
- Hot days in 30 yrs
- 23 days/yr
Wind risk 4/10 · Minor
- Chance of severe wind over 30 yrs
- 11.0%
Air-quality risk 1/10 · Minimal
- Unhealthy air days now
- 0 days/yr
- Unhealthy air days in 30 yrs
- 0 days/yr
Risk factors via First Street. Map © Google.
Why this score? — see what drove the C- grade
The composite is a weighted blend of 9 inputs, each scored 0–100. Each bar is that input's sub-score; the figure is the points it added to the 100-point composite (weight × sub-score).
- Cash flow +19.6/30.0
- DSCR +6.2/10.0
- ARV discount +5.9/15.0
- 1% rule +5.8/10.0
- Rent growth +5.0/5.0
- Livability +3.8/5.0
- Schools +2.8/10.0
- Condition / age +2.5/5.0
- Appreciation +0.0/10.0
$225,000
🖨 Deal sheet (PDF) 📄 Offer letter ✓ Due diligence
Listing remarks
Welcome to this inviting 3-bedroom, 2-bath home full of charm, comfort, and space. Large mature trees in the front yard provide wonderful shade and add to the home’s welcoming curb appeal. Step inside to a bright and open living area featuring a beautiful brick wood-burning fireplace that creates a warm and cozy focal point. Natural light flows throughout the home, enhancing the airy feel and making the space feel comfortable and inviting. The eat-in kitchen offers plenty of cabinet and counter space, making it both functional and perfect for everyday living. Whether you’re preparing meals, entertaining guests, or enjoying quiet mornings, this kitchen is designed to fit your nee
Key facts
- Large backyard
- Covered patio
- Eat-in kitchen
Tags
Property features AI
Finance
- HOA & community: No homeowners association
Exterior
- Parking: Attached garage with 2 spaces; 2 covered parking spaces; Driveway
- Utilities: City water; City sewer; Electric service
- Home design: Single-family residence; One story; Residential property
- Construction: Built in 1984; Brick construction; Shingle roof; Slab foundation
- Exterior features: Wood backyard fence
Interior
- Kitchen: Electric cooktop; Electric oven; Microwave
- Bedrooms: 3 bedrooms (primary bedroom on main level)
- Flooring: Carpet; Laminate
- Bathrooms: 2 full bathrooms
- Heating & cooling: Central heating (electric); Central air conditioning; Ceiling fans
- Interior features: Cable TV available; Decorative lighting; High-speed internet available; One living area; One dining area; Fireplace (wood-burning)
Neighborhood map
What this means for you Summary
Snapshot
- This is a 3-bed/2.0-bath single-family listed at $225k.
Deal economics
- At list price, monthly cash flow is $260 ($3k/yr) — positive.
- The deal already cash-flows at list — no discount required.
- Meets the 1% rule at list price ($2k rent vs $225k).
- Recommended offer: $222k (1.5% below list) — sets the bar for market timing.
Location & tenants
- Location reads 75/100 on livability (#142 in TX, #4,037 nationally) — a middle-class / working-renter tenant base. Strengths: cost of living A+, housing A+, health & safety A+; Watch: crime D, commute F.
- Abilene ISD (urban): math 32% / reading 34% proficiency, ranked #575 of 826 in TX (top 70%) — families likely to look elsewhere, expect single-tenant / working-renter base with shorter leases.
- Zoned schools: Ward El (math 38% / reading 40%, grade F, #1,651 of 4,322 statewide, top 39%, 494 students, 52% FRL).
- Market conditions: Rents rising fast (+40.7%/yr); 294 active listings in the ZIP; 6 comparable units currently listed for rent nearby; rentals at typical pace (median 24d on market — plan ~3-4 weeks tenant-placement turnaround); solid renter incomes; 508 units permitted in Taylor County in 2024 (0 in 5+ unit buildings).
- This rent runs 37% of the median local income ($79k/yr) — at the standard rent-burdened threshold; future hikes will face affordability resistance.
Forward outlook
- Local home prices are declining (-3.0%/yr); year-one equity from $2k of loan paydown is wiped out by about $7k of value loss. Plan a longer hold.
- Taylor County population projected at +16% by 2050 — long-run rental-demand tailwind backs the buy-and-hold thesis.
- At projected returns (-3.0% appreciation + 8.0% rent growth), your $63k cash investment doubles in ~9 years — after that, you're playing with house money.
Negotiation context
- It's been on market 22 days — a 2% lower offer ($222k) is reasonable based on typical stale-listing flexibility.
- 3 sale attempts since 4y ago with the ask held roughly flat each time — persistent listings suggest the price (not the market) is what's stuck; bring a comps-based counter.
Risks & watch-outs
- Climate carrying-cost: severe wildfire risk; extreme-heat days projected 7→23/yr by 2055 (HVAC capex compounding) — expect insurance premiums to compound above CPI over the hold.
Questions for the listing agent
- Is there a deadline driving the sale (1031 exchange, divorce, estate, relocation)? That informs how much negotiation room exists.
- Schools are D-rated, which usually means shorter tenancies and higher turnover. Who's the typical renter profile here, and what's been the actual vacancy rate?
- Crime grade is D in this area — have there been break-ins, vandalism, or insurance claims at this property in the last 3 years? What carrier currently insures it and at what premium?
- What's the average days-on-market for RENTAL listings here right now (not sales)? A rising rental-DOM trend means longer vacancies and softer asking-rent achievability than the comps imply.
- What's the recent tenant-quality profile in this submarket — average credit score on applications, eviction rate, late-payment / NSF rate, and stable-employment percentage? A property-management company in the area should have these aggregated.
- How much new for-sale + rental construction is in the pipeline within 1–3 miles? Heavy new supply typically softens prices + rents 12–24 months out; constrained supply supports both.
Investment metrics
- 1% rule
- 1.08% ✓
- Cap rate
- 7.68%
- Cash-on-cash
- 4.94%
- DSCR
- 1.22
- GRM
- 7.7
CMA / ARV
- ARV (median comp)
- $217,454
- List price
- $225,000
- Delta
- 3.47%
- Verdict
- FAIR
- Comps
- 20 within 1.0 mi
Show comp detail 12 sales within ~0.75 mi
| Address | Dist | Beds/Ba | Sqft | Sold | Price | $/sf | Match |
|---|---|---|---|---|---|---|---|
| 4333 Bluebonnet Ct | 0.00mi | 3/2.0 | 1,326 (0%) | 0mo | $225,000 | $170 | 100 |
| 4326 Bruce Dr | 0.02mi | 3/2.0 | 1,510 (+14%) | 6mo | $289,900 | $192 | 71 |
| 3541 Carnation Ct | 0.15mi | 3/2.0 | 1,485 (+12%) | 10mo | $215,000 | $145 | 65 |
| 4441 Carrie Ann Ln | 0.17mi | 3/2.0 | 1,489 (+12%) | 10mo | $259,000 | $174 | 63 |
| 3810 Jester Cir | 0.40mi | 3/2.0 | 1,445 (+9%) | 6mo | $229,900 | $159 | 62 |
| 4502 Pennington Dr | 0.25mi | 3/2.0 | 1,483 (+12%) | 9mo | $229,900 | $155 | 61 |
| 4425 Pennington Dr | 0.19mi | 3/2.0 | 1,510 (+14%) | 10mo | $229,900 | $152 | 60 |
| 4633 Plover Ln | 0.46mi | 3/2.0 | 1,498 (+13%) | 3mo | $174,900 | $117 | 54 |
| 3102 Primrose Dr | 0.46mi | 3/2.0 | 1,520 (+15%) | 10mo | $230,000 | $151 | 46 |
| 3153 Curry Ln | 0.69mi | 2/2.0 (-1) | 1,450 (+9%) | 4mo | $225,000 | $155 | 44 |
| 3742 Crossroads Dr | 0.69mi | 2/2.5 (-1) | 1,188 (-10%) | 10mo | $165,000 | $139 | 35 |
| 29 Crossroads Dr | 0.73mi | 2/1.0 (-1) | 1,132 (-15%) | 9mo | $159,900 | $141 | 25 |
Match score weights: distance 35% · size 25% · config 20% · recency 20%. Top-matched comps best support the ARV.
Projected returns pro-forma
-3.0% appreciation · 8.0% rent growth · sell at horizon
- IRR
- -2.8%
- Equity multiple
- 0.89×
- Total profit
- $-7,036
- Equity at exit
- $33,548
- IRR
- 12.0%
- Equity multiple
- 2.17×
- Total profit
- $73,790
- Equity at exit
- $19,454
Cash invested: $63,000 (down + closing). Projections, not guarantees.
Landlord ↔ Tenant lean methodology
- Overall (STATE)
- 87 Strongly Landlord-Friendly
- State Texas
- 87 Strongly Landlord-Friendly · R+5
- County
- — inherits STATE
- City
- — inherits STATE
ZIP-level market 79606
- Rents YoY
- 40.7%
- Active inventory
- 294
- Price-to-rent
- 7.7×
Monthly cashflow live
- Estimated rent
- $2,421 high interval (Pro) →
- Mortgage (P&I)
- −$1,180
- Tax from tax record
- −$379 /mo · $4,554/yr
- Insurance
- −$94
- HOA
- −$0
- Lot rent
- −$0
- Vacancy / Maint / Mgmt
- −$508
- Net cashflow
- $260
Break-even live
Sensitivity live
| Price | -10% $387 | -5% $323 | +0% $260 | +5% $196 | +10% $132 |
|---|---|---|---|---|---|
| Rent | -10% $68 | -5% $164 | +0% $260 | +5% $355 | +10% $451 |
| Rate | -1.0pp $373 | -0.5pp $317 | base $260 | +0.5pp $201 | +1.0pp $142 |
UW: 25.0% down · 7.5% · 30yr · 1.5% tax · 5.0% vac · 8.0% maint · 8.0% mgmt
Financing live
Cash to close
- Down payment
- $56,250
- Closing costs
- $6,750
- Reserves months
- —
- Total cash needed
- —
Loan-product check · same deal, 3 products live
Conventional
25% down · 7.5% · 30yr
- Down + closing
- —
- Monthly P&I
- —
- Monthly cashflow
- —
- DSCR
- —
- Eligible?
- —
Personal DTI + credit; lowest rate.
DSCR
20% down · 8.5% · 30yr
- Down + closing
- —
- Monthly P&I
- —
- Monthly cashflow
- —
- DSCR
- —
- Eligible?
- —
No personal income docs; deal must DSCR.
Hard money
10% down · 12.0% · 12mo
- Down + closing
- —
- Monthly P&I
- —
- Monthly cashflow
- —
- DSCR
- —
- Eligible?
- —
Short-term bridge; refi at stabilization.
Rent comps 6 comps
| Address | Beds | Baths | Sqft | Rent | $/sqft | DOM | Units | Dist |
|---|---|---|---|---|---|---|---|---|
| 3134 Winterhawk Dr Abilene, TX | 3.0 | 2.0 | 1800 | $2,795 | $1.55 | 9d | 1 | 0.53mi |
| 3826 Crest Way Abilene, TX | 3.0 | 2.0 | 1721 | $2,695 | $1.57 | 46d | 1 | 0.54mi |
| 4925 Greenslope Dr Unit C Abilene, TX | 3.0 | 2.0 | 1100 | $1,900 | $1.73 | 15d | 1 | 0.80mi |
| 2701 S 40th St Abilene, TX | 3.0 | 2.0 | 1196 | $1,995 | $1.67 | 23d | 1 | 0.94mi |
| 3373 S 27th St Abilene, TX | 2.0 | 2.0 | 1436 | $1,700 | $1.18 | 46d | 1 | 1.30mi |
| 2601 Edgemont Dr Abilene, TX | 2.0 | 2.0 | 1624 | $2,495 | $1.54 | 23d | 1 | 1.42mi |
Listing history 16 events
-
2026-06-03status $225,000 Pending 22 DOM
-
2026-06-02days on market $225,000 Active Option Contract 22 DOM
-
2026-06-01days on market $225,000 Active Option Contract 21 DOM
-
2026-05-31days on market $225,000 Active Option Contract 20 DOM
-
2026-05-30days on market $225,000 Active Option Contract 19 DOM
-
2026-05-17historical Active Option Contract 1086-char remark
-
2026-05-11status Active 1086-char remark
-
2026-05-08$225,000 Active 1086-char remark
-
2023-03-24soldstatus
-
2023-03-23soldstatus Closed
-
2023-02-26status Pending
-
2023-02-20historical Active Option Contract
-
2023-01-05price $213,900
-
2023-01-05price $214,000
-
2022-11-17$219,000 Active
-
1992-11-02soldstatus
ⓘ Source: listings_history table (triggers on properties + properties_extension) + one-shot
backfill from property_details.listing_events for pre-trigger history.
Tax reassessment forecast TX · Resets to sale price
- Current annual tax
- $4,554 · $379/mo
- Projected year-2 tax
- $4,554 · $379/mo
- Expected delta
- $0/yr ($0/mo · 0.0%)
ⓘ Screening estimate from a state-policy table — verify with the county assessor before closing.
Climate risk First Street
- Flood 1/10 Low FEMA zone X (unshaded) · 0% chance over 30 yrs
- Wildfire 8/10 Severe
- Heat 7/10 Severe 7 d/yr ≥103°F today · 23 d/yr by 30 yrs out
- Wind 4/10 Moderate 11% chance of damaging wind over 30 yrs
- Air quality 1/10 Low 0 unhealthy d/yr today · 0 by 30 yrs out
Nearby sold comps map
Loading sold comps map…
Walkable amenities ~0.75 mi
Loading nearby amenities…
Taxation est. · year 1
- Rental income
- $29,054
- − Mortgage interest
- −$12,603
- − Property taxes
- −$4,554
- − Insurance
- −$1,125
- − Repairs & maintenance
- −$2,324
- − Management
- −$2,324
- − Depreciation
- −$6,545
- Taxable loss
- −$422
- Est. tax savings @ 24.0%
- +$101
- After-tax cash flow
- $3,216/yr
For passive investors: Depreciation is non-cash, so a rental often shows a tax loss while cash-flowing — sheltering income. Rental losses are passive: they offset passive income freely, and up to $25,000/yr can offset ordinary (W-2) income if you actively participate and your MAGI is under $100k (phasing out to $0 by $150k); unused losses carry forward. On sale, claimed depreciation is recaptured at up to 25%, and gains may owe capital-gains tax (a 1031 exchange can defer both). Figures are a year-1 estimate at your 24.0% rate — not tax advice; consult a CPA.
Schools (NCES district)
- District
- Abilene ISD
- NCES district ID
- 4807440
- Math proficiency
- 32% ▼ -11.00%
- Reading proficiency
- 34% ▼ -5.00%
- Median HH income
- $39,782
- Composite
- 27.71/100
- National rank
- #6909
- State rank
- #575 of 826 in TX
Livability — Abilene
- Score
- 75/100
- State rank
- #142
- US rank
- #4037
Category grades
Schools grade is shown separately in the Schools card above.
Census & demographics
- Census place
- Abilene, TX
- County
- Taylor County · 136,672 people
- City population
- 136,672
- Metro
- Abilene, TX
- Population (ZIP)
- 29,182
- Household income
- $79,196
- Rent vs Own
- Severe rent burden
- 1181.0
Population outlook (Taylor County) Hauer SSP2
- Today (2025)
- 145,270 people
- By 2030
- 150,050 · +3.3%
- By 2040
- 159,417 · +9.7%
- By 2050
- 168,883 · +16.3%
- By 2075
- 194,436 · +33.8%
- By 2100
- 203,163 · +39.9%
Race, ethnicity, and origin ACS 2023
- Neighborhood character
- Predominantly White (69%)
- Race & ethnicity
- White 69% Hispanic / Latino 19% Two or more races 11% Black 6% Asian 4%
- Hispanic origin (detail)
- Mexican 14%
- Common ancestry
- Italian 4% Slovak 2% Serbian 1%
- Foreign-born
- 7% · Canada, Vietnam
- Languages at home
- 86% English-only · Spanish 10% Tagalog/Filipino 1% Other Indo-European 1%
Political lean MEDSL · Taylor
- 2024 margin
- Solid R (+49.8) · D 24.6% · R 74.4% · Other 1.0%
- 2008→2024 swing
- -4.2pp toward R · 2008: -45.6pp · 2024: -49.8pp
- All cycles
- 2024: R+49.8 2020: R+45.3 2016: R+51.1 2012: R+53.6 2008: R+45.6
Not yet ingested
- Civics
- —
Market trends
- HPI YoY
- ▼ -167.33%
- Current HPI
- 179.2555
- Rent YoY
- ▲ 40.73%
- Metro
- Abilene, TX
- State GDP YoY
- ▲ 3.95%
- F500 in state
- 110
Industry mix (Fortune 500 HQ in TX)
| Industry | F500 HQs | Revenue |
|---|---|---|
| Energy | 16 | $1,198B |
|
||
| Technology | 5 | $198B |
|
||
| Engineering / Construction | 4 | $72B |
|
||
| Energy Services | 3 | $60B |
|
||
| Utilities | 3 | $41B |
|
||
| Healthcare | 2 | $330B |
|
||
Price history
+2.7% since first listed13 events — show timeline
- 2026-06-12 Sold (MLS) — NTREIS
- 2026-06-02 Pending — NTREIS
- 2026-05-17 Contingent — NTREIS
- 2026-05-11 Relisted — NTREIS
- 2026-05-08 Listed $225,000 NTREIS
- 2023-03-24 Sold (Public Records) — Public Records
- 2023-03-23 Sold (MLS) — NTREIS
- 2023-02-26 Pending — NTREIS
- 2023-02-20 Contingent — NTREIS
- 2023-01-05 Price Changed $213,900 NTREIS
- 2023-01-05 Price Changed $214,000 NTREIS
- 2022-11-17 Listed $219,000 NTREIS
- 1992-11-02 Sold (Public Records) — Public Records
Property tax history
+6.3%/yrLatest (2025): $4,554 · +7.2% YoY. Source: county tax records.
Cash-flow waterfall
monthlySold comps — $/sqft
last 12 mo · ≤1 miLoading sold comps…