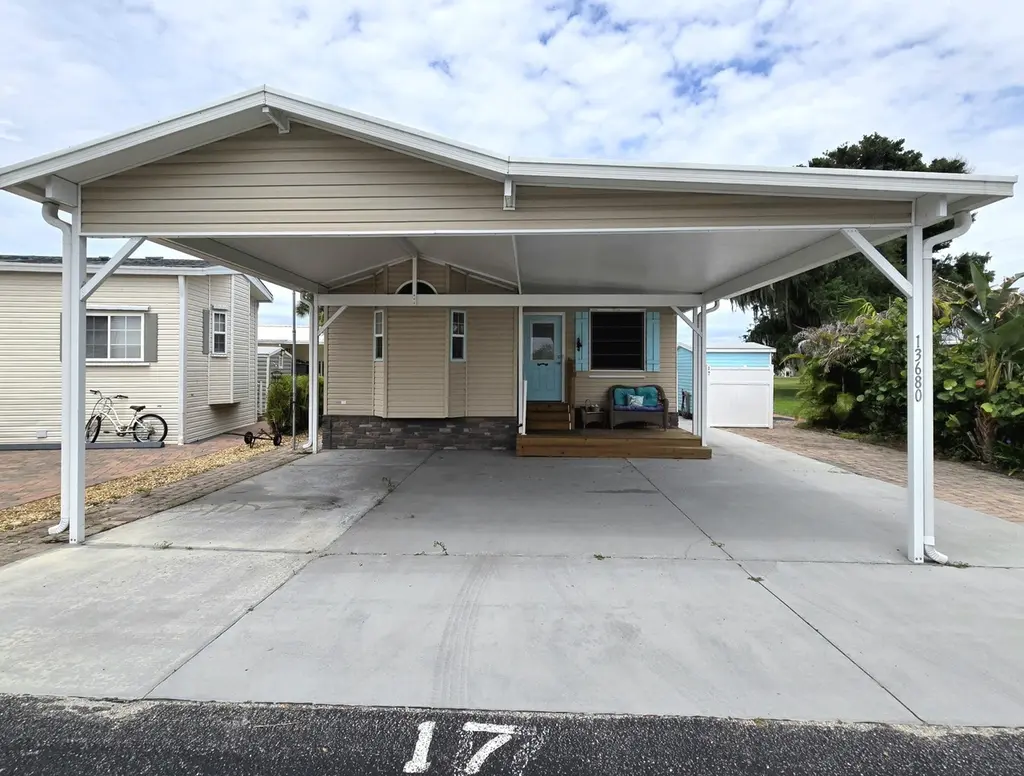
13680 NW 127th Ter #17 · Taylor Creek, FL
Flood risk 1/10 · Minimal
- FEMA flood zone
- X (unshaded)
- Chance of flooding over 30 yrs
- 0.0%
- Est. flood insurance / yr
- $507 – $1,088
Fire risk 5/10 · Moderate
- Est. fire insurance / yr
- $947 – $1,759
Heat risk 9/10 · Severe
- Hot days now (above 107°F)
- 7 days/yr
- Hot days in 30 yrs
- 26 days/yr
Wind risk 10/10 · Severe
- Chance of severe wind over 30 yrs
- 99.0%
Air-quality risk 2/10 · Minimal
- Unhealthy air days now
- 2 days/yr
- Unhealthy air days in 30 yrs
- 2 days/yr
Risk factors via First Street. Map © Google.
Why this score? — see what drove the D grade
The composite is a weighted blend of 9 inputs, each scored 0–100. Each bar is that input's sub-score; the figure is the points it added to the 100-point composite (weight × sub-score).
- Cash flow +13.0/30.0
- ARV discount +7.5/15.0
- DSCR +3.9/10.0
- Condition / age +3.8/5.0
- 1% rule +3.7/10.0
- Schools +3.6/10.0
- Livability +2.8/5.0
- Rent growth +2.5/5.0
- Appreciation +0.0/10.0
$144,000
🖨 Deal sheet 📄 Offer letter ✓ Due diligence
Listing remarks
Welcome to this exquisite 1 bdrm, 1 ba 2014 home w/ 945 lvg sf & 3,031 total sf. Living Room features large windows overlooking golf course. Kitchen has newer appliances, including DW. Bonus room can be used for office or guest room - temporary wall can be removed for additional living space. Ceiling Fans. 8 x 10 shed. Slab walkway w/ pavers provide additional outdoor living space. Great location for golfers and boating enthusiasts. Dock space & boat ramp available; providing Lake Okeechobee access. Active community offers newer pickleball court, clubhouse, shuffleboard court and pool. This home has been tastefully decorated and comes furnished.
Key facts
- Newer appliances
- Bonus room
- Dock space
Tags
Property features AI
Finance
- Other: Pets allowed (dogs OK) with possible breed/size restrictions
- HOA & community: Association: Blue Cypress Golf & RV Resort; Monthly association fee; Association covers grounds maintenance, water, sewer, common areas, recreation facilities and pool service; Community amenities include clubhouse, pool, golf course, putting green, tennis, pickleball and shuffleboard courts, jogging paths, fishing pier, storage, maintenance and recreation facilities; Senior community
Exterior
- Parking: Total 3 parking spaces; Attached covered carport for 2 cars; Driveway parking; 1 open parking space; Golf cart parking; Concrete surfaces
- Utilities: Public water; Public sewer; Electricity connected (underground); Underground utilities; Water connected; Sewer connected
- Home design: Manufactured home; One story; Faces south; Resale condition
- Construction: Vinyl siding; Metal roof; Slab foundation; Stone skirting; Model SKLI
- Exterior features: Covered and open patio; Open porch; Shed(s); On golf course; Asphalt road; private maintained road
Interior
- Kitchen: Dishwasher; Gas range; Microwave; Refrigerator; Electric water heater
- Bedrooms: 1 bedroom on the main level
- Flooring: Ceramic tile; Laminate; Wood
- Bathrooms: 1 full bathroom on the main level
- Heating & cooling: Central heating; Central air; Ceiling fans
- Interior features: Vaulted ceilings; Furnished
- Laundry & utility: Laundry closet on the main level
Neighborhood map
What this means for you Summary
Snapshot
- This is a 1-bed/1.0-bath manufactured listed at $144k. Condition is rated good.
Deal economics
- At list price, monthly cash flow is $-8 ($-90/yr) — negative.
- To cash-flow at today's rent, offer at most $143k (0.8% below list).
- To meet the 1% rule (rent ≥ 1% of price), the offer needs to be $125k (13.2% below list).
- Recommended offer: $125k (13.2% below list) — sets the bar for 1% rule.
- Cap rate 6.2% vs local median 4.1% in Taylor Creek — top-decile yield for the area; either an underpriced asset or a hidden risk that comps aren't pricing in. Stress-test before assuming the spread holds.
Location & tenants
- Location reads 56/100 on livability (#874 in FL) — a working-class tenant base; expect higher turnover. Strengths: cost of living A+, housing A+, crime B+; Watch: amenities F, commute F, employment F.
- Okeechobee (town): math 44% / reading 42% proficiency, ranked #58 of 73 in FL (top 80%) — families likely to look elsewhere, expect single-tenant / working-renter base with shorter leases; 72% free/reduced lunch — lower-income household profile, screen leases tightly.
- Zoned schools: Everglades Elementary School (math 53% / reading 52%, grade C-, #976 of 2,144 statewide, top 46%, 760 students, 76% FRL); Osceola Middle School (math 53% / reading 36%, grade D, #320 of 571 statewide, top 57%, 753 students, 67% FRL); Okeechobee High School (math 30% / reading 42%, grade F, #359 of 667 statewide, top 55%, 1,692 students, 62% FRL) — zoned schools at 68% FRL track the district average.
- Market conditions: 402 active listings in the ZIP; 18 units permitted in Okeechobee County in 2024 (0 in 5+ unit buildings).
Forward outlook
- Local home prices are declining (-3.0%/yr); year-one equity from $996 of loan paydown is wiped out by about $4k of value loss. Plan a longer hold.
- Okeechobee County population projected at -21% by 2050 — secular population decline; favor cash flow + early exit over multi-decade hold.
Negotiation context
- It's been on market 15 days — a 2% lower offer ($142k) is reasonable based on typical stale-listing flexibility.
- 6 sale attempts since 2y ago with the ask held roughly flat each time — persistent listings suggest the price (not the market) is what's stuck; bring a comps-based counter.
Risks & watch-outs
- Climate carrying-cost: severe wind risk, 99% chance of damaging wind over 30y; moderate wildfire risk; extreme-heat days projected 7→26/yr by 2055 (HVAC capex compounding) — expect insurance premiums to compound above CPI over the hold.
Questions for the listing agent
- What do current leases actually rent for vs. the listed asking? Can we see a recent rent roll and the last 12 months of T-12 income?
- Is there a deadline driving the sale (1031 exchange, divorce, estate, relocation)? That informs how much negotiation room exists.
- Schools are F-rated, which usually means shorter tenancies and higher turnover. Who's the typical renter profile here, and what's been the actual vacancy rate?
- The area grade is low — what's the realistic commute time and amenity access for the typical tenant pool here? Any planned neighborhood developments (good or bad) we should know about?
- What's the average days-on-market for RENTAL listings here right now (not sales)? A rising rental-DOM trend means longer vacancies and softer asking-rent achievability than the comps imply.
- What's the recent tenant-quality profile in this submarket — average credit score on applications, eviction rate, late-payment / NSF rate, and stable-employment percentage? A property-management company in the area should have these aggregated.
- How much new for-sale + rental construction is in the pipeline within 1–3 miles? Heavy new supply typically softens prices + rents 12–24 months out; constrained supply supports both.
Investment metrics
- 1% rule
- 0.87% ✗
- Cap rate
- 6.23%
- Cash-on-cash
- -0.22%
- DSCR
- 0.99
- GRM
- 9.6
CMA / ARV
- ARV (on-the-fly)
- $73,710
- Comps found
- 3
Show comp detail 3 sales within ~0.75 mi
| Address | Dist | Beds/Ba | Sqft | Sold | Price | $/sf | Match |
|---|---|---|---|---|---|---|---|
| 13560 SE 127th Ter | 0.10mi | 2/2.0 (+1) | 917 (-3%) | 5mo | $130,000 | $142 | 77 |
| 12531 SE 140th Rd #118 | 0.18mi | 2/1.5 (+1) | 903 (-4%) | 4mo | $70,000 | $78 | 74 |
| 12311 SE 138th Blvd | 0.26mi | 1/1.0 | 822 (-13%) | 6mo | $48,000 | $58 | 61 |
Match score weights: distance 35% · size 25% · config 20% · recency 20%. Top-matched comps best support the ARV.
Projected returns pro-forma
-3.0% appreciation · 3.0% rent growth · sell at horizon
- IRR
- -16.7%
- Equity multiple
- 0.41×
- Total profit
- $-23,794
- Equity at exit
- $21,471
- IRR
- -8.4%
- Equity multiple
- 0.47×
- Total profit
- $-21,258
- Equity at exit
- $12,450
Cash invested: $40,320 (down + closing). Projections, not guarantees.
Landlord ↔ Tenant lean methodology
- Overall (STATE)
- 87 Strongly Landlord-Friendly
- State Florida
- 87 Strongly Landlord-Friendly · R+3
- County
- — inherits STATE
- City
- — inherits STATE
ZIP-level market 34974
- Home prices YoY
- -15.6%
- Active inventory
- 402
- Price-to-rent
- 9.6×
Monthly cashflow live
- Estimated rent
- $1,250 medium interval (Pro) →
- Mortgage (P&I)
- −$755
- Tax est. 1.5%
- −$180 /mo · $2,160/yr
- Insurance
- −$60
- HOA
- −$0
- Vacancy / Maint / Mgmt
- −$263
- Net cashflow
- $-8
Break-even live
UW: 25.0% down · 7.5% · 30yr · 1.5% tax · 5.0% vac · 8.0% maint · 8.0% mgmt
Financing live
Cash to close
- Down payment
- $36,000
- Closing costs
- $4,320
- Reserves months
- —
- Total cash needed
- —
Loan-product check · same deal, 3 products live
Conventional
25% down · 7.5% · 30yr
- Down + closing
- —
- Monthly P&I
- —
- Monthly cashflow
- —
- DSCR
- —
- Eligible?
- —
Personal DTI + credit; lowest rate.
DSCR
20% down · 8.5% · 30yr
- Down + closing
- —
- Monthly P&I
- —
- Monthly cashflow
- —
- DSCR
- —
- Eligible?
- —
No personal income docs; deal must DSCR.
Hard money
10% down · 12.0% · 12mo
- Down + closing
- —
- Monthly P&I
- —
- Monthly cashflow
- —
- DSCR
- —
- Eligible?
- —
Short-term bridge; refi at stabilization.
Listing history 12 events
-
2026-06-19days on market $144,000 Active 15 DOM
-
2026-06-18days on market $144,000 Active 14 DOM
-
2026-06-17days on market $144,000 Active 13 DOM
-
2026-06-16days on market $144,000 Active 12 DOM
-
2026-06-15days on market $144,000 Active 11 DOM
-
2026-06-14days on market $144,000 Active 9 DOM
-
2026-06-10days on market $144,000 Active 6 DOM
-
2026-06-09days on market $144,000 Active 5 DOM
-
2026-06-08days on market $144,000 Active 4 DOM
-
2026-06-07days on market $144,000 Active 3 DOM
-
2026-06-05remarks 659-char remark
-
2026-06-05$144,000 Active 1 DOM
ⓘ Source: listings_history table (triggers on properties + properties_extension) + one-shot
backfill from property_details.listing_events for pre-trigger history.
Climate risk First Street
- Flood 1/10 Low FEMA zone X (unshaded) · 0% chance over 30 yrs
- Wildfire 5/10 Major
- Heat 9/10 Extreme 7 d/yr ≥107°F today · 26 d/yr by 30 yrs out
- Wind 10/10 Extreme 99% chance of damaging wind over 30 yrs
- Air quality 2/10 Low 2 unhealthy d/yr today · 2 by 30 yrs out
Nearby sold comps map
Loading sold comps map…
Walkable amenities ~0.75 mi
Loading nearby amenities…
Taxation est. · year 1
- Rental income
- $15,002
- − Mortgage interest
- −$8,066
- − Property taxes
- −$2,160
- − Insurance
- −$720
- − Repairs & maintenance
- −$1,200
- − Management
- −$1,200
- − Depreciation
- −$4,189
- Taxable loss
- −$2,534
- Est. tax savings @ 24.0%
- +$608
- After-tax cash flow
- $518/yr
For passive investors: Depreciation is non-cash, so a rental often shows a tax loss while cash-flowing — sheltering income. Rental losses are passive: they offset passive income freely, and up to $25,000/yr can offset ordinary (W-2) income if you actively participate and your MAGI is under $100k (phasing out to $0 by $150k); unused losses carry forward. On sale, claimed depreciation is recaptured at up to 25%, and gains may owe capital-gains tax (a 1031 exchange can defer both). Figures are a year-1 estimate at your 24.0% rate — not tax advice; consult a CPA.
Condition & rehab AI · 13 photos
This 2014 manufactured home is in good condition with cosmetic updates needed to enhance its curb appeal and interior aesthetics. It offers a great location with access to golfing and boating amenities.
Value-add opportunities
- Both Painting the exterior and interior walls — Fresh paint enhances curb appeal and interior aesthetics.
- Both Updating the kitchen backsplash — A new backsplash can modernize the kitchen and add value.
- Both Upgrading the flooring — Newer flooring can improve the overall look and feel of the home.
- Both Adding a smart home system — Modern technology can increase the home's appeal and marketability.
- Both Landscaping improvements — Enhanced landscaping can boost curb appeal and attract more potential buyers/renters.
Renovation cost estimate screening
Value-add ROI direction
- Both Painting the exterior and interior walls — Fresh paint enhances curb appeal and interior aesthetics. ↑
- Both Updating the kitchen backsplash — A new backsplash can modernize the kitchen and add value. ↑
- Both Upgrading the flooring — Newer flooring can improve the overall look and feel of the home. ↑
- Both Adding a smart home system — Modern technology can increase the home's appeal and marketability. ↑
- Both Landscaping improvements — Enhanced landscaping can boost curb appeal and attract more potential buyers/renters. ↑
ⓘ Cost ranges are severity-bucket heuristics (US national rule-of-thumb). Get contractor quotes + a written scope before underwriting a rehab budget.
Schools (NCES district)
- District
- Okeechobee
- NCES district ID
- 1201410
- Math proficiency
- 44% ▼ -12.00%
- Reading proficiency
- 42% ▼ -4.00%
- Median HH income
- $36,710
- Composite
- 35.73/100
- National rank
- #4855
- State rank
- #58 of 73 in FL
Livability — Taylor Creek
- Score
- 56/100
- State rank
- #874
- US rank
- #23017
Category grades
Schools grade is shown separately in the Schools card above.
Census & demographics
- County
- Okeechobee County · 23,975 people
- Metro
- Okeechobee, FL
- Population (ZIP)
- 23,975
- Household income
- $53,013
- Rent vs Own
- Severe rent burden
- 399.0
Population outlook (Okeechobee County) Hauer SSP2
- Today (2025)
- 37,273 people
- By 2030
- 35,885 · -3.7%
- By 2040
- 32,931 · -11.6%
- By 2050
- 29,433 · -21.0%
- By 2075
- 19,607 · -47.4%
- By 2100
- 11,814 · -68.3%
Race, ethnicity, and origin ACS 2023
- Neighborhood character
- Predominantly White (74%)
- Race & ethnicity
- White 74% Hispanic / Latino 19% Two or more races 8% Asian 2% Black 2% Native American 1%
- Hispanic origin (detail)
- Mexican 12% Puerto Rican 1% Cuban 2%
- Common ancestry
- Lithuanian 2% Iranian 2% Italian 2%
- Foreign-born
- 11% · Canada, Jamaica
- Languages at home
- 81% English-only · Spanish 16% French/Haitian/Cajun 1% Other Indo-European 1%
Political lean MEDSL · Okeechobee
- 2024 margin
- Solid R (+53.8) · D 22.9% · R 76.7%
- 2008→2024 swing
- -34.6pp toward R · 2008: -19.2pp · 2024: -53.8pp
- All cycles
- 2024: R+53.8 2020: R+44.4 2016: R+39.5 2012: R+20.0 2008: R+19.2
Not yet ingested
- Civics
- —
Market trends
- HPI YoY
- ▼ -64.47%
- Current HPI
- 348.6692
- Rent YoY
- —
- Metro
- Okeechobee, FL
- State GDP YoY
- ▲ 3.28%
- F500 in state
- 36
Industry mix (Fortune 500 HQ in FL)
| Industry | F500 HQs | Revenue |
|---|---|---|
| Industrial Technology | 2 | $29B |
|
||
| Insurance | 2 | $17B |
|
||
| Retail | 1 | $60B |
|
||
| Technology Distribution | 1 | $58B |
|
||
| Homebuilding | 1 | $35B |
|
||
| Technology Manufacturing | 1 | $35B |
|
||
Price history
-19.6% since first listed16 events — show timeline
- 2026-06-03 Listed $144,000 Beaches MLS
- 2026-04-30 Listing Removed — Beaches MLS
- 2025-11-13 Price Changed $149,000 Beaches MLS
- 2025-10-07 Listed $157,000 Beaches MLS
- 2025-10-01 Listing Removed — Beaches MLS
- 2025-03-28 Price Changed $157,000 Beaches MLS
- 2025-03-02 Relisted — Beaches MLS
- 2025-03-01 Listing Removed — Beaches MLS
- 2025-01-07 Price Changed $164,900 Beaches MLS
- 2024-12-03 Relisted — Beaches MLS
- 2024-11-30 Listing Removed — Beaches MLS
- 2024-11-09 Price Changed $169,500 Beaches MLS
- 2024-11-04 Relisted — Beaches MLS
- 2024-11-01 Listing Removed — Beaches MLS
- 2024-08-14 Price Changed $174,500 Beaches MLS
- 2024-04-20 Listed $179,000 Beaches MLS
Cash-flow waterfall
monthlySold comps — $/sqft
last 12 mo · ≤1 miLoading sold comps…