125 Lake Dr · Odenville, AL
Flood risk 8/10 · Major
- FEMA flood zone
- X (unshaded)
- Chance of flooding over 30 yrs
- 0.99%
- Est. flood insurance / yr
- $507 – $1,088
Fire risk 5/10 · Moderate
- Est. fire insurance / yr
- $916 – $1,700
Heat risk 6/10 · Moderate
- Hot days now (above 105°F)
- 7 days/yr
- Hot days in 30 yrs
- 20 days/yr
Wind risk 5/10 · Moderate
- Chance of severe wind over 30 yrs
- 26.0%
Air-quality risk 2/10 · Minimal
- Unhealthy air days now
- 1 days/yr
- Unhealthy air days in 30 yrs
- 3 days/yr
Risk factors via First Street. Map © Google.
Why this score? — see what drove the B- grade
The composite is a weighted blend of 9 inputs, each scored 0–100. Each bar is that input's sub-score; the figure is the points it added to the 100-point composite (weight × sub-score).
- Cash flow +30.0/30.0
- DSCR +10.0/10.0
- 1% rule +9.0/10.0
- ARV discount +5.2/15.0
- Livability +3.4/5.0
- Schools +3.2/10.0
- Rent growth +2.5/5.0
- Condition / age +2.5/5.0
- Appreciation +0.0/10.0
$139,000
🖨 Deal sheet 📄 Offer letter ✓ Due diligence
Listing remarks
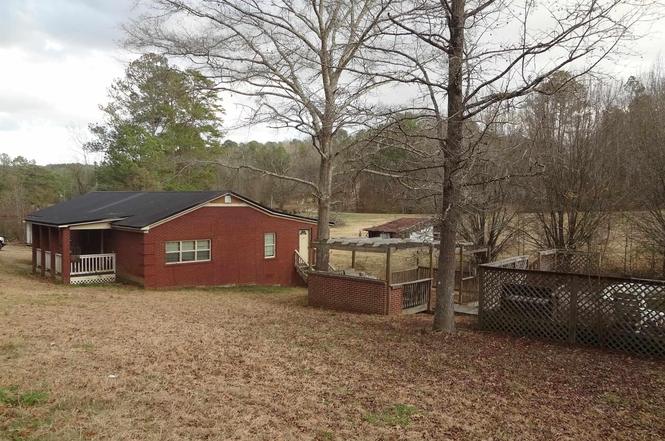
Full brick, 4 bedroom, 2 bath home on a little over a half acre out in the country! Nice pond out to he side for a little afternoon fishing and a nice firepit area to enjoy cool nights. This home needs some TLC but could be a doll house when done! HVAC is approx 5 years old. The front portion of this home is a mobile home but as per the owners it has been assessed with the county as a home.
Key facts
- Full brick
- Firepit area
- Hvac
Tags
Property features AI
Finance
- Other: Lot size approximately 0.7 acres
- Financial info: Down payment assistance available
- HOA & community: Garbage fee charged quarterly
Exterior
- Parking: Driveway parking
- Security: No security features listed
- Utilities: Public water; Septic system; Electric water heater; Internet service availability
- Home design: Existing home; Four-sided brick construction
- Construction: Crawl space foundation
- Exterior features: Covered deck; No pool; No patio; No garden/patio; Not waterfront
Interior
- Kitchen: Laminate countertops; Gas oven; Gas stove; Refrigerator
- Bedrooms: Multiple bedrooms located on the main level, including a master bedroom
- Flooring: Carpet; Hardwood
- Bathrooms: Two full bathrooms; Master bath plus a separate shower and tub/shower combination
- Heating & cooling: Central heating; Central cooling
- Interior features: Ceilings: Other (see remarks); No additional built-in interior features listed
- Laundry & utility: Main-level laundry room; Washer hookup; Electric dryer hookup
Neighborhood map
What this means for you Summary
Snapshot
- This is a 4-bed/2.0-bath single-family listed at $139k.
Deal economics
- At list price, monthly cash flow is $642 ($8k/yr) — positive.
- The deal already cash-flows at list — no discount required.
- Meets the 1% rule at list price ($2k rent vs $139k).
- Recommended offer: $126k (9.0% below list) — sets the bar for market timing.
- Cap rate 12.4% vs local median 4.7% in Odenville — top-decile yield for the area; either an underpriced asset or a hidden risk that comps aren't pricing in. Stress-test before assuming the spread holds.
Location & tenants
- Location reads 67/100 on livability (#80 in AL) — a middle-class / working-renter tenant base. Strengths: employment A+, cost of living A+, housing A+; Watch: amenities F, commute F, health & safety F.
- St Clair County (rural): math 21% / reading 52% proficiency, ranked #33 of 129 in AL (top 26%) — families likely to look elsewhere, expect single-tenant / working-renter base with shorter leases.
- Zoned schools: Odenville Elementary School (436 students, 67% FRL); Saint Clair County High School (math 17% / reading 22%, grade F, #169 of 305 statewide, top 59%, 622 students, 58% FRL) — zoned schools average 63% FRL vs 41% district-wide (22 pts higher); higher-poverty schools than district average — tighter screening recommended.
- Zoned-school proficiency averages 20% at this address vs 36% district-wide (-17 pts) — the specific schools serving this property underperform the St Clair County average; the district grade overstates school quality for this exact location.
- Market conditions: 172 active listings in the ZIP; solid renter incomes; 557 units permitted in St. Clair County in 2024 (0 in 5+ unit buildings).
Forward outlook
- Local home prices are declining (-3.0%/yr); year-one equity from $961 of loan paydown is wiped out by about $4k of value loss. Plan a longer hold.
- St. Clair County population projected at +11% by 2050 — modest demand growth; plan on rents tracking national, not racing it.
- At projected returns (-3.0% appreciation + 3.0% rent growth), your $39k cash investment doubles in ~7 years — after that, you're playing with house money.
Negotiation context
- It's been on market 106 days — a 9% lower offer ($126k) is reasonable based on typical stale-listing flexibility.
- Current owner paid $80k; list at $139k implies a 74% gain — meaningful room to come down on a strong offer.
Risks & watch-outs
- Watch-outs: flood insurance adds $66/mo.
- Climate carrying-cost: severe flood risk; moderate wind risk, 26% chance of damaging wind over 30y; moderate wildfire risk; extreme-heat days projected 7→20/yr by 2055 (HVAC capex compounding) — expect insurance premiums to compound above CPI over the hold.
Questions for the listing agent
- It's been on market 106 days. Have you received any prior offers? Is the seller open to a 9% concession, seller financing, or rate buy-down credit?
- What's the actual annual flood-insurance premium (NFIP or private), and is the property in a SFHA with mandatory coverage?
- Why hasn't it sold? Are there any deal-killer items the seller is aware of (foundation, flood, title, zoning, code violations)?
- Is there a deadline driving the sale (1031 exchange, divorce, estate, relocation)? That informs how much negotiation room exists.
- Schools are D-rated, which usually means shorter tenancies and higher turnover. Who's the typical renter profile here, and what's been the actual vacancy rate?
- What's the average days-on-market for RENTAL listings here right now (not sales)? A rising rental-DOM trend means longer vacancies and softer asking-rent achievability than the comps imply.
- What's the recent tenant-quality profile in this submarket — average credit score on applications, eviction rate, late-payment / NSF rate, and stable-employment percentage? A property-management company in the area should have these aggregated.
- How much new for-sale + rental construction is in the pipeline within 1–3 miles? Heavy new supply typically softens prices + rents 12–24 months out; constrained supply supports both.
Investment metrics
- 1% rule
- 1.40% ✓
- Cap rate
- 12.41%
- Cash-on-cash
- 21.84%
- DSCR
- 1.97
- GRM
- 5.9
CMA / ARV
- ARV (on-the-fly)
- $132,312
- Comps found
- 1
Show comp detail 1 sale within ~0.75 mi
| Address | Dist | Beds/Ba | Sqft | Sold | Price | $/sf | Match |
|---|---|---|---|---|---|---|---|
| 125 Lake Dr | 0.00mi | 4/2.0 | 1,788 (0%) | 1mo | $132,000 | $74 | 99 |
Match score weights: distance 35% · size 25% · config 20% · recency 20%. Top-matched comps best support the ARV.
Projected returns pro-forma
-3.0% appreciation · 3.0% rent growth · sell at horizon
- IRR
- 11.9%
- Equity multiple
- 1.47×
- Total profit
- $18,356
- Equity at exit
- $20,725
- IRR
- 20.8%
- Equity multiple
- 2.76×
- Total profit
- $68,603
- Equity at exit
- $12,018
Cash invested: $38,920 (down + closing). Projections, not guarantees.
Landlord ↔ Tenant lean methodology
- Overall (STATE)
- 90 Strongly Landlord-Friendly
- State Alabama
- 90 Strongly Landlord-Friendly · R+15
- County
- — inherits STATE
- City
- — inherits STATE
ZIP-level market 35146
- Home prices YoY
- -15.8%
- Active inventory
- 172
- Price-to-rent
- 5.9×
Monthly cashflow live
- Estimated rent
- $1,953 medium interval (Pro) →
- Mortgage (P&I)
- −$729
- Tax from tax record
- −$47 /mo · $568/yr
- Insurance
- −$58
- Flood insurance flood zone
- −$66 /mo · $798/yr
- HOA
- −$0
- Vacancy / Maint / Mgmt
- −$410
- Net cashflow
- $642
Break-even live
UW: 25.0% down · 7.5% · 30yr · 1.5% tax · 5.0% vac · 8.0% maint · 8.0% mgmt
Financing live
Cash to close
- Down payment
- $34,750
- Closing costs
- $4,170
- Reserves months
- —
- Total cash needed
- —
Loan-product check · same deal, 3 products live
Conventional
25% down · 7.5% · 30yr
- Down + closing
- —
- Monthly P&I
- —
- Monthly cashflow
- —
- DSCR
- —
- Eligible?
- —
Personal DTI + credit; lowest rate.
DSCR
20% down · 8.5% · 30yr
- Down + closing
- —
- Monthly P&I
- —
- Monthly cashflow
- —
- DSCR
- —
- Eligible?
- —
No personal income docs; deal must DSCR.
Hard money
10% down · 12.0% · 12mo
- Down + closing
- —
- Monthly P&I
- —
- Monthly cashflow
- —
- DSCR
- —
- Eligible?
- —
Short-term bridge; refi at stabilization.
Listing history 9 events
-
2026-05-17status Pending
-
2026-04-26historical Contingent
-
2026-01-14$139,000 Active
-
2025-06-14price $159,900
-
2025-05-17price $164,900
-
2025-04-24price $169,900
-
2025-03-29price $174,900
-
2024-08-12price $190,000
-
2019-05-16soldstatus $80,000
ⓘ Source: listings_history table (triggers on properties + properties_extension) + one-shot
backfill from property_details.listing_events for pre-trigger history.
Tax reassessment forecast AL · Resets to sale price
- Current annual tax
- $568 · $47/mo
- Projected year-2 tax
- $570 · $47/mo
- Expected delta
- +$2/yr ($0/mo · 0.4%)
ⓘ Screening estimate from a state-policy table — verify with the county assessor before closing.
Climate risk First Street
- Flood 8/10 Severe FEMA zone X (unshaded) · 99% chance over 30 yrs
- Wildfire 5/10 Major
- Heat 6/10 Major 7 d/yr ≥105°F today · 20 d/yr by 30 yrs out
- Wind 5/10 Major 26% chance of damaging wind over 30 yrs
- Air quality 2/10 Low 1 unhealthy d/yr today · 3 by 30 yrs out
Nearby sold comps map
Loading sold comps map…
Walkable amenities ~0.75 mi
Loading nearby amenities…
Taxation est. · year 1
- Rental income
- $23,432
- − Mortgage interest
- −$7,786
- − Property taxes
- −$568
- − Insurance
- −$1,492
- − Repairs & maintenance
- −$1,875
- − Management
- −$1,875
- − Depreciation
- −$4,044
- Taxable income
- $5,793
- Est. tax owed @ 24.0%
- −$1,390
- After-tax cash flow
- $6,313/yr
For passive investors: Depreciation is non-cash, so a rental often shows a tax loss while cash-flowing — sheltering income. Rental losses are passive: they offset passive income freely, and up to $25,000/yr can offset ordinary (W-2) income if you actively participate and your MAGI is under $100k (phasing out to $0 by $150k); unused losses carry forward. On sale, claimed depreciation is recaptured at up to 25%, and gains may owe capital-gains tax (a 1031 exchange can defer both). Figures are a year-1 estimate at your 24.0% rate — not tax advice; consult a CPA.
Schools (NCES district)
- District
- St Clair County
- NCES district ID
- 0103062
- Math proficiency
- 21% ▼ -34.00%
- Reading proficiency
- 52% ▬ 0.00%
- Median HH income
- $53,324
- Composite
- 31.79/100
- National rank
- #5887
- State rank
- #33 of 129 in AL
Livability — Odenville
- Score
- 67/100
- State rank
- #80
- US rank
- #10630
Category grades
Schools grade is shown separately in the Schools card above.
Census & demographics
- County
- Saint Clair County · 54,404 people
- City population
- 17,730
- Metro
- Birmingham-Hoover, AL
- Population (ZIP)
- 13,973
- Household income
- $86,614
- Rent vs Own
- Severe rent burden
- 39.0
Population outlook (St. Clair County) Hauer SSP2
- Today (2025)
- 94,158 people
- By 2030
- 97,008 · +3.0%
- By 2040
- 101,615 · +7.9%
- By 2050
- 104,537 · +11.0%
- By 2075
- 109,350 · +16.1%
- By 2100
- 106,785 · +13.4%
Race, ethnicity, and origin ACS 2023
- Neighborhood character
- Predominantly White (82%)
- Race & ethnicity
- White 82% Black 11% Two or more races 4% Hispanic / Latino 2%
- Common ancestry
- Slovak 4% Italian 1% Lithuanian 1%
- Foreign-born
- 3% · Canada
- Languages at home
- 95% English-only · Spanish 4% German/W. Germanic 1%
Political lean MEDSL · St. Clair
- 2024 margin
- Solid R (+64.1) · D 17.6% · R 81.7%
- 2008→2024 swing
- -0.9pp no change · 2008: -63.2pp · 2024: -64.1pp
- All cycles
- 2024: R+64.1 2020: R+64.0 2016: R+68.6 2012: R+66.1 2008: R+63.2
Not yet ingested
- Civics
- —
Market trends
- HPI YoY
- ▼ -42.81%
- Current HPI
- 228.507
- Rent YoY
- —
- Metro
- Birmingham-Hoover, AL
- State GDP YoY
- ▲ 2.94%
- F500 in state
- 4
Industry mix (Fortune 500 HQ in AL)
| Industry | F500 HQs | Revenue |
|---|---|---|
| Financial Services | 1 | $8B |
|
||
| Healthcare | 1 | $5B |
|
||
Price history
+73.8% since first listed9 events — show timeline
- 2026-05-17 Pending — Greater Alabama MLS
- 2026-04-26 Contingent — Greater Alabama MLS
- 2026-01-14 Listed $139,000 Greater Alabama MLS
- 2025-06-14 Price Changed $159,900 Greater Alabama MLS
- 2025-05-17 Price Changed $164,900 Greater Alabama MLS
- 2025-04-24 Price Changed $169,900 Greater Alabama MLS
- 2025-03-29 Price Changed $174,900 Greater Alabama MLS
- 2024-08-12 Price Changed $190,000 Greater Alabama MLS
- 2019-05-16 Sold (Public Records) $80,000 Public Records
Property tax history
+5.0%/yrLatest (2025): $568 · +3.4% YoY. Source: county tax records.
Cash-flow waterfall
monthlySold comps — $/sqft
last 12 mo · ≤1 miLoading sold comps…