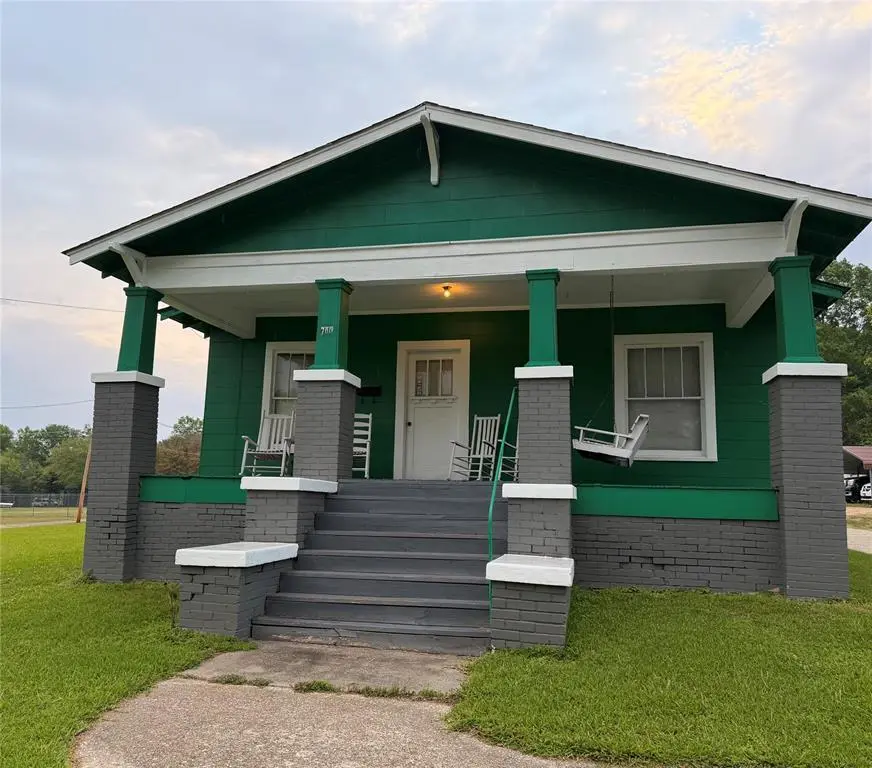
9890 Highway 79 · Haynesville, LA
Flood risk 1/10 · Minimal
- FEMA flood zone
- X
- Chance of flooding over 30 yrs
- 0.0%
- Est. flood insurance / yr
- $507 – $1,088
Fire risk 3/10 · Minor
- Est. fire insurance / yr
- $1,269 – $2,357
Heat risk 7/10 · Major
- Hot days now (above 111°F)
- 7 days/yr
- Hot days in 30 yrs
- 22 days/yr
Wind risk 6/10 · Moderate
- Chance of severe wind over 30 yrs
- 58.0%
Air-quality risk 1/10 · Minimal
- Unhealthy air days now
- 0 days/yr
- Unhealthy air days in 30 yrs
- 0 days/yr
Risk factors via First Street. Map © Google.
Why this score? — see what drove the C grade
The composite is a weighted blend of 9 inputs, each scored 0–100. Each bar is that input's sub-score; the figure is the points it added to the 100-point composite (weight × sub-score).
- Cash flow +25.7/30.0
- DSCR +8.6/10.0
- 1% rule +5.6/10.0
- Appreciation +5.0/10.0
- ARV discount +3.9/15.0
- Livability +3.0/5.0
- Rent growth +2.5/5.0
- Condition / age +2.5/5.0
- Schools +1.3/10.0
$105,000
🖨 Deal sheet 📄 Offer letter ✓ Due diligence
Listing remarks MLS
A great opportunity for residential living or business use--the choice is yours! This charming 3 bedroom and 2 bathroom property is full of character and offers spacious rooms throughout. The upstairs room is generously sized with enough space to accommodate two beds, making it perfect for additional sleeping quarter, a guest room, or flexible use. Schedule a private showing today with a Realtor! The Buyer or Buyers Agent should verify the measurement of the property.
Key facts
- 0.28 acre lot
- Built 1950
- Listed 56 days
Neighborhood map
What this means for you Summary
Snapshot
- This is a 3-bed/2.0-bath single-family listed at $105k.
Deal economics
- At list price, monthly cash flow is $253 ($3k/yr) — positive.
- The deal already cash-flows at list — no discount required.
- Meets the 1% rule at list price ($1k rent vs $105k).
- Recommended offer: $102k (3.0% below list) — sets the bar for market timing.
Location & tenants
- Location reads 60/100 on livability (#255 in LA) — a middle-class / working-renter tenant base. Strengths: cost of living A+, housing A; Watch: schools C-, health & safety D, amenities F.
- Claiborne Parish (rural): math 13% / reading 19% proficiency, ranked #77 of 98 in LA (top 79%) — low school quality limits family demand, transient renter base, plan for 1-2y turnover; 75% free/reduced lunch — lower-income household profile, screen leases tightly.
- Market conditions: 13 active listings in the ZIP; 3 units permitted in Claiborne Parish in 2024 (0 in 5+ unit buildings).
Forward outlook
- In year one you build about $4k of equity ($726 loan paydown + $3k appreciation (3.0% local appreciation)).
- Claiborne County population projected at -23% by 2050 — secular population decline; favor cash flow + early exit over multi-decade hold.
- At projected returns (3.0% appreciation + 3.0% rent growth), your $29k cash investment doubles in ~4 years — after that, you're playing with house money.
- By year 9, paydown + projected appreciation supports a ~$33k cash-out refi (75% LTV) — recoverable capital for the next deal without selling this one.
Negotiation context
- It's been on market 57 days — a 3% lower offer ($102k) is reasonable based on typical stale-listing flexibility.
Risks & watch-outs
- Watch-outs: built in 1950 — expect roof / HVAC / electrical / plumbing capex.
- Climate carrying-cost: major wind risk, 58% chance of damaging wind over 30y; extreme-heat days projected 7→22/yr by 2055 (HVAC capex compounding) — expect insurance premiums to compound above CPI over the hold.
Questions for the listing agent
- It's been on market 57 days. Have you received any prior offers? Is the seller open to a 3% concession, seller financing, or rate buy-down credit?
- Built in 1950 — when were the roof, HVAC, electrical panel, plumbing, and water heater last replaced?
- Is there a deadline driving the sale (1031 exchange, divorce, estate, relocation)? That informs how much negotiation room exists.
- What's the average days-on-market for RENTAL listings here right now (not sales)? A rising rental-DOM trend means longer vacancies and softer asking-rent achievability than the comps imply.
- What's the recent tenant-quality profile in this submarket — average credit score on applications, eviction rate, late-payment / NSF rate, and stable-employment percentage? A property-management company in the area should have these aggregated.
- How much new for-sale + rental construction is in the pipeline within 1–3 miles? Heavy new supply typically softens prices + rents 12–24 months out; constrained supply supports both.
Investment metrics
- 1% rule
- 1.06% ✓
- Cap rate
- 9.19%
- Cash-on-cash
- 10.33%
- DSCR
- 1.46
- GRM
- 7.8
CMA / ARV
- ARV (median comp)
- $97,299
- List price
- $105,000
- Delta
- 7.92%
- Verdict
- FAIR
- Comps
- 13 within 1.0 mi
Show comp detail 8 sales within ~0.75 mi
| Address | Dist | Beds/Ba | Sqft | Sold | Price | $/sf | Match |
|---|---|---|---|---|---|---|---|
| 2093 Bridgeman Ave | 0.29mi | 3/2.0 | 1,601 (-3%) | 13mo | $49,900 | $31 | 70 |
| 2748 Country Club Dr | 0.48mi | 3/2.5 | 1,620 (-2%) | 10mo | $105,000 | $65 | 64 |
| 4189 Highway 2 Alt | 0.54mi | 3/1.5 | 1,625 (-2%) | 11mo | $120,000 | $74 | 60 |
| 1284 Mcdonald St | 0.35mi | 2/2.0 (-1) | 1,512 (-9%) | 6mo | $179,000 | $118 | 59 |
| 2711 Jackson Dr | 0.45mi | 4/2.0 (+1) | 1,624 (-2%) | 22mo | $105,900 | $65 | 53 |
| 2150 Spring Dr | 0.61mi | 3/2.0 | 1,626 (-2%) | 22mo | $70,000 | $43 | 50 |
| 1205 Garrett Cir | 0.48mi | 2/2.0 (-1) | 1,500 (-9%) | 12mo | $90,000 | $60 | 47 |
| 1239 Carson St | 0.65mi | 3/2.0 | 1,450 (-12%) | 14mo | $31,200 | $22 | 37 |
Match score weights: distance 35% · size 25% · config 20% · recency 20%. Top-matched comps best support the ARV.
Projected returns pro-forma
3.0% appreciation · 3.0% rent growth · sell at horizon
- IRR
- 17.1%
- Equity multiple
- 1.98×
- Total profit
- $28,729
- Equity at exit
- $47,213
- IRR
- 18.6%
- Equity multiple
- 3.71×
- Total profit
- $79,634
- Equity at exit
- $72,760
Cash invested: $29,400 (down + closing). Projections, not guarantees.
Landlord ↔ Tenant lean methodology
- Overall (STATE)
- 90 Strongly Landlord-Friendly
- State Louisiana
- 90 Strongly Landlord-Friendly · R+12
- County
- — inherits STATE
- City
- — inherits STATE
ZIP-level market 71038
- Active inventory
- 13
- Price-to-rent
- 7.8×
Monthly cashflow live
- Estimated rent
- $1,116 medium interval (Pro) →
- Mortgage (P&I)
- −$551
- Tax from tax record
- −$34 /mo · $410/yr
- Insurance
- −$44
- HOA
- −$0
- Vacancy / Maint / Mgmt
- −$234
- Net cashflow
- $253
Break-even live
UW: 25.0% down · 7.5% · 30yr · 1.5% tax · 5.0% vac · 8.0% maint · 8.0% mgmt
Financing live
Cash to close
- Down payment
- $26,250
- Closing costs
- $3,150
- Reserves months
- —
- Total cash needed
- —
Loan-product check · same deal, 3 products live
Conventional
25% down · 7.5% · 30yr
- Down + closing
- —
- Monthly P&I
- —
- Monthly cashflow
- —
- DSCR
- —
- Eligible?
- —
Personal DTI + credit; lowest rate.
DSCR
20% down · 8.5% · 30yr
- Down + closing
- —
- Monthly P&I
- —
- Monthly cashflow
- —
- DSCR
- —
- Eligible?
- —
No personal income docs; deal must DSCR.
Hard money
10% down · 12.0% · 12mo
- Down + closing
- —
- Monthly P&I
- —
- Monthly cashflow
- —
- DSCR
- —
- Eligible?
- —
Short-term bridge; refi at stabilization.
Listing history 16 events
-
2026-06-18days on market $105,000 Active 57 DOM
-
2026-06-17days on market $105,000 Active 56 DOM
-
2026-06-16days on market $105,000 Active 55 DOM
-
2026-06-15days on market $105,000 Active 54 DOM
-
2026-06-13days on market $105,000 Active 52 DOM
-
2026-06-12days on market $105,000 Active 51 DOM
-
2026-06-09days on market $105,000 Active 48 DOM
-
2026-06-08days on market $105,000 Active 47 DOM
-
2026-06-07days on market $105,000 Active 46 DOM
-
2026-06-07days on market $105,000 Active 45 DOM
-
2026-06-04days on market $105,000 Active 42 DOM
-
2026-06-02days on market $105,000 Active 41 DOM
-
2026-06-01days on market $105,000 Active 40 DOM
-
2026-05-31days on market $105,000 Active 39 DOM
-
2026-05-31days on market $105,000 Active 38 DOM
-
2026-04-21$105,000 Active 483-char remark
Show marketing remark (483 chars)
A great opportunity for residential living or business use--the choice is yours! This charming 3 bedroom and 2 bathroom property is full of character and offers spacious rooms throughout. The upstairs room is generously sized with enough space to accommodate two beds, making it perfect for additional sleeping quarter, a guest room, or flexible use. Schedule a private showing today with a Realtor! The Buyer or Buyers Agent should verify the measurement of the property.
ⓘ Source: listings_history table (triggers on properties + properties_extension) + one-shot
backfill from property_details.listing_events for pre-trigger history.
Tax reassessment forecast LA · Resets to sale price
- Current annual tax
- $410 · $34/mo
- Projected year-2 tax
- $578 · $48/mo
- Expected delta
- +$168/yr (+$14/mo · 40.9%)
ⓘ Screening estimate from a state-policy table — verify with the county assessor before closing.
Climate risk First Street
- Flood 1/10 Low FEMA zone X · 0% chance over 30 yrs
- Wildfire 3/10 Moderate
- Heat 7/10 Severe 7 d/yr ≥111°F today · 22 d/yr by 30 yrs out
- Wind 6/10 Major 58% chance of damaging wind over 30 yrs
- Air quality 1/10 Low 0 unhealthy d/yr today · 0 by 30 yrs out
Nearby sold comps map
Loading sold comps map…
Walkable amenities ~0.75 mi
Loading nearby amenities…
Taxation est. · year 1
- Rental income
- $13,393
- − Mortgage interest
- −$5,882
- − Property taxes
- −$410
- − Insurance
- −$525
- − Repairs & maintenance
- −$1,071
- − Management
- −$1,071
- − Depreciation
- −$3,055
- Taxable income
- $1,379
- Est. tax owed @ 24.0%
- −$331
- After-tax cash flow
- $2,707/yr
For passive investors: Depreciation is non-cash, so a rental often shows a tax loss while cash-flowing — sheltering income. Rental losses are passive: they offset passive income freely, and up to $25,000/yr can offset ordinary (W-2) income if you actively participate and your MAGI is under $100k (phasing out to $0 by $150k); unused losses carry forward. On sale, claimed depreciation is recaptured at up to 25%, and gains may owe capital-gains tax (a 1031 exchange can defer both). Figures are a year-1 estimate at your 24.0% rate — not tax advice; consult a CPA.
Schools (NCES district)
- District
- Claiborne Parish
- NCES district ID
- 2200450
- Math proficiency
- 13% ▼ -28.00%
- Reading proficiency
- 19% ▼ -33.00%
- Median HH income
- $30,278
- Composite
- 12.69/100
- National rank
- #9605
- State rank
- #77 of 98 in LA
Livability — Haynesville
- Score
- 60/100
- State rank
- #255
- US rank
- #19053
Category grades
Schools grade is shown separately in the Schools card above.
Census & demographics
- Census place
- Haynesville, LA
- Population (ZIP)
- 3,797
Population outlook (Claiborne County) Hauer SSP2
- Today (2025)
- 14,937 people
- By 2030
- 14,189 · -5.0%
- By 2040
- 12,747 · -14.7%
- By 2050
- 11,524 · -22.8%
- By 2075
- 9,198 · -38.4%
- By 2100
- 7,310 · -51.1%
Race, ethnicity, and origin ACS 2023
- Neighborhood character
- Majority Black (57%)
- Race & ethnicity
- Black 57% White 38% Two or more races 4% Hispanic / Latino 3%
- Common ancestry
- Serbian 1% Lithuanian 1% Italian 0%
- Foreign-born
- 0%
Political lean MEDSL · Claiborne
- 2024 margin
- Strong R (+22.1) · D 38.5% · R 60.6%
- 2008→2024 swing
- -11.5pp toward R · 2008: -10.6pp · 2024: -22.1pp
- All cycles
- 2024: R+22.1 2020: R+15.8 2016: R+13.5 2012: R+9.4 2008: R+10.6
Not yet ingested
- Civics
- —
Market trends
- HPI YoY
- —
- Current HPI
- —
- Rent YoY
- —
- Metro
- —
- State GDP YoY
- ▲ 3.29%
- F500 in state
- 10
Industry mix (Fortune 500 HQ in LA)
| Industry | F500 HQs | Revenue |
|---|---|---|
| Telecommunications | 2 | $23B |
|
||
| Utilities | 1 | $12B |
|
||
| Wholesale / Distribution | 1 | $5B |
|
||
| Advertising | 1 | $2B |
|
||
Price history
1 event — show timeline
- 2026-04-21 Listed $105,000 NTREIS
Property tax history
+2.5%/yrLatest (2025): $410 · +0.4% YoY. Source: county tax records.
Cash-flow waterfall
monthlySold comps — $/sqft
last 12 mo · ≤1 miLoading sold comps…