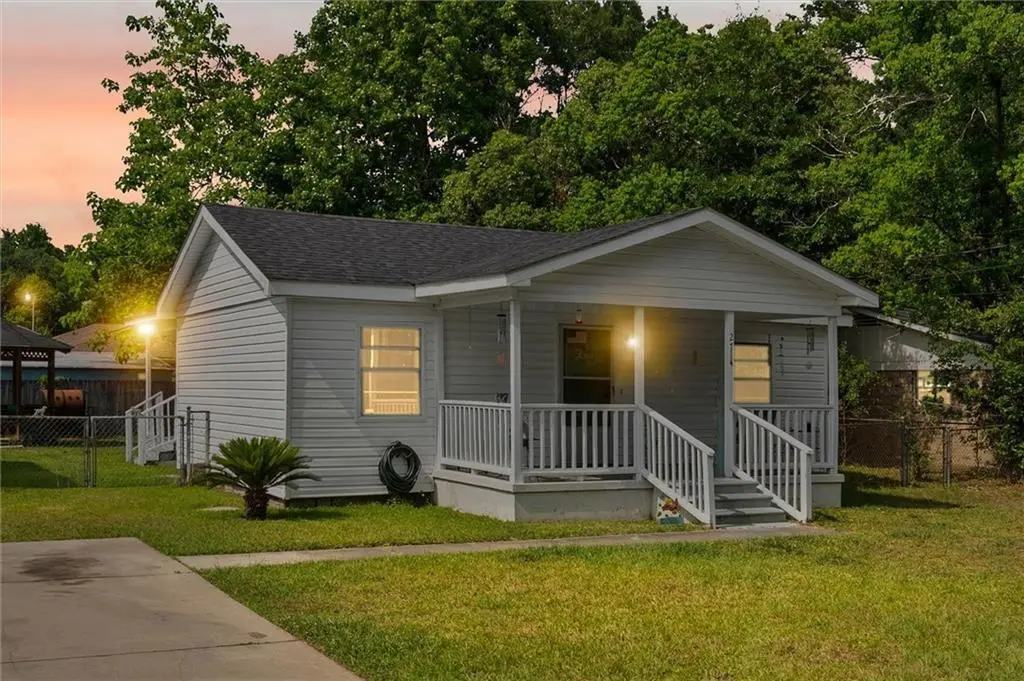
2714 Moot Ave · Mobile, AL
Flood risk 1/10 · Minimal
- FEMA flood zone
- X (unshaded)
- Chance of flooding over 30 yrs
- 0.0%
- Est. flood insurance / yr
- $507 – $1,088
Fire risk 1/10 · Minimal
- Est. fire insurance / yr
- $916 – $1,700
Heat risk 9/10 · Severe
- Hot days now (above 105°F)
- 7 days/yr
- Hot days in 30 yrs
- 20 days/yr
Wind risk 9/10 · Severe
- Chance of severe wind over 30 yrs
- 99.0%
Air-quality risk 2/10 · Minimal
- Unhealthy air days now
- 1 days/yr
- Unhealthy air days in 30 yrs
- 1 days/yr
Risk factors via First Street. Map © Google.
Why this score? — see what drove the C grade
The composite is a weighted blend of 9 inputs, each scored 0–100. Each bar is that input's sub-score; the figure is the points it added to the 100-point composite (weight × sub-score).
- Cash flow +25.1/30.0
- DSCR +8.2/10.0
- ARV discount +7.5/15.0
- 1% rule +5.4/10.0
- Rent growth +3.8/5.0
- Livability +3.8/5.0
- Condition / age +2.5/5.0
- Schools +2.3/10.0
- Appreciation +0.0/10.0
$100,000
🖨 Deal sheet 📄 Offer letter ✓ Due diligence
Listing remarks
Welcome to 2714 Moot Avenue! This cozy 2-bedroom, 1-bathroom bungalow offers 834 sq ft of comfortable living space, perfect for first-time homebuyers or investors. Step inside to find laminate flooring throughout, a welcoming living room, a functional kitchen with a breakfast bar ideal for casual dining, and a convenient laundry room. Enjoy indoor-outdoor living with a front porch and a covered back porch, perfect for relaxing or entertaining. The backyard features a charming gazebo and partial privacy fencing to create your own private retreat. A one-car garage provides excellent storage or workshop space. Location, Location, Location! Situated near the Beltline with easy access to publ
Key facts
- Laminate flooring
- Laundry room
- Front porch
Tags
Property features AI
Exterior
- Parking: Detached garage; Driveway; Garage with door opener; Garage faces front; Level driveway; Total parking for 4 vehicles; 1 garage space
- Utilities: Cable available; Phone available; Water available; Public sewer; 110 volt electric
- Home design: Single family residence; Residential property; Shingle roof; Brick front and vinyl siding; Built in 1951; View available
- Construction: Brick front and vinyl siding construction; Shingle roof; Built in 1951; Crawl space foundation
- Exterior features: Private yard; Back yard and front yard fencing; Chain link and wood fencing; Shed(s); Gazebo; Garage(s)
Interior
- Kitchen: Breakfast bar; Laminate countertops; Open view to family room
- Bedrooms: 2 bedrooms
- Flooring: Laminate; Other
- Bathrooms: 1 full bathroom
- Heating & cooling: Central heating; Central air conditioning
- Interior features: High speed internet; Gas water heater; Open floorplan; Breakfast bar; Laminate counters; View to family room; Crawl space basement
- Laundry & utility: Gas water heater
Neighborhood map
What this means for you Summary
Snapshot
- This is a 2-bed/1.0-bath single-family listed at $100k.
Deal economics
- At list price, monthly cash flow is $221 ($3k/yr) — positive.
- The deal already cash-flows at list — no discount required.
- Meets the 1% rule at list price ($1k rent vs $100k).
- Recommended offer: $98k (1.5% below list) — sets the bar for market timing.
- Cap rate 8.9% vs local median 4.9% in Mobile — top-decile yield for the area; either an underpriced asset or a hidden risk that comps aren't pricing in. Stress-test before assuming the spread holds.
Location & tenants
- Location reads 75/100 on livability (#20 in AL, #4,262 nationally) — a middle-class / working-renter tenant base. Strengths: commute A+, cost of living A+, housing A+; Watch: crime F, employment D-.
- Mobile County (urban): math 15% / reading 39% proficiency, ranked #81 of 129 in AL (top 63%) — low school quality limits family demand, transient renter base, plan for 1-2y turnover; 67% free/reduced lunch — lower-income household profile, screen leases tightly.
- Zoned schools: Maryvale Elementary School (math 5% / reading 25%, grade F, #505 of 627 statewide, top 81%, 494 students, 92% FRL); Lillie B Williamson High School (math 2% / reading 12%, grade F, #273 of 305 statewide, top 89%, 956 students, 94% FRL) — zoned schools average 93% FRL vs 67% district-wide (26 pts higher); higher-poverty schools than district average — tighter screening recommended.
- Zoned-school proficiency averages 11% at this address vs 27% district-wide (-16 pts) — the specific schools serving this property underperform the Mobile County average; the district grade overstates school quality for this exact location.
- Market conditions: Rents rising fast (+5.1%/yr); 174 active listings in the ZIP; 25 comparable units currently listed for rent nearby; rentals lingering (median 44d on market — plan ~5-8 weeks vacancy on turnover, expect pricing pressure); 72% of comp listings sitting > 30 days — soft ceiling on asking rent; 1,678 units permitted in Mobile County in 2024 (264 in 5+ unit buildings).
Forward outlook
- Local home prices are declining (-3.0%/yr); year-one equity from $691 of loan paydown is wiped out by about $3k of value loss. Plan a longer hold.
- Mobile County population projected to shrink 8% by 2050 — rents likely to lag national; underwrite the cash flow, not the appreciation.
- At projected returns (-3.0% appreciation + 5.1% rent growth), your $28k cash investment doubles in ~10 years — after that, you're playing with house money.
Negotiation context
- It's been on market 18 days — a 2% lower offer ($98k) is reasonable based on typical stale-listing flexibility.
Risks & watch-outs
- Watch-outs: built in 1951 — expect roof / HVAC / electrical / plumbing capex.
- Climate carrying-cost: severe wind risk, 99% chance of damaging wind over 30y; extreme-heat days projected 7→20/yr by 2055 (HVAC capex compounding) — expect insurance premiums to compound above CPI over the hold.
Questions for the listing agent
- Built in 1951 — when were the roof, HVAC, electrical panel, plumbing, and water heater last replaced?
- Is there a deadline driving the sale (1031 exchange, divorce, estate, relocation)? That informs how much negotiation room exists.
- Schools are D-rated, which usually means shorter tenancies and higher turnover. Who's the typical renter profile here, and what's been the actual vacancy rate?
- Crime grade is F in this area — have there been break-ins, vandalism, or insurance claims at this property in the last 3 years? What carrier currently insures it and at what premium?
- What's the average days-on-market for RENTAL listings here right now (not sales)? A rising rental-DOM trend means longer vacancies and softer asking-rent achievability than the comps imply.
- What's the recent tenant-quality profile in this submarket — average credit score on applications, eviction rate, late-payment / NSF rate, and stable-employment percentage? A property-management company in the area should have these aggregated.
- How much new for-sale + rental construction is in the pipeline within 1–3 miles? Heavy new supply typically softens prices + rents 12–24 months out; constrained supply supports both.
Investment metrics
- 1% rule
- 1.04% ✓
- Cap rate
- 8.94%
- Cash-on-cash
- 9.47%
- DSCR
- 1.42
- GRM
- 8.0
CMA / ARV
- ARV (median comp)
- $57,169
- List price
- $100,000
- Delta
- 74.92%
- Verdict
- OVERPRICED
- Comps
- 20 within 1.0 mi
Show comp detail 4 sales within ~0.75 mi
| Address | Dist | Beds/Ba | Sqft | Sold | Price | $/sf | Match |
|---|---|---|---|---|---|---|---|
| 2600 Burgess St | 0.24mi | 2/1.0 | 770 (-8%) | 21mo | $53,000 | $69 | 59 |
| 966 Mcrae Ave | 0.23mi | 2/1.0 | 728 (-13%) | 22mo | $53,000 | $73 | 49 |
| 919 Rowell St | 0.59mi | 2/1.0 | 932 (+12%) | 16mo | $50,000 | $54 | 39 |
| 2561 Pleasant Valley Rd | 0.46mi | 3/1.0 (+1) | 925 (+11%) | 20mo | $90,000 | $97 | 38 |
Match score weights: distance 35% · size 25% · config 20% · recency 20%. Top-matched comps best support the ARV.
Projected returns pro-forma
-3.0% appreciation · 5.06% rent growth · sell at horizon
- IRR
- 0.0%
- Equity multiple
- 1.00×
- Total profit
- $37
- Equity at exit
- $14,910
- IRR
- 11.5%
- Equity multiple
- 1.98×
- Total profit
- $27,456
- Equity at exit
- $8,646
Cash invested: $28,000 (down + closing). Projections, not guarantees.
Landlord ↔ Tenant lean methodology
- Overall (STATE)
- 90 Strongly Landlord-Friendly
- State Alabama
- 90 Strongly Landlord-Friendly · R+15
- County
- — inherits STATE
- City
- — inherits STATE
ZIP-level market 36606
- Rents YoY
- 5.1%
- Active inventory
- 174
- Price-to-rent
- 8.0×
Monthly cashflow live
- Estimated rent
- $1,045 high interval (Pro) →
- Mortgage (P&I)
- −$524
- Tax from tax record
- −$39 /mo · $462/yr
- Insurance
- −$42
- HOA
- −$0
- Vacancy / Maint / Mgmt
- −$219
- Net cashflow
- $221
Break-even live
UW: 25.0% down · 7.5% · 30yr · 1.5% tax · 5.0% vac · 8.0% maint · 8.0% mgmt
Financing live
Cash to close
- Down payment
- $25,000
- Closing costs
- $3,000
- Reserves months
- —
- Total cash needed
- —
Loan-product check · same deal, 3 products live
Conventional
25% down · 7.5% · 30yr
- Down + closing
- —
- Monthly P&I
- —
- Monthly cashflow
- —
- DSCR
- —
- Eligible?
- —
Personal DTI + credit; lowest rate.
DSCR
20% down · 8.5% · 30yr
- Down + closing
- —
- Monthly P&I
- —
- Monthly cashflow
- —
- DSCR
- —
- Eligible?
- —
No personal income docs; deal must DSCR.
Hard money
10% down · 12.0% · 12mo
- Down + closing
- —
- Monthly P&I
- —
- Monthly cashflow
- —
- DSCR
- —
- Eligible?
- —
Short-term bridge; refi at stabilization.
Rent comps 25 comps
| Address | Beds | Baths | Sqft | Rent | $/sqft | DOM | Units | Dist |
|---|---|---|---|---|---|---|---|---|
| 2425 Nortons Ln Unit C Mobile, AL | 2.0 | 1.0 | 1050 | $1,200 | $1.14 | 43d | 1 | 0.41mi |
| 2425 Nortons Ln Unit D Mobile, AL | 2.0 | 1.0 | 1050 | $1,100 | $1.05 | 13d | 1 | 0.41mi |
| 957 Navco Rd Mobile, AL | 2.0 | 1.5 | 812 | $850 | $1.05 | 21d | 1 | 0.43mi |
| 2901 Pleasant Valley Rd Mobile, AL | 1.0 | 1.0 | 578 | $775 | $1.34 | 43d | 1 | 0.46mi |
| 2904 Pleasant Valley Rd Mobile, AL | 2.0 | 1.0 | 815 | $899 | $1.10 | 43d | 1 | 0.55mi |
| 900 Courtney St Mobile, AL | 2.0 | 1.0 | 1020 | $1,200 | $1.18 | 43d | 1 | 0.59mi |
| 1302 Navco Rd Mobile, AL | 2.0 | 1.0 | 1009 | $935 | $0.93 | 13d | 13 | 0.67mi |
| 751 Farnell Ln Mobile, AL | 2.0 | 1.0 | 1100 | $1,400 | $1.27 | 43d | 1 | 0.70mi |
| 3171 Pleasant Valley Rd Mobile, AL | 2.0 | 1.0 | 875 | $800 | $0.91 | 43d | 1 | 0.80mi |
| 767 Jemison St Mobile, AL | 2.0 | 1.0 | 850 | $750 | $0.88 | 43d | 1 | 0.89mi |
| 1411 Greenbrier Dr Mobile, AL | 3.0 | 1.0 | 1069 | $995 | $0.93 | 43d | 1 | 0.90mi |
| 916 Delmar Dr Mobile, AL | 3.0 | 1.0 | 1100 | $1,400 | $1.27 | 13d | 1 | 0.91mi |
| 1506 Flowers Dr Unit B Mobile, AL | 2.0 | 1.0 | 1000 | $795 | $0.80 | 21d | 1 | 0.92mi |
| 3210 Pleasant Valley Rd Mobile, AL | 2.0 | 1.0 | 850 | $825 | $0.97 | 43d | 1 | 0.93mi |
| 461 Magnolia Rd Unit A Mobile, AL | 2.0 | 1.0 | 989 | $825 | $0.83 | 43d | 1 | 0.97mi |
| 1466 Darwood Dr Mobile, AL | 3.0 | 1.5 | 1053 | $1,400 | $1.33 | 43d | 1 | 1.06mi |
| 2366 White St Unit B Mobile, AL | 2.0 | 1.0 | 900 | $845 | $0.94 | 43d | 1 | 1.07mi |
| 728 Bankhead Pl Mobile, AL | 2.0 | 1.0 | 810 | $675 | $0.83 | 43d | 1 | 1.08mi |
| 442 Cottage Hill Rd Unit 13 Mobile, AL | 1.0 | 1.0 | 637 | $860 | $1.35 | 43d | 1 | 1.10mi |
| 505 Bel Air Blvd Mobile, AL | 1.0–2.0 | 1.0–2.0 | 976 | $1,274 | $1.30 | 13d | 16 | 1.17mi |
| 2008 W Victory Dr Mobile, AL | 3.0 | 1.0 | 1011 | $1,200 | $1.19 | 43d | 1 | 1.17mi |
| 1351 Dauphin Island Pkwy Mobile, AL | 3.0 | 1.0 | 992 | $1,095 | $1.10 | 43d | 1 | 1.30mi |
| 2359 Vermillion Dr Mobile, AL | 3.0 | 1.0 | 1064 | $895 | $0.84 | 21d | 1 | 1.38mi |
| 562 Clarke St Mobile, AL | 2.0 | 1.0 | 1061 | $1,025 | $0.97 | 43d | 1 | 1.39mi |
| 400 Westwood St Mobile, AL | 1.0–2.0 | 1.0 | 750 | $1,005 | $1.34 | 43d | 1 | 1.46mi |
Listing history 1 events
-
2026-05-01$100,000 Active 1026-char remark
ⓘ Source: listings_history table (triggers on properties + properties_extension) + one-shot
backfill from property_details.listing_events for pre-trigger history.
Tax reassessment forecast AL · Resets to sale price
- Current annual tax
- $462 · $39/mo
- Projected year-2 tax
- $462 · $39/mo
- Expected delta
- $0/yr ($0/mo · 0.0%)
ⓘ Screening estimate from a state-policy table — verify with the county assessor before closing.
Climate risk First Street
- Flood 1/10 Low FEMA zone X (unshaded) · 0% chance over 30 yrs
- Wildfire 1/10 Low
- Heat 9/10 Extreme 7 d/yr ≥105°F today · 20 d/yr by 30 yrs out
- Wind 9/10 Extreme 99% chance of damaging wind over 30 yrs
- Air quality 2/10 Low 1 unhealthy d/yr today · 1 by 30 yrs out
Nearby sold comps map
Loading sold comps map…
Walkable amenities ~0.75 mi
Loading nearby amenities…
Taxation est. · year 1
- Rental income
- $12,539
- − Mortgage interest
- −$5,602
- − Property taxes
- −$462
- − Insurance
- −$500
- − Repairs & maintenance
- −$1,003
- − Management
- −$1,003
- − Depreciation
- −$2,909
- Taxable income
- $1,060
- Est. tax owed @ 24.0%
- −$254
- After-tax cash flow
- $2,396/yr
For passive investors: Depreciation is non-cash, so a rental often shows a tax loss while cash-flowing — sheltering income. Rental losses are passive: they offset passive income freely, and up to $25,000/yr can offset ordinary (W-2) income if you actively participate and your MAGI is under $100k (phasing out to $0 by $150k); unused losses carry forward. On sale, claimed depreciation is recaptured at up to 25%, and gains may owe capital-gains tax (a 1031 exchange can defer both). Figures are a year-1 estimate at your 24.0% rate — not tax advice; consult a CPA.
Schools (NCES district)
- District
- Mobile County
- NCES district ID
- 0102370
- Math proficiency
- 15% ▼ -28.00%
- Reading proficiency
- 39% ▬ 0.00%
- Median HH income
- $42,455
- Composite
- 22.9/100
- National rank
- #8002
- State rank
- #81 of 129 in AL
Livability — Mobile
- Score
- 75/100
- State rank
- #20
- US rank
- #4262
Category grades
Schools grade is shown separately in the Schools card above.
Census & demographics
- Census place
- Mobile, AL
- County
- Mobile County · 246,577 people
- City population
- 205,729
- Metro
- Mobile, AL
- Population (ZIP)
- 18,728
- Household income
- $51,303
- Rent vs Own
- Severe rent burden
- 999.0
Population outlook (Mobile County) Hauer SSP2
- Today (2025)
- 415,303 people
- By 2030
- 411,755 · -0.9%
- By 2040
- 399,670 · -3.8%
- By 2050
- 382,616 · -7.9%
- By 2075
- 337,353 · -18.8%
- By 2100
- 283,391 · -31.8%
Race, ethnicity, and origin ACS 2023
- Neighborhood character
- Majority Black (56%)
- Race & ethnicity
- Black 56% White 37% Two or more races 5% Hispanic / Latino 4%
- Common ancestry
- Italian 2% Scottish 2% Lithuanian 1%
- Foreign-born
- 3% · Canada
- Languages at home
- 96% English-only · Spanish 3%
Political lean MEDSL · Mobile
- 2024 margin
- R (+16.4) · D 41.3% · R 57.7%
- 2008→2024 swing
- -7.7pp toward R · 2008: -8.7pp · 2024: -16.4pp
- All cycles
- 2024: R+16.4 2020: R+11.9 2016: R+13.9 2012: R+9.3 2008: R+8.7
Not yet ingested
- Civics
- —
Market trends
- HPI YoY
- ▼ -232.19%
- Current HPI
- 145.9025
- Rent YoY
- ▲ 5.06%
- Metro
- Mobile, AL
- State GDP YoY
- ▲ 2.94%
- F500 in state
- 4
Industry mix (Fortune 500 HQ in AL)
| Industry | F500 HQs | Revenue |
|---|---|---|
| Financial Services | 1 | $8B |
|
||
| Healthcare | 1 | $5B |
|
||
Price history
2 events — show timeline
- 2026-05-19 Pending — GCMLS AL
- 2026-05-01 Listed $100,000 GCMLS AL
Cash-flow waterfall
monthlySold comps — $/sqft
last 12 mo · ≤1 miLoading sold comps…