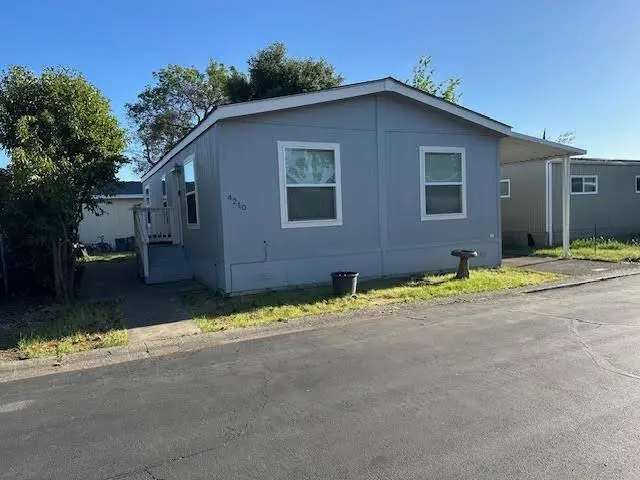
4210 Bunker Hill Ln · North Highlands, CA
Flood risk 1/10 · Minimal
- FEMA flood zone
- X (unshaded)
- Chance of flooding over 30 yrs
- 0.0%
- Est. flood insurance / yr
- $507 – $1,088
Fire risk 1/10 · Minimal
- Est. fire insurance / yr
- $659 – $1,223
Heat risk 7/10 · Major
- Hot days now (above 102°F)
- 7 days/yr
- Hot days in 30 yrs
- 15 days/yr
Wind risk 1/10 · Minimal
- Chance of severe wind over 30 yrs
- —
Air-quality risk 10/10 · Severe
- Unhealthy air days now
- 34 days/yr
- Unhealthy air days in 30 yrs
- 38 days/yr
Risk factors via First Street. Map © Google.
Why this score? — see what drove the B grade
The composite is a weighted blend of 9 inputs, each scored 0–100. Each bar is that input's sub-score; the figure is the points it added to the 100-point composite (weight × sub-score).
- Cash flow +30.0/30.0
- 1% rule +10.0/10.0
- DSCR +10.0/10.0
- ARV discount +7.5/15.0
- Condition / age +4.0/5.0
- Rent growth +3.9/5.0
- Schools +3.1/10.0
- Livability +3.1/5.0
- Appreciation +0.0/10.0
$129,000
🖨 Deal sheet 📄 Offer letter ✓ Due diligence
Listing remarks
Modern & Move-In Ready - 3 Bed, 2 Bath in Fairway Estates (All-Age Park) Welcome to this beautifully updated 2021 manufactured home located in the desirable all-age community of Fairway Estates! This spacious 3-bedroom, 2-bathroom home features brand new flooring and fresh interior paint, giving it a clean, modern feel throughout. Enjoy a bright and open floor plan, perfect for both relaxing and entertaining. The kitchen offers ample cabinet space and flows seamlessly into the living and dining areas. The primary suite includes a private bathroom and generous closet space, while two additional bedrooms provide flexibility for guests, a home office, or growing family needs. Fairway
Key facts
- Brand new flooring
- Ample cabinet space
- Private bathroom
Tags
Neighborhood map
What this means for you Summary
Snapshot
- This is a 3-bed/2.0-bath manufactured listed at $129k. Condition is rated good.
Deal economics
- At list price, monthly cash flow is $721 ($9k/yr) — positive.
- The deal already cash-flows at list — no discount required.
- Meets the 1% rule at list price ($2k rent vs $129k).
- Recommended offer: $114k (12.0% below list) — sets the bar for market timing.
- Cap rate 13.0% vs local median 4.1% in North Highlands — top-decile yield for the area; either an underpriced asset or a hidden risk that comps aren't pricing in. Stress-test before assuming the spread holds.
Location & tenants
- Location reads 61/100 on livability (#523 in CA) — a middle-class / working-renter tenant base. Strengths: housing A+; Watch: employment C-, schools D, crime F.
- Twin Rivers Unified (suburban): math 29% / reading 37% proficiency, ranked #970 of 1,400 in CA (top 69%) — families likely to look elsewhere, expect single-tenant / working-renter base with shorter leases; 76% free/reduced lunch — lower-income household profile, screen leases tightly.
- Market conditions: Rents rising fast (+5.7%/yr); 108 active listings in the ZIP; 40 comparable units currently listed for rent nearby; rentals leasing fast (median 2d on market — plan ~1-2 weeks tenant-placement turnaround); 6,825 units permitted in Sacramento County in 2024 (1,752 in 5+ unit buildings).
- This rent runs 34% of the median local income ($68k/yr) — at the standard rent-burdened threshold; future hikes will face affordability resistance.
Forward outlook
- Local home prices are declining (-3.0%/yr); year-one equity from $892 of loan paydown is wiped out by about $4k of value loss. Plan a longer hold.
- Sacramento County population projected at +17% by 2050 — long-run rental-demand tailwind backs the buy-and-hold thesis.
- At projected returns (-3.0% appreciation + 5.7% rent growth), your $36k cash investment doubles in ~5 years — after that, you're playing with house money.
Negotiation context
- It's been on market 417 days — a 12% lower offer ($114k) is reasonable based on typical stale-listing flexibility.
Risks & watch-outs
- Climate carrying-cost: extreme-heat days projected 7→15/yr by 2055 (HVAC capex compounding) — expect insurance premiums to compound above CPI over the hold.
Questions for the listing agent
- It's been on market 417 days. Have you received any prior offers? Is the seller open to a 12% concession, seller financing, or rate buy-down credit?
- Why hasn't it sold? Are there any deal-killer items the seller is aware of (foundation, flood, title, zoning, code violations)?
- Is there a deadline driving the sale (1031 exchange, divorce, estate, relocation)? That informs how much negotiation room exists.
- Schools are D-rated, which usually means shorter tenancies and higher turnover. Who's the typical renter profile here, and what's been the actual vacancy rate?
- Crime grade is F in this area — have there been break-ins, vandalism, or insurance claims at this property in the last 3 years? What carrier currently insures it and at what premium?
- What's the average days-on-market for RENTAL listings here right now (not sales)? A rising rental-DOM trend means longer vacancies and softer asking-rent achievability than the comps imply.
- What's the recent tenant-quality profile in this submarket — average credit score on applications, eviction rate, late-payment / NSF rate, and stable-employment percentage? A property-management company in the area should have these aggregated.
- How much new for-sale + rental construction is in the pipeline within 1–3 miles? Heavy new supply typically softens prices + rents 12–24 months out; constrained supply supports both.
Investment metrics
- 1% rule
- 1.52% ✓
- Cap rate
- 13.00%
- Cash-on-cash
- 23.96%
- DSCR
- 2.07
- GRM
- 5.5
CMA / ARV
- ARV (median comp)
- $84,950
- List price
- $129,000
- Delta
- 51.85%
- Verdict
- OVERPRICED
- Comps
- 10 within 1.0 mi
Show comp detail 9 sales within ~0.75 mi
| Address | Dist | Beds/Ba | Sqft | Sold | Price | $/sf | Match |
|---|---|---|---|---|---|---|---|
| 5020 Valley Frg | 0.09mi | 3/2.0 | 988 (-2%) | 2mo | $89,900 | $91 | 90 |
| 4814 Independence Ln | 0.19mi | 2/2.0 (-1) | 1,080 (+7%) | 4mo | $65,000 | $60 | 72 |
| 4125 Vicksburg Ln #187 | 0.10mi | 2/1.0 (-1) | 1,045 (+3%) | 13mo | $60,000 | $57 | 70 |
| 5026 Valley Forge Ln #19 | 0.11mi | 3/2.0 | 1,100 (+9%) | 19mo | $100,000 | $91 | 64 |
| 5040 W Jackson. St #91 | 0.41mi | 2/1.0 (-1) | 960 (-5%) | 2mo | $32,500 | $34 | 62 |
| 5040 Jackson St #101 | 0.37mi | 2/2.0 (-1) | 1,070 (+6%) | 14mo | $75,000 | $70 | 56 |
| 5040 Jackson St #126 | 0.41mi | 2/2.0 (-1) | 1,056 (+4%) | 18mo | $78,000 | $74 | 54 |
| 4127 Chesapeake Ln #122 | 0.17mi | 2/1.0 (-1) | 900 (-11%) | 15mo | $47,000 | $52 | 52 |
| 5040 Jackson St #18 | 0.41mi | 2/2.0 (-1) | 880 (-13%) | 6mo | $110,000 | $125 | 50 |
Match score weights: distance 35% · size 25% · config 20% · recency 20%. Top-matched comps best support the ARV.
Projected returns pro-forma
-3.0% appreciation · 5.69% rent growth · sell at horizon
- IRR
- 20.1%
- Equity multiple
- 1.84×
- Total profit
- $30,466
- Equity at exit
- $19,234
- IRR
- 30.0%
- Equity multiple
- 4.02×
- Total profit
- $109,229
- Equity at exit
- $11,154
Cash invested: $36,120 (down + closing). Projections, not guarantees.
Landlord ↔ Tenant lean methodology
- Overall (STATE)
- 18 Strongly Tenant-Friendly
- State California
- 18 Strongly Tenant-Friendly · D+13
- County
- — inherits STATE
- City
- — inherits STATE
ZIP-level market 95660
- Rents YoY
- 5.7%
- Active inventory
- 108
- Price-to-rent
- 5.5×
Monthly cashflow live
- Estimated rent
- $1,957 high interval (Pro) →
- Mortgage (P&I)
- −$676
- Tax from tax record
- −$95 /mo · $1,136/yr
- Insurance
- −$54
- HOA
- −$0
- Vacancy / Maint / Mgmt
- −$411
- Net cashflow
- $721
Break-even live
UW: 25.0% down · 7.5% · 30yr · 1.5% tax · 5.0% vac · 8.0% maint · 8.0% mgmt
Financing live
Cash to close
- Down payment
- $32,250
- Closing costs
- $3,870
- Reserves months
- —
- Total cash needed
- —
Loan-product check · same deal, 3 products live
Conventional
25% down · 7.5% · 30yr
- Down + closing
- —
- Monthly P&I
- —
- Monthly cashflow
- —
- DSCR
- —
- Eligible?
- —
Personal DTI + credit; lowest rate.
DSCR
20% down · 8.5% · 30yr
- Down + closing
- —
- Monthly P&I
- —
- Monthly cashflow
- —
- DSCR
- —
- Eligible?
- —
No personal income docs; deal must DSCR.
Hard money
10% down · 12.0% · 12mo
- Down + closing
- —
- Monthly P&I
- —
- Monthly cashflow
- —
- DSCR
- —
- Eligible?
- —
Short-term bridge; refi at stabilization.
Rent comps 40 comps
| Address | Beds | Baths | Sqft | Rent | $/sqft | DOM | Units | Dist |
|---|---|---|---|---|---|---|---|---|
| 4020 Tricia Way Unit 4688001002 North Highlands, CA | 2.0 | 1.0 | 1000 | $1,495 | $1.50 | 43d | 1 | 0.28mi |
| 4008 Tricia Way North Highlands, CA | 2.0 | 1.0 | 900 | $1,700 | $1.89 | 12d | 1 | 0.31mi |
| 5123 Shell St North Highlands, CA | 2.0 | 1.0 | 912 | $1,950 | $2.14 | 1d | 1 | 0.50mi |
| 4605 Cyclamen Way Sacramento, CA | 2.0 | 1.0 | 870 | $1,695 | $1.95 | 1d | 1 | 0.50mi |
| 4552 Ashcroft Ave Unit 36D Sacramento, CA | 2.0 | 1.0 | 800 | $1,250 | $1.56 | 1d | 1 | 0.53mi |
| 4561 Ashcroft Ave Unit 52 Sacramento, CA | 2.0 | 1.0 | 900 | $1,395 | $1.55 | 1d | 1 | 0.54mi |
| 4561 Ashcroft Ave Apt 49 Sacramento, CA | 2.0 | 1.0 | 888 | $1,499 | $1.69 | 1d | 1 | 0.54mi |
| 5001 Date Ave Sacramento, CA | 3.0 | 2.0 | 1106 | $2,400 | $2.17 | 1d | 1 | 0.57mi |
| 4909 Date Ave Sacramento, CA | 1.0–2.0 | 1.0 | 737 | $1,750 | $2.37 | 43d | 1 | 0.60mi |
| 3731 Scallop Ct North Highlands, CA | 2.0 | 1.0 | 924 | $2,150 | $2.33 | 43d | 1 | 0.60mi |
| 3800 Madison Ave North Highlands, CA | 2.0 | 1.0 | 524 | $1,500 | $2.86 | 1d | 7 | 0.60mi |
| 5061 Shell St North Highlands, CA | 2.0 | 1.0 | 750 | $2,000 | $2.67 | 1d | 1 | 0.61mi |
| 4930 Polk St North Highlands, CA | 2.0–3.0 | 1.0–2.0 | 938 | $1,795 | $1.91 | 1d | 3 | 0.63mi |
| 5048 Date Ave Sacramento, CA | 2.0 | 1.0 | 1000 | $1,588 | $1.59 | 43d | 1 | 0.63mi |
| 4728 Amber Ln Sacramento, CA | 2.0 | 1.0 | 730 | $1,900 | $2.60 | 19d | 1 | 0.66mi |
| 5011 Bremner Way #2 Sacramento, CA | 2.0 | 1.0 | 850 | $1,700 | $2.00 | 1d | 1 | 0.67mi |
| 5011 Bremner Way #3 Sacramento, CA | 2.0 | 1.0 | 850 | $1,700 | $2.00 | 23d | 1 | 0.67mi |
| 5416 Jackson St North Highlands, CA | 1.0–2.0 | 1.0–2.0 | 720 | $1,750 | $2.43 | 1d | 30 | 0.67mi |
| 5008 Bremner Way #3 Sacramento, CA | 2.0 | 1.0 | 850 | $1,650 | $1.94 | 1d | 1 | 0.70mi |
| 5516 Palmdale Way Sacramento, CA | 3.0 | 2.0 | 1115 | $2,250 | $2.02 | 20d | 1 | 0.70mi |
| 5520 Harrison St North Highlands, CA | 2.0 | 1.0 | 735 | $1,478 | $2.01 | 7d | 1 | 0.71mi |
| 4716 Tulane Ct Sacramento, CA | 3.0 | 2.0 | 1303 | $2,450 | $1.88 | 23d | 1 | 0.76mi |
| 4661 Orange Grove Ave Sacramento, CA | 1.0–2.0 | 1.0 | 700 | $1,495 | $2.14 | 23d | 2 | 0.77mi |
| 3609 Myrtle Ave North Highlands, CA | 2.0 | 2.0 | 900 | $1,795 | $1.99 | 1d | 2 | 0.79mi |
| 4815 College Oak Dr Sacramento, CA | 2.0 | 1.0–1.5 | 1000 | $1,662 | $1.66 | 7d | 2 | 0.86mi |
| 4215 Palm Ave Sacramento, CA | 1.0–2.0 | 1.0–2.0 | 775 | $1,660 | $2.14 | 1d | 3 | 0.87mi |
| 3517 Myrtle Ave North Highlands, CA | 2.0 | 2.0 | 900 | $1,750 | $1.94 | 2d | 1 | 0.89mi |
| 5415 College Oak Dr Sacramento, CA | 1.0–2.0 | 1.0–2.0 | 850 | $1,725 | $2.03 | 1d | 3 | 0.94mi |
| 5614 Hillsdale Blvd Unit A Sacramento, CA | 2.0 | 1.5 | 933 | $1,450 | $1.55 | 21d | 1 | 0.95mi |
| 4901 Little Oak Ln Sacramento, CA | 1.0–3.0 | 1.0–2.0 | 915 | $1,832 | $2.00 | 1d | 7 | 0.98mi |
| 5443 College Oak Dr Sacramento, CA | 1.0–2.0 | 1.0–2.0 | 821 | $1,850 | $2.25 | 43d | 3 | 0.99mi |
| 4549 Greenholme Dr #2 Sacramento, CA | 2.0 | 1.0 | 840 | $2,000 | $2.38 | 2d | 1 | 0.99mi |
| 5625 San Vincente Way North Highlands, CA | 3.0 | 1.0 | 875 | $2,150 | $2.46 | 1d | 1 | 0.99mi |
| 5600 Walerga Rd #4 Sacramento, CA | 2.0 | 1.0 | 924 | $1,700 | $1.84 | 1d | 1 | 1.00mi |
| 4815 Mary Kate Dr Sacramento, CA | 2.0 | 2.0 | 1100 | $1,850 | $1.68 | 43d | 1 | 1.01mi |
| 4821 Mary Kate Dr Unit 4823 Sacramento, CA | 2.0 | 2.0 | 1050 | $1,675 | $1.60 | 1d | 1 | 1.02mi |
| 5800 Hamilton St Sacramento, CA | 1.0–2.0 | 1.0–2.0 | 823 | $1,770 | $2.15 | 1d | 4 | 1.02mi |
| 3652 McClellan Dr North Highlands, CA | 2.0 | 1.0 | 750 | $1,650 | $2.20 | 1d | 1 | 1.03mi |
| 5012 Sunshine Ln Sacramento, CA | 2.0 | 1.0 | 970 | $1,775 | $1.83 | 10d | 1 | 1.03mi |
| 4255 Winding Way Sacramento, CA | 2.0 | 1.5 | 1300 | $1,995 | $1.53 | 7d | 1 | 1.03mi |
Listing history 14 events
-
2026-06-18days on market $129,000 Active 417 DOM
-
2026-06-17days on market $129,000 Active 416 DOM
-
2026-06-16days on market $129,000 Active 415 DOM
-
2026-06-15days on market $129,000 Active 414 DOM
-
2026-06-13days on market $129,000 Active 412 DOM
-
2026-06-13days on market $129,000 Active 411 DOM
-
2026-06-10price $129,000 Active 408 DOM
-
2026-06-09days on market $139,900 Active 408 DOM
-
2026-06-08days on market $139,900 Active 407 DOM
-
2026-06-07days on market $139,900 Active 406 DOM
-
2026-06-03days on market $139,900 Active 402 DOM
-
2026-06-02days on market $139,900 Active 401 DOM
-
2026-06-01days on market $139,900 Active 400 DOM
-
2026-05-31days on market $139,900 Active 399 DOM
ⓘ Source: listings_history table (triggers on properties + properties_extension) + one-shot
backfill from property_details.listing_events for pre-trigger history.
Tax reassessment forecast CA · Resets to sale price
- Current annual tax
- $1,136 · $95/mo
- Projected year-2 tax
- $1,136 · $95/mo
- Expected delta
- $0/yr ($0/mo · 0.0%)
ⓘ Screening estimate from a state-policy table — verify with the county assessor before closing.
Climate risk First Street
- Flood 1/10 Low FEMA zone X (unshaded) · 0% chance over 30 yrs
- Wildfire 1/10 Low
- Heat 7/10 Severe 7 d/yr ≥102°F today · 15 d/yr by 30 yrs out
- Wind 1/10 Low
- Air quality 10/10 Extreme 34 unhealthy d/yr today · 38 by 30 yrs out
Nearby sold comps map
Loading sold comps map…
Walkable amenities ~0.75 mi
Loading nearby amenities…
Taxation est. · year 1
- Rental income
- $23,487
- − Mortgage interest
- −$7,226
- − Property taxes
- −$1,136
- − Insurance
- −$645
- − Repairs & maintenance
- −$1,879
- − Management
- −$1,879
- − Depreciation
- −$3,753
- Taxable income
- $6,969
- Est. tax owed @ 24.0%
- −$1,673
- After-tax cash flow
- $6,983/yr
For passive investors: Depreciation is non-cash, so a rental often shows a tax loss while cash-flowing — sheltering income. Rental losses are passive: they offset passive income freely, and up to $25,000/yr can offset ordinary (W-2) income if you actively participate and your MAGI is under $100k (phasing out to $0 by $150k); unused losses carry forward. On sale, claimed depreciation is recaptured at up to 25%, and gains may owe capital-gains tax (a 1031 exchange can defer both). Figures are a year-1 estimate at your 24.0% rate — not tax advice; consult a CPA.
Condition & rehab AI · 12 photos
This 2021 manufactured home is move-in ready with modern updates and a good condition score. It offers a good investment opportunity with potential for further value enhancement through minor cosmetic upgrades.
Value-add opportunities
- Both Painting exterior and interior — Fresh paint enhances curb appeal and interior aesthetics
- Both Landscaping and curb appeal improvements — Enhances curb appeal and adds value
- Resale New flooring in bathrooms — Modern flooring improves aesthetics and functionality
- Resale New kitchen appliances — Modern appliances enhance functionality and appeal
Renovation cost estimate screening
Value-add ROI direction
- Both Painting exterior and interior — Fresh paint enhances curb appeal and interior aesthetics ↑
- Both Landscaping and curb appeal improvements — Enhances curb appeal and adds value ↑
- Resale New flooring in bathrooms — Modern flooring improves aesthetics and functionality ↑
- Resale New kitchen appliances — Modern appliances enhance functionality and appeal ↑
ⓘ Cost ranges are severity-bucket heuristics (US national rule-of-thumb). Get contractor quotes + a written scope before underwriting a rehab budget.
Schools (NCES district)
- District
- Twin Rivers Unified
- NCES district ID
- 0601332
- Math proficiency
- 29% ▲ 2.00%
- Reading proficiency
- 37% ▲ 2.00%
- Median HH income
- $42,481
- Composite
- 30.67/100
- National rank
- #11437
- State rank
- #970 of 1400 in CA
Livability — North Highlands
- Score
- 61/100
- State rank
- #523
- US rank
- #17613
Category grades
Schools grade is shown separately in the Schools card above.
Census & demographics
- Census place
- North Highlands, CA
- County
- Sacramento County · 1,539,646 people
- City population
- 56,900
- Metro
- Sacramento-Roseville-Folsom, CA
- Population (ZIP)
- 35,451
- Household income
- $68,235
- Rent vs Own
- Severe rent burden
- 1300.0
Population outlook (Sacramento County) Hauer SSP2
- Today (2025)
- 1,660,763 people
- By 2030
- 1,732,990 · +4.3%
- By 2040
- 1,855,755 · +11.7%
- By 2050
- 1,941,335 · +16.9%
- By 2075
- 2,046,162 · +23.2%
- By 2100
- 1,961,444 · +18.1%
Race, ethnicity, and origin ACS 2023
- Neighborhood character
- Diverse neighborhood (Simpson 0.69)
- Race & ethnicity
- White 41% Hispanic / Latino 37% Two or more races 16% Black 9% Asian 7%
- Hispanic origin (detail)
- Mexican 29%
- Common ancestry
- Subsaharan African 5% Scotch-Irish 2% Scandinavian 2%
- Foreign-born
- 28% · Canada, Vietnam
- Languages at home
- 56% English-only · Spanish 25% Russian/Polish/Slavic 9% Other Indo-European 5%
Political lean MEDSL · Sacramento
- 2024 margin
- D (+19.7) · D 58.1% · R 38.4% · Other 3.5%
- 2008→2024 swing
- +0.7pp no change · 2008: 19.0pp · 2024: 19.7pp
- All cycles
- 2024: D+19.7 2020: D+25.3 2016: D+23.7 2012: D+16.3 2008: D+19.0
Not yet ingested
- Civics
- —
Market trends
- HPI YoY
- ▼ -273.83%
- Current HPI
- 438.1022
- Rent YoY
- ▲ 5.69%
- Metro
- Sacramento-Roseville-Folsom, CA
- State GDP YoY
- ▲ 3.21%
- F500 in state
- 116
Industry mix (Fortune 500 HQ in CA)
| Industry | F500 HQs | Revenue |
|---|---|---|
| Technology | 27 | $1,492B |
|
||
| Financial Services | 3 | $174B |
|
||
| Retail | 3 | $44B |
|
||
| Insurance | 3 | $26B |
|
||
| Media / Entertainment | 2 | $115B |
|
||
| Pharmaceuticals / Biotech | 2 | $62B |
|
||
Property tax history
+110.4%/yrLatest (2025): $1,136 · -0.3% YoY. Source: county tax records.
Cash-flow waterfall
monthlySold comps — $/sqft
last 12 mo · ≤1 miLoading sold comps…