 🏷️ Likely Rental
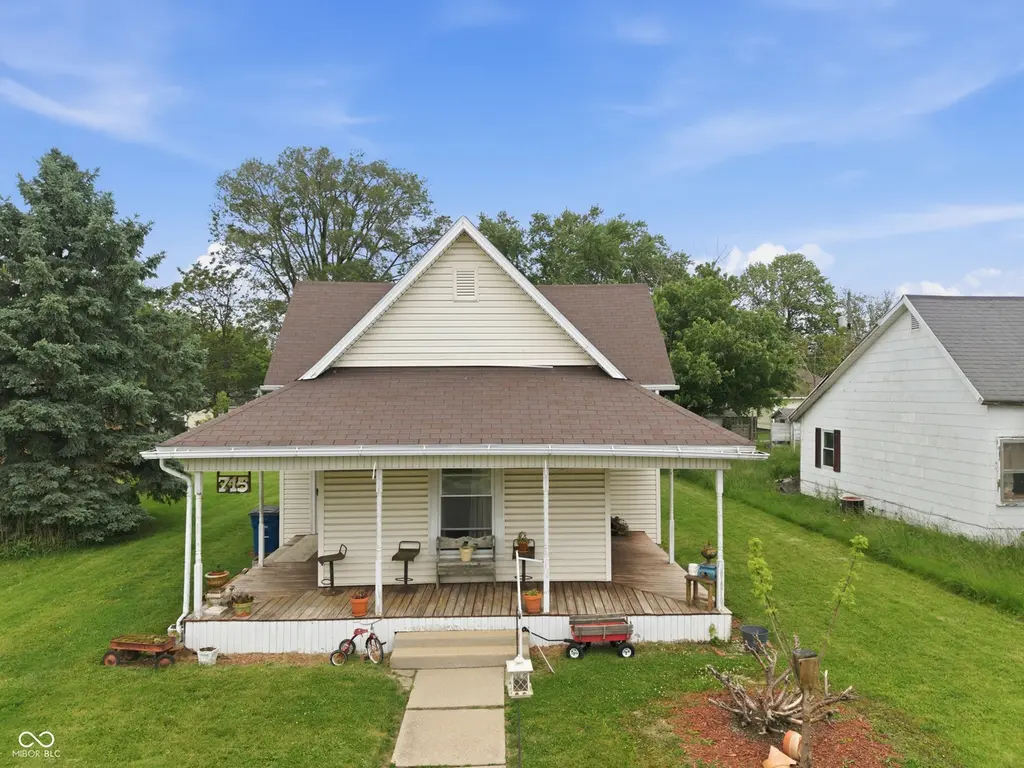
715 E 30th St · Marion, IN
Flood risk 1/10 · Minimal
- FEMA flood zone
- X (unshaded)
- Chance of flooding over 30 yrs
- 0.0%
- Est. flood insurance / yr
- $507 – $1,088
Fire risk 3/10 · Minor
- Est. fire insurance / yr
- $717 – $1,331
Heat risk 3/10 · Minor
- Hot days now (above 100°F)
- 7 days/yr
- Hot days in 30 yrs
- 18 days/yr
Wind risk 2/10 · Minimal
- Chance of severe wind over 30 yrs
- —
Air-quality risk 2/10 · Minimal
- Unhealthy air days now
- 1 days/yr
- Unhealthy air days in 30 yrs
- 2 days/yr
Risk factors via First Street. Map © Google.
Why this score? — see what drove the B grade
The composite is a weighted blend of 9 inputs, each scored 0–100. Each bar is that input's sub-score; the figure is the points it added to the 100-point composite (weight × sub-score).
- Cash flow +30.0/30.0
- ARV discount +15.0/15.0
- 1% rule +10.0/10.0
- DSCR +10.0/10.0
- Livability +3.2/5.0
- Rent growth +2.5/5.0
- Condition / age +2.5/5.0
- Schools +1.7/10.0
- Appreciation +0.0/10.0
$68,000
🖨 Deal sheet (PDF) 📄 Offer letter ✓ Due diligence
Listing remarks
This property represents a high-yield, low-volatility acquisition opportunity within the stable housing market of Marion, Indiana. Targeted specifically at the workforce housing demographic, this asset is designed to generate consistent, passive cash flow through long-term tenant occupancy. The property's fundamental metrics-a 3-bedroom, 1-bath footprint-place it squarely in the "sweet spot" for local rental demand, ensuring that the property remains competitive against both higher-cost alternatives and lower-quality housing stock. PROPERTY HIGHLIGHTS Rental Demand: The 3-bedroom, 1-bath configuration is a versatile product type, appealing to small families and long-term tenan
Key facts
- 5,980 sq ft lot
- Built 1900
- Listed 19 days
Property features AI
Exterior
- Security: Smoke detector(s)
- Utilities: Public water; Municipal sewer connected; No solid waste service listed
- Home design: Single family residence; Updated/remodeled condition; One story
- Construction: Vinyl siding; Crawl space foundation
- Exterior features: Wrap-around porch; Has a view; Lot under 1/4 acre
Interior
- Kitchen: Kitchen (14 x 13); Microwave; Refrigerator
- Bedrooms: 3 bedrooms on the main level; Bedroom 2 (12 x 10); Bedroom 3 (10 x 10)
- Bathrooms: 1 full bathroom (main level)
- Heating & cooling: Electric heating; Central air conditioning
- Interior features: Pantry; Walk-in closet(s); Living room (10 x 15)
- Laundry & utility: Water heater
Neighborhood map
What this means for you Summary
Snapshot
- This is a 3-bed/1.0-bath single-family listed at $68k.
Deal economics
- At list price, monthly cash flow is $402 ($5k/yr) — positive.
- The deal already cash-flows at list — no discount required.
- Meets the 1% rule at list price ($1k rent vs $68k).
- Recommended offer: $67k (1.5% below list) — sets the bar for market timing.
- Cap rate 13.4% vs local median 8.2% in Marion — top-decile yield for the area; either an underpriced asset or a hidden risk that comps aren't pricing in. Stress-test before assuming the spread holds.
Location & tenants
- Location reads 65/100 on livability (#337 in IN) — a middle-class / working-renter tenant base. Strengths: crime A+, cost of living A+, housing A+; Watch: amenities F, commute F, employment F.
- Marion Community Schools (town): math 18% / reading 24% proficiency, ranked #277 of 301 in IN (top 92%) — low school quality limits family demand, transient renter base, plan for 1-2y turnover; 67% free/reduced lunch — lower-income household profile, screen leases tightly.
- Zoned schools: Allen Elementary School (math 22% / reading 17%, grade F, #814 of 994 statewide, top 83%, 399 students, 84% FRL); John L Mcculloch Junior High Sch (math 11% / reading 22%, grade F, #287 of 330 statewide, top 88%, 524 students, 74% FRL); Marion High School (math 12% / reading 47%, grade F, #308 of 369 statewide, top 84%, 1,050 students, 66% FRL).
- Market conditions: 114 active listings in the ZIP; 1 comparable units currently listed for rent nearby; 52 units permitted in Grant County in 2024 (8 in 5+ unit buildings).
Forward outlook
- Local home prices are declining (-3.0%/yr); year-one equity from $470 of loan paydown is wiped out by about $2k of value loss. Plan a longer hold.
- Grant County population projected at -18% by 2050 — secular population decline; favor cash flow + early exit over multi-decade hold.
- At projected returns (-3.0% appreciation + 3.0% rent growth), your $19k cash investment doubles in ~5 years — after that, you're playing with house money.
Negotiation context
- It's been on market 20 days — a 2% lower offer ($67k) is reasonable based on typical stale-listing flexibility.
Risks & watch-outs
- Watch-outs: built in 1900 — expect roof / HVAC / electrical / plumbing capex.
Questions for the listing agent
- Built in 1900 — when were the roof, HVAC, electrical panel, plumbing, and water heater last replaced?
- Is there a deadline driving the sale (1031 exchange, divorce, estate, relocation)? That informs how much negotiation room exists.
- Schools are F-rated, which usually means shorter tenancies and higher turnover. Who's the typical renter profile here, and what's been the actual vacancy rate?
- What's the average days-on-market for RENTAL listings here right now (not sales)? A rising rental-DOM trend means longer vacancies and softer asking-rent achievability than the comps imply.
- What's the recent tenant-quality profile in this submarket — average credit score on applications, eviction rate, late-payment / NSF rate, and stable-employment percentage? A property-management company in the area should have these aggregated.
- How much new for-sale + rental construction is in the pipeline within 1–3 miles? Heavy new supply typically softens prices + rents 12–24 months out; constrained supply supports both.
Investment metrics
- 1% rule
- 1.65% ✓
- Cap rate
- 13.39%
- Cash-on-cash
- 25.34%
- DSCR
- 2.13
- GRM
- 5.1
CMA / ARV
- ARV (on-the-fly)
- $97,236
- Comps found
- 12
Show comp detail 12 sales within ~0.75 mi
| Address | Dist | Beds/Ba | Sqft | Sold | Price | $/sf | Match |
|---|---|---|---|---|---|---|---|
| 2722 S Home Ave | 0.19mi | 2/1.0 (-1) | 868 (-1%) | 6mo | $58,000 | $67 | 80 |
| 3216 S Overman St | 0.24mi | 2/1.0 (-1) | 880 (+0%) | 11mo | $75,000 | $85 | 74 |
| 8 Valley Ct | 0.45mi | 3/1.0 | 912 (+4%) | 6mo | $122,000 | $134 | 67 |
| 1521 E 33rd St | 0.64mi | 3/1.0 | 896 (+2%) | 2mo | $75,000 | $84 | 65 |
| 2701 S Washington St | 0.42mi | 2/1.0 (-1) | 852 (-3%) | 8mo | $25,500 | $30 | 64 |
| 1122 E 27th St | 0.43mi | 3/1.0 | 976 (+11%) | 9mo | $108,500 | $111 | 53 |
| 3411 S Home Ave | 0.53mi | 2/1.0 (-1) | 804 (-8%) | 6mo | $97,200 | $121 | 52 |
| 3312 S Overman Ave | 0.34mi | 2/2.0 (-1) | 768 (-12%) | 7mo | $96,900 | $126 | 49 |
| 3639 S Felton St | 0.73mi | 3/1.0 | 960 (+10%) | 9mo | $74,000 | $77 | 42 |
| 1607 E 33rd St | 0.70mi | 3/1.0 | 1,000 (+14%) | 6mo | $44,900 | $45 | 38 |
| 2114 S Branson St | 0.59mi | 3/1.5 | 1,000 (+14%) | 10mo | $120,000 | $120 | 38 |
| 3213 S Curfman Rd | 0.66mi | 3/1.0 | 988 (+13%) | 13mo | $110,000 | $111 | 37 |
Match score weights: distance 35% · size 25% · config 20% · recency 20%. Top-matched comps best support the ARV.
Projected returns pro-forma
-3.0% appreciation · 3.0% rent growth · sell at horizon
- IRR
- 18.9%
- Equity multiple
- 1.77×
- Total profit
- $14,609
- Equity at exit
- $10,139
- IRR
- 27.3%
- Equity multiple
- 3.40×
- Total profit
- $45,789
- Equity at exit
- $5,879
Cash invested: $19,040 (down + closing). Projections, not guarantees.
Landlord ↔ Tenant lean methodology
- Overall (STATE)
- 90 Strongly Landlord-Friendly
- State Indiana
- 90 Strongly Landlord-Friendly · R+11
- County
- — inherits STATE
- City
- — inherits STATE
ZIP-level market 46953
- Home prices YoY
- -23.4%
- Active inventory
- 114
- Price-to-rent
- 5.1×
Monthly cashflow live
- Estimated rent
- $1,119 medium interval (Pro) →
- Mortgage (P&I)
- −$357
- Tax from tax record
- −$97 /mo · $1,164/yr
- Insurance
- −$28
- HOA
- −$0
- Vacancy / Maint / Mgmt
- −$235
- Net cashflow
- $402
Break-even live
Sensitivity live
| Price | -10% $440 | -5% $421 | +0% $402 | +5% $383 | +10% $364 |
|---|---|---|---|---|---|
| Rent | -10% $314 | -5% $358 | +0% $402 | +5% $446 | +10% $490 |
| Rate | -1.0pp $436 | -0.5pp $419 | base $402 | +0.5pp $384 | +1.0pp $366 |
UW: 25.0% down · 7.5% · 30yr · 1.5% tax · 5.0% vac · 8.0% maint · 8.0% mgmt
Financing live
Cash to close
- Down payment
- $17,000
- Closing costs
- $2,040
- Reserves months
- —
- Total cash needed
- —
Loan-product check · same deal, 3 products live
Conventional
25% down · 7.5% · 30yr
- Down + closing
- —
- Monthly P&I
- —
- Monthly cashflow
- —
- DSCR
- —
- Eligible?
- —
Personal DTI + credit; lowest rate.
DSCR
20% down · 8.5% · 30yr
- Down + closing
- —
- Monthly P&I
- —
- Monthly cashflow
- —
- DSCR
- —
- Eligible?
- —
No personal income docs; deal must DSCR.
Hard money
10% down · 12.0% · 12mo
- Down + closing
- —
- Monthly P&I
- —
- Monthly cashflow
- —
- DSCR
- —
- Eligible?
- —
Short-term bridge; refi at stabilization.
Rent comps 1 comps
| Address | Beds | Baths | Sqft | Rent | $/sqft | DOM | Units | Dist |
|---|---|---|---|---|---|---|---|---|
| 703 E 28th St Marion, IN | 2.0 | 1.0 | 1085 | $1,200 | $1.11 | 45d | 1 | 0.14mi |
Listing history 14 events
-
2026-06-21days on market $68,000 Active 20 DOM
-
2026-06-19days on market $68,000 Active 18 DOM
-
2026-06-18days on market $68,000 Active 17 DOM
-
2026-06-17days on market $68,000 Active 16 DOM
-
2026-06-16days on market $68,000 Active 15 DOM
-
2026-06-15days on market $68,000 Active 14 DOM
-
2026-06-14days on market $68,000 Active 12 DOM
-
2026-06-12days on market $68,000 Active 11 DOM
-
2026-06-09days on market $68,000 Active 8 DOM
-
2026-06-09price $68,000 Active 7 DOM
-
2026-06-08days on market $74,900 Active 7 DOM
-
2026-06-07days on market $74,900 Active 6 DOM
-
2026-06-02remarks 689-char remark
-
2026-06-02$74,900 Active 1 DOM
ⓘ Source: listings_history table (triggers on properties + properties_extension) + one-shot
backfill from property_details.listing_events for pre-trigger history.
Tax reassessment forecast IN · Partial reset (capped growth)
- Current annual tax
- $1,164 · $97/mo
- Projected year-2 tax
- $1,164 · $97/mo
- Expected delta
- $0/yr ($0/mo · 0.0%)
ⓘ Screening estimate from a state-policy table — verify with the county assessor before closing.
Climate risk First Street
- Flood 1/10 Low FEMA zone X (unshaded) · 0% chance over 30 yrs
- Wildfire 3/10 Moderate
- Heat 3/10 Moderate 7 d/yr ≥100°F today · 18 d/yr by 30 yrs out
- Wind 2/10 Low
- Air quality 2/10 Low 1 unhealthy d/yr today · 2 by 30 yrs out
Nearby sold comps map
Loading sold comps map…
Walkable amenities ~0.75 mi
Loading nearby amenities…
Taxation est. · year 1
- Rental income
- $13,427
- − Mortgage interest
- −$3,809
- − Property taxes
- −$1,164
- − Insurance
- −$340
- − Repairs & maintenance
- −$1,074
- − Management
- −$1,074
- − Depreciation
- −$1,978
- Taxable income
- $3,987
- Est. tax owed @ 24.0%
- −$957
- After-tax cash flow
- $3,867/yr
For passive investors: Depreciation is non-cash, so a rental often shows a tax loss while cash-flowing — sheltering income. Rental losses are passive: they offset passive income freely, and up to $25,000/yr can offset ordinary (W-2) income if you actively participate and your MAGI is under $100k (phasing out to $0 by $150k); unused losses carry forward. On sale, claimed depreciation is recaptured at up to 25%, and gains may owe capital-gains tax (a 1031 exchange can defer both). Figures are a year-1 estimate at your 24.0% rate — not tax advice; consult a CPA.
Schools (NCES district)
- District
- Marion Community Schools
- NCES district ID
- 1806390
- Math proficiency
- 18% ▼ -9.00%
- Reading proficiency
- 24% ▼ -6.00%
- Median HH income
- $33,415
- Composite
- 17.13/100
- National rank
- #9115
- State rank
- #277 of 301 in IN
Livability — Marion
- Score
- 65/100
- State rank
- #337
- US rank
- #13006
Category grades
Schools grade is shown separately in the Schools card above.
Census & demographics
- Census place
- Marion, IN
- County
- Grant County · 41,561 people
- City population
- 41,561
- Metro
- Marion, IN
- Population (ZIP)
- 23,372
- Household income
- $46,288
- Rent vs Own
- Severe rent burden
- 597.0
Population outlook (Grant County) Hauer SSP2
- Today (2025)
- 64,394 people
- By 2030
- 62,145 · -3.5%
- By 2040
- 57,252 · -11.1%
- By 2050
- 52,968 · -17.7%
- By 2075
- 45,986 · -28.6%
- By 2100
- 39,400 · -38.8%
Race, ethnicity, and origin ACS 2023
- Neighborhood character
- Predominantly White (77%)
- Race & ethnicity
- White 77% Black 10% Two or more races 9% Hispanic / Latino 6%
- Hispanic origin (detail)
- Mexican 4%
- Common ancestry
- Italian 3% Iranian 1% Slovak 1%
- Foreign-born
- 2% · Canada
- Languages at home
- 96% English-only · Spanish 3%
Political lean MEDSL · Grant
- 2024 margin
- Solid R (+41.8) · D 28.2% · R 70.0% · Other 1.9%
- 2008→2024 swing
- -28.7pp toward R · 2008: -13.1pp · 2024: -41.8pp
- All cycles
- 2024: R+41.8 2020: R+38.8 2016: R+39.5 2012: R+22.0 2008: R+13.1
Not yet ingested
- Civics
- —
Market trends
- HPI YoY
- ▼ -52.47%
- Current HPI
- 171.7246
- Rent YoY
- —
- Metro
- Marion, IN
- State GDP YoY
- ▲ 2.90%
- F500 in state
- 18
Industry mix (Fortune 500 HQ in IN)
| Industry | F500 HQs | Revenue |
|---|---|---|
| Industrial Machinery | 2 | $37B |
|
||
| Healthcare | 1 | $177B |
|
||
| Pharmaceuticals | 1 | $45B |
|
||
| Metals / Steel | 1 | $18B |
|
||
| Agriculture | 1 | $17B |
|
||
| Packaging | 1 | $12B |
|
||
Price history
1 event — show timeline
- 2026-06-01 Listed $74,900 MIBOR as Distributed by MLS Grid
Property tax history
+1.5%/yrLatest (2025): $1,164 · +123.8% YoY. Source: county tax records.
Cash-flow waterfall
monthlySold comps — $/sqft
last 12 mo · ≤1 miLoading sold comps…