4205 Auburn Way S #119 · Auburn, WA
Flood risk 1/10 · Minimal
- FEMA flood zone
- X (unshaded)
- Chance of flooding over 30 yrs
- 0.0%
- Est. flood insurance / yr
- $507 – $1,088
Fire risk 3/10 · Minor
- Est. fire insurance / yr
- $604 – $1,122
Heat risk 2/10 · Minimal
- Hot days now (above 87°F)
- 6 days/yr
- Hot days in 30 yrs
- 13 days/yr
Wind risk 1/10 · Minimal
- Chance of severe wind over 30 yrs
- —
Air-quality risk 7/10 · Major
- Unhealthy air days now
- 10 days/yr
- Unhealthy air days in 30 yrs
- 11 days/yr
Risk factors via First Street. Map © Google.
Why this score? — see what drove the A grade
The composite is a weighted blend of 9 inputs, each scored 0–100. Each bar is that input's sub-score; the figure is the points it added to the 100-point composite (weight × sub-score).
- Cash flow +30.0/30.0
- ARV discount +14.8/15.0
- 1% rule +10.0/10.0
- DSCR +10.0/10.0
- Appreciation +10.0/10.0
- Schools +4.7/10.0
- Livability +4.0/5.0
- Condition / age +4.0/5.0
- Rent growth +2.4/5.0
$75,000
🖨 Deal sheet (PDF) 📄 Offer letter ✓ Due diligence
Listing remarks
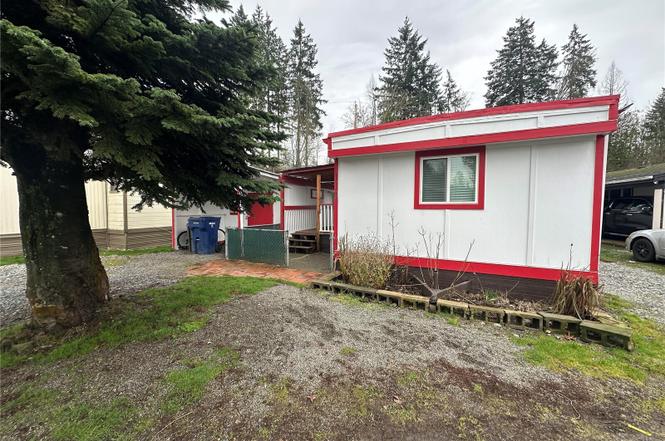
Located in all age park Forest Villa Manor community. This well maintained 3 bedroom 1 bathroom is move in ready conveniently near shopping and commuting routes, and offered at an accessible price, park approval required.
Key facts
- Parking
- Built 1973
- Listed 116 days
Property features AI
Finance
- Other: Calculated building area: 952 square feet; Directions: Park is on Auburn Way S past Muckleshoot Casino; mobile home is on last row
- Financial info: Listing terms: Cash or Conventional
- HOA & community: Land lease: $1,050; Approximately 125 homes in the park; Pets allowed: see remarks
Exterior
- Parking: Uncovered parking
- Utilities: Public water (Forest Villa Manor); Public sewer (Forest Villa Manor); Power provided by PSE
- Home design: Manufactured double-wide home; Single level
- Construction: Manufactured house (double wide)
- Exterior features: Located in a manufactured home park (Forest Villa Manor); Park approved for sale
Interior
- Kitchen: Includes refrigerator and stove/range
- Bedrooms: 3 bedrooms
- Flooring: Laminate flooring
- Bathrooms: 1 full bathroom; 1 bathtub
- Heating & cooling: Forced air heating; Electric energy source
- Interior features: Refrigerator; Stove/Range
Neighborhood map
What this means for you Summary
Snapshot
- This is a 3-bed/1.0-bath manufactured listed at $75k. Condition is rated good.
Deal economics
- At list price, monthly cash flow is $1k ($16k/yr) — positive.
- The deal already cash-flows at list — no discount required.
- Meets the 1% rule at list price ($2k rent vs $75k).
- Recommended offer: $68k (9.0% below list) — sets the bar for market timing.
- Cap rate 28.1% vs local median 2.7% in Auburn — top-decile yield for the area; either an underpriced asset or a hidden risk that comps aren't pricing in. Stress-test before assuming the spread holds.
Location & tenants
- Location reads 81/100 on livability (#75 in WA, #1,371 nationally) — a professional / high-income tenant draw. Strengths: amenities A+, commute A+, employment A+; Watch: crime F, cost of living F.
- Auburn School District (urban): math 47% / reading 56% proficiency, ranked #125 of 291 in WA (top 43%) — acceptable for families but not a draw, mixed tenant base, ~2y average lease.
- Zoned schools: Chinook Elementary School (562 students, 70% FRL); Olympic Middle School (900 students, 78% FRL); Auburn Senior High School (1,844 students, 67% FRL) — zoned schools average 72% FRL vs 44% district-wide (27 pts higher); higher-poverty schools than district average — tighter screening recommended.
- Market conditions: Rents soft (-0.5%/yr); 298 active listings in the ZIP; 2 comparable units currently listed for rent nearby; high-income renter base; 10,555 units permitted in King County in 2024 (7,119 in 5+ unit buildings).
Forward outlook
- In year one you build about $8k of equity ($519 loan paydown + $8k appreciation (10.0% local appreciation)).
- King County population projected at +44% by 2050 — long-run rental-demand tailwind backs the buy-and-hold thesis.
- At projected returns (10.0% appreciation + 0.0% rent growth), your $21k cash investment doubles in ~1 year — after that, you're playing with house money.
- By year 5, paydown + projected appreciation supports a ~$37k cash-out refi (75% LTV) — recoverable capital for the next deal without selling this one.
Negotiation context
- It's been on market 116 days — a 9% lower offer ($68k) is reasonable based on typical stale-listing flexibility.
- 2 sale attempts; this cycle's ask has dropped $20k (21%) from the opening price — seller is motivated, your offer sets the floor, not the list.
Questions for the listing agent
- It's been on market 116 days. Have you received any prior offers? Is the seller open to a 9% concession, seller financing, or rate buy-down credit?
- Built in 1973 — when were the roof, HVAC, electrical panel, plumbing, and water heater last replaced?
- Why hasn't it sold? Are there any deal-killer items the seller is aware of (foundation, flood, title, zoning, code violations)?
- Is there a deadline driving the sale (1031 exchange, divorce, estate, relocation)? That informs how much negotiation room exists.
- Crime grade is F in this area — have there been break-ins, vandalism, or insurance claims at this property in the last 3 years? What carrier currently insures it and at what premium?
- What's the average days-on-market for RENTAL listings here right now (not sales)? A rising rental-DOM trend means longer vacancies and softer asking-rent achievability than the comps imply.
- What's the recent tenant-quality profile in this submarket — average credit score on applications, eviction rate, late-payment / NSF rate, and stable-employment percentage? A property-management company in the area should have these aggregated.
- How much new for-sale + rental construction is in the pipeline within 1–3 miles? Heavy new supply typically softens prices + rents 12–24 months out; constrained supply supports both.
Investment metrics
- 1% rule
- 3.18% ✓
- Cap rate
- 28.12%
- Cash-on-cash
- 77.94%
- DSCR
- 4.47
- GRM
- 2.6
CMA / ARV
- ARV (on-the-fly)
- $89,488
- Comps found
- 1
Show comp detail 1 sale within ~0.75 mi
| Address | Dist | Beds/Ba | Sqft | Sold | Price | $/sf | Match |
|---|---|---|---|---|---|---|---|
| 4040 Auburn Way S #6 | 0.17mi | 2/1.0 (-1) | 852 (-10%) | 12mo | $80,000 | $94 | 60 |
Match score weights: distance 35% · size 25% · config 20% · recency 20%. Top-matched comps best support the ARV.
Projected returns pro-forma
10.0% appreciation · 0.0% rent growth · sell at horizon
- IRR
- 85.4%
- Equity multiple
- 6.75×
- Total profit
- $120,772
- Equity at exit
- $67,566
- IRR
- 79.0%
- Equity multiple
- 14.09×
- Total profit
- $274,908
- Equity at exit
- $145,709
Cash invested: $21,000 (down + closing). Projections, not guarantees.
Landlord ↔ Tenant lean methodology
- Overall (STATE)
- 28 Tenant-Leaning
- State Washington
- 28 Tenant-Leaning · D+8
- County
- — inherits STATE
- City
- — inherits STATE
ZIP-level market 98092
- Home prices YoY
- 3.3%
- Rents YoY
- -0.5%
- Active inventory
- 298
- Price-to-rent
- 2.6×
Monthly cashflow live
- Estimated rent
- $2,383 medium interval (Pro) →
- Mortgage (P&I)
- −$393
- Tax est. 1.5%
- −$94 /mo · $1,125/yr
- Insurance
- −$31
- HOA
- −$0
- Vacancy / Maint / Mgmt
- −$500
- Net cashflow
- $1,364
Break-even live
Sensitivity live
| Price | -10% $1,416 | -5% $1,390 | +0% $1,364 | +5% $1,338 | +10% $1,312 |
|---|---|---|---|---|---|
| Rent | -10% $1,176 | -5% $1,270 | +0% $1,364 | +5% $1,458 | +10% $1,552 |
| Rate | -1.0pp $1,402 | -0.5pp $1,383 | base $1,364 | +0.5pp $1,345 | +1.0pp $1,325 |
UW: 25.0% down · 7.5% · 30yr · 1.5% tax · 5.0% vac · 8.0% maint · 8.0% mgmt
Financing live
Cash to close
- Down payment
- $18,750
- Closing costs
- $2,250
- Reserves months
- —
- Total cash needed
- —
Loan-product check · same deal, 3 products live
Conventional
25% down · 7.5% · 30yr
- Down + closing
- —
- Monthly P&I
- —
- Monthly cashflow
- —
- DSCR
- —
- Eligible?
- —
Personal DTI + credit; lowest rate.
DSCR
20% down · 8.5% · 30yr
- Down + closing
- —
- Monthly P&I
- —
- Monthly cashflow
- —
- DSCR
- —
- Eligible?
- —
No personal income docs; deal must DSCR.
Hard money
10% down · 12.0% · 12mo
- Down + closing
- —
- Monthly P&I
- —
- Monthly cashflow
- —
- DSCR
- —
- Eligible?
- —
Short-term bridge; refi at stabilization.
Rent comps 2 comps
| Address | Beds | Baths | Sqft | Rent | $/sqft | DOM | Units | Dist |
|---|---|---|---|---|---|---|---|---|
| 3320 Auburn Way S Auburn, WA | 2.0 | 1.5 | 1033 | $2,200 | $2.13 | 0d | 1 | 0.51mi |
| 2901 Auburn Way S Auburn, WA | 1.0–2.0 | 1.0 | 667 | $2,175 | $3.26 | 0d | 20 | 0.74mi |
Listing history 17 events
-
2026-06-18days on market $75,000 Active 116 DOM
-
2026-06-17days on market $75,000 Active 115 DOM
-
2026-06-16days on market $75,000 Active 114 DOM
-
2026-06-15days on market $75,000 Active 113 DOM
-
2026-06-13days on market $75,000 Active 111 DOM
-
2026-06-13pricedays on market $75,000 Active 110 DOM
-
2026-06-09days on market $85,000 Active 107 DOM
-
2026-06-08days on market $85,000 Active 106 DOM
-
2026-06-07days on market $85,000 Active 105 DOM
-
2026-06-04days on market $85,000 Active 102 DOM
-
2026-06-03days on market $85,000 Active 101 DOM
-
2026-06-02days on market $85,000 Active 100 DOM
-
2026-06-01days on market $85,000 Active 99 DOM
-
2026-05-31days on market $85,000 Active 98 DOM
-
2026-05-22status Active
-
2026-02-24price $85,000
-
2026-02-04$95,000 Active
ⓘ Source: listings_history table (triggers on properties + properties_extension) + one-shot
backfill from property_details.listing_events for pre-trigger history.
Climate risk First Street
- Flood 1/10 Low FEMA zone X (unshaded) · 0% chance over 30 yrs
- Wildfire 3/10 Moderate
- Heat 2/10 Low 6 d/yr ≥87°F today · 13 d/yr by 30 yrs out
- Wind 1/10 Low
- Air quality 7/10 Severe 10 unhealthy d/yr today · 11 by 30 yrs out
Nearby sold comps map
Loading sold comps map…
Walkable amenities ~0.75 mi
Loading nearby amenities…
Taxation est. · year 1
- Rental income
- $28,592
- − Mortgage interest
- −$4,201
- − Property taxes
- −$1,125
- − Insurance
- −$375
- − Repairs & maintenance
- −$2,287
- − Management
- −$2,287
- − Depreciation
- −$2,182
- Taxable income
- $16,134
- Est. tax owed @ 24.0%
- −$3,872
- After-tax cash flow
- $12,495/yr
For passive investors: Depreciation is non-cash, so a rental often shows a tax loss while cash-flowing — sheltering income. Rental losses are passive: they offset passive income freely, and up to $25,000/yr can offset ordinary (W-2) income if you actively participate and your MAGI is under $100k (phasing out to $0 by $150k); unused losses carry forward. On sale, claimed depreciation is recaptured at up to 25%, and gains may owe capital-gains tax (a 1031 exchange can defer both). Figures are a year-1 estimate at your 24.0% rate — not tax advice; consult a CPA.
Condition & rehab AI · 13 photos
This well-maintained 3-bedroom mobile home is move-in ready and located in a convenient community. It has good curb appeal and interior condition, with minor updates that can significantly increase its value.
Value-add opportunities
- Both Paint exterior — Fresh paint can improve curb appeal and home value.
- Both Clean gutters — Clean gutters prevent water damage and improve home value.
- Both Add landscaping — Landscaping can enhance curb appeal and home value.
- Both Install new flooring in bathrooms — New flooring can improve the look and feel of the bathrooms.
- Both Upgrade kitchen appliances — Modern appliances can improve the functionality and appeal of the kitchen.
Renovation cost estimate screening
Value-add ROI direction
- Both Paint exterior — Fresh paint can improve curb appeal and home value. ↑
- Both Clean gutters — Clean gutters prevent water damage and improve home value. ↑
- Both Add landscaping — Landscaping can enhance curb appeal and home value. ↑
- Both Install new flooring in bathrooms — New flooring can improve the look and feel of the bathrooms. ↑
- Both Upgrade kitchen appliances — Modern appliances can improve the functionality and appeal of the kitchen. ↑
ⓘ Cost ranges are severity-bucket heuristics (US national rule-of-thumb). Get contractor quotes + a written scope before underwriting a rehab budget.
Schools (NCES district)
- District
- Auburn School District
- NCES district ID
- 5300300
- Math proficiency
- 47% ▼ -3.00%
- Reading proficiency
- 56% ▼ -1.00%
- Median HH income
- $58,048
- Composite
- 46.73/100
- National rank
- #5240
- State rank
- #125 of 291 in WA
Livability — Auburn
- Score
- 81/100
- State rank
- #75
- US rank
- #1371
Category grades
Schools grade is shown separately in the Schools card above.
Census & demographics
- Census place
- Auburn, WA
- County
- King County · 2,251,916 people
- City population
- 74,969
- Metro
- Seattle-Tacoma-Bellevue, WA
- Population (ZIP)
- 50,224
- Household income
- $122,300
- Rent vs Own
- Severe rent burden
- 1041.0
Population outlook (King County) Hauer SSP2
- Today (2025)
- 2,576,485 people
- By 2030
- 2,803,316 · +8.8%
- By 2040
- 3,255,921 · +26.4%
- By 2050
- 3,706,444 · +43.9%
- By 2075
- 4,746,063 · +84.2%
- By 2100
- 5,407,730 · +109.9%
Race, ethnicity, and origin ACS 2023
- Neighborhood character
- Diverse neighborhood (Simpson 0.66)
- Race & ethnicity
- White 54% Hispanic / Latino 15% Asian 14% Two or more races 13% Native American 4% Black 3% Pacific Islander 2%
- Hispanic origin (detail)
- Mexican 12%
- Common ancestry
- Portuguese 4% Italian 3% Subsaharan African 3%
- Foreign-born
- 20% · Canada, South Korea, Vietnam
- Languages at home
- 73% English-only · Spanish 9% Russian/Polish/Slavic 4% Other Indo-European 3%
Political lean MEDSL · King
- 2024 margin
- Solid D (+51.7) · D 74.2% · R 22.5% · Other 3.4%
- 2008→2024 swing
- +9.6pp toward D · 2008: 42.1pp · 2024: 51.7pp
- All cycles
- 2024: D+51.7 2020: D+52.7 2016: D+50.4 2012: D+39.9 2008: D+42.1
Not yet ingested
- Civics
- —
Market trends
- HPI YoY
- ▲ 49.75%
- Current HPI
- 1554.06
- Rent YoY
- ▼ -0.46%
- Metro
- Seattle-Tacoma-Bellevue, WA
- State GDP YoY
- ▲ 4.65%
- F500 in state
- 22
Industry mix (Fortune 500 HQ in WA)
| Industry | F500 HQs | Revenue |
|---|---|---|
| Retail | 2 | $269B |
|
||
| Technology / Retail | 1 | $638B |
|
||
| Technology | 1 | $245B |
|
||
| Telecommunications | 1 | $38B |
|
||
| Food / Beverage | 1 | $36B |
|
||
| Automotive / Trucks | 1 | $34B |
|
||
Price history
-10.5% since first listed3 events — show timeline
- 2026-05-22 Relisted — NWMLS as Distributed by MLS Grid
- 2026-02-24 Price Changed $85,000 NWMLS as Distributed by MLS Grid
- 2026-02-04 Listed $95,000 NWMLS as Distributed by MLS Grid
Cash-flow waterfall
monthlySold comps — $/sqft
last 12 mo · ≤1 miLoading sold comps…