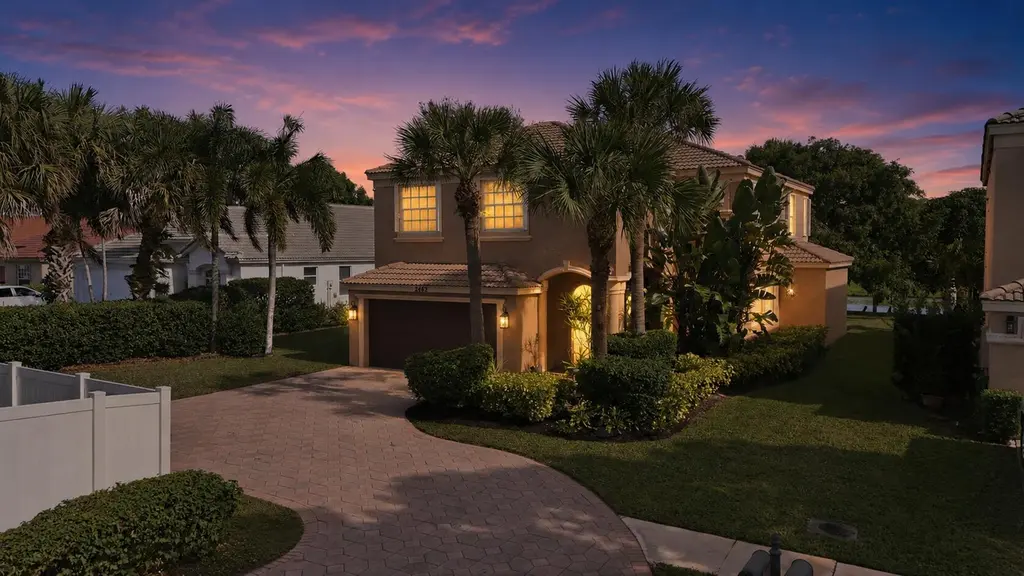
2462 Westmont Pl · Royal Palm Beach, FL
Flood risk 1/10 · Minimal
- FEMA flood zone
- X (unshaded)
- Chance of flooding over 30 yrs
- 0.0%
- Est. flood insurance / yr
- $507 – $1,088
Fire risk 3/10 · Minor
- Est. fire insurance / yr
- $947 – $1,759
Heat risk 10/10 · Severe
- Hot days now (above 107°F)
- 7 days/yr
- Hot days in 30 yrs
- 26 days/yr
Wind risk 10/10 · Severe
- Chance of severe wind over 30 yrs
- 99.0%
Air-quality risk 2/10 · Minimal
- Unhealthy air days now
- 0 days/yr
- Unhealthy air days in 30 yrs
- 1 days/yr
Risk factors via First Street. Map © Google.
Why this score? — see what drove the D+ grade
The composite is a weighted blend of 9 inputs, each scored 0–100. Each bar is that input's sub-score; the figure is the points it added to the 100-point composite (weight × sub-score).
- ARV discount +15.0/15.0
- Appreciation +10.0/10.0
- Cash flow +7.2/30.0
- Schools +4.3/10.0
- Livability +4.0/5.0
- Rent growth +2.7/5.0
- Condition / age +2.5/5.0
- 1% rule +1.8/10.0
- DSCR +1.4/10.0
$650,000
🖨 Deal sheet (PDF) 📄 Offer letter ✓ Due diligence
Listing remarks
Set at the end of a quiet street on an oversized, pool-sized lot, this home offers privacy, space, and a true South Florida waterfront lifestyle. Inside, the layout is clean and functional with formal living and dining rooms plus a spacious family room built for both everyday living and entertaining. Crown molding, neutral flooring, and strong natural light give the home a polished, move-in-ready feel throughout. The updated kitchen is the centerpiece, featuring white cabinetry, granite countertops, a large island with seating, recessed lighting, built-in desk space, brand-new stainless-steel appliances, and a bright breakfast area overlooking the backyard. The open layout keeps everything
Key facts
- 0.26 acre lot
- 2 garage spots
- Community pool
Property features AI
Finance
- Financial info: Pets allowed with restrictions (breed restrictions and number limit)
- HOA & community: Community association (Ashford; also listed as Madison Green); HOA fee billed quarterly (listed amount $249); HOA covers common areas; Community amenities include pool, clubhouse, fitness center, basketball court, tennis courts, sidewalks, community room, management and on-site manager
Exterior
- Parking: Attached 2-car garage; Two additional open parking spaces (4 parking spaces total); Two covered parking spaces
- Security: Gated community (no guard)
- Utilities: Public water; Public sewer; Cable connected; Sewer available; Water available
- Home design: Single-family residence; Two-story home; Resale property; Faces west; Built by Minto Communities (Berkeley 5 Grande model)
- Construction: CBS construction; Spanish tile roof
- Exterior features: Covered patio; Patio; Room for pool; Lake access (waterfront)
Interior
- Kitchen: Dishwasher; Electric range; Microwave; Refrigerator; Electric water heater
- Bedrooms: No main-level bedrooms noted
- Flooring: Carpet; Tile
- Bathrooms: Two full bathrooms and one half bathroom (three total); One bathroom on the main level
- Heating & cooling: Central heating; Central air conditioning
- Interior features: Walk-in closets; Sliding windows
- Laundry & utility: Inside laundry room
Neighborhood map
What this means for you Summary
Snapshot
- This is a 5-bed/2.5-bath single-family listed at $650k.
Deal economics
- At list price, monthly cash flow is $-889 ($-11k/yr) — negative.
- To cash-flow at today's rent, offer at most $493k (24.2% below list).
- To meet the 1% rule (rent ≥ 1% of price), the offer needs to be $439k (32.4% below list).
- Recommended offer: $439k (32.4% below list) — sets the bar for 1% rule.
Location & tenants
- Location reads 79/100 on livability (#135 in FL, #2,039 nationally) — a middle-class / working-renter tenant base. Strengths: employment A+, housing A+, health & safety A+; Watch: cost of living C-, amenities F, commute F.
- Palm Beach (suburban): math 46% / reading 53% proficiency, ranked #34 of 73 in FL (top 47%) — families likely to look elsewhere, expect single-tenant / working-renter base with shorter leases.
- Zoned schools: Royal Palm Beach Elementary School (math 58% / reading 62%, grade B-, #680 of 2,144 statewide, top 32%, 662 students, 40% FRL); Crestwood Community Middle (math 49% / reading 52%, grade C, #246 of 571 statewide, top 44%, 724 students, 50% FRL); Royal Palm Beach High School (math 22% / reading 38%, grade F, #441 of 667 statewide, top 67%, 2,343 students, 57% FRL) — zoned schools at 49% FRL track the district average.
- Market conditions: Rents flat; 583 active listings in the ZIP; 10 comparable units currently listed for rent nearby; rentals at typical pace (median 22d on market — plan ~3-4 weeks tenant-placement turnaround); solid renter incomes; 3,974 units permitted in Palm Beach County in 2024 (1,012 in 5+ unit buildings).
- At $4,394/mo this rent would consume 57% of the median local household income ($93k/yr) (locally 1870% of renters already pay >50% of income on rent) — very limited rent-growth headroom before tenants either downsize or default.
Forward outlook
- In year one you build about $69k of equity ($4k loan paydown + $65k appreciation (10.0% local appreciation)).
- Palm Beach County population projected at +30% by 2050 — long-run rental-demand tailwind backs the buy-and-hold thesis.
- By year 2, paydown + projected appreciation supports a ~$112k cash-out refi (75% LTV) — recoverable capital for the next deal without selling this one.
Negotiation context
- It's been on market 80 days — a 6% lower offer ($611k) is reasonable based on typical stale-listing flexibility.
- 4 sale attempts with the ask held roughly flat each time — persistent listings suggest the price (not the market) is what's stuck; bring a comps-based counter.
Risks & watch-outs
- Climate carrying-cost: severe wind risk, 99% chance of damaging wind over 30y; extreme-heat days projected 7→26/yr by 2055 (HVAC capex compounding) — expect insurance premiums to compound above CPI over the hold.
Questions for the listing agent
- What do current leases actually rent for vs. the listed asking? Can we see a recent rent roll and the last 12 months of T-12 income?
- It's been on market 80 days. Have you received any prior offers? Is the seller open to a 32% concession, seller financing, or rate buy-down credit?
- What does the HOA fee cover, when was the last increase, and are there any pending special assessments or reserve-fund shortfalls?
- Why hasn't it sold? Are there any deal-killer items the seller is aware of (foundation, flood, title, zoning, code violations)?
- Is there a deadline driving the sale (1031 exchange, divorce, estate, relocation)? That informs how much negotiation room exists.
- Schools are B-rated — typically a magnet for longer-tenancy family renters. What's the average tenant stay here, and is there a school-zone premium baked into asking?
- The area grade is low — what's the realistic commute time and amenity access for the typical tenant pool here? Any planned neighborhood developments (good or bad) we should know about?
- What's the average days-on-market for RENTAL listings here right now (not sales)? A rising rental-DOM trend means longer vacancies and softer asking-rent achievability than the comps imply.
- What's the recent tenant-quality profile in this submarket — average credit score on applications, eviction rate, late-payment / NSF rate, and stable-employment percentage? A property-management company in the area should have these aggregated.
- How much new for-sale + rental construction is in the pipeline within 1–3 miles? Heavy new supply typically softens prices + rents 12–24 months out; constrained supply supports both.
Investment metrics
- 1% rule
- 0.68% ✗
- Cap rate
- 4.65%
- Cash-on-cash
- -5.86%
- DSCR
- 0.74
- GRM
- 12.3
CMA / ARV
- ARV (on-the-fly)
- $855,624
- Comps found
- 1
Show comp detail 1 sale within ~0.75 mi
| Address | Dist | Beds/Ba | Sqft | Sold | Price | $/sf | Match |
|---|---|---|---|---|---|---|---|
| 1114 Brinely Pl | 0.57mi | 5/3.0 | 2,385 (-14%) | 3mo | $735,000 | $308 | 46 |
Match score weights: distance 35% · size 25% · config 20% · recency 20%. Top-matched comps best support the ARV.
Projected returns pro-forma
10.0% appreciation · 0.85% rent growth · sell at horizon
- IRR
- 19.6%
- Equity multiple
- 2.58×
- Total profit
- $288,054
- Equity at exit
- $585,571
- IRR
- 17.6%
- Equity multiple
- 5.81×
- Total profit
- $875,503
- Equity at exit
- $1,262,807
Cash invested: $182,000 (down + closing). Projections, not guarantees.
Landlord ↔ Tenant lean methodology
- Overall (STATE)
- 87 Strongly Landlord-Friendly
- State Florida
- 87 Strongly Landlord-Friendly · R+3
- County
- — inherits STATE
- City
- — inherits STATE
ZIP-level market 33411
- Home prices YoY
- 1.9%
- Rents YoY
- 0.8%
- Active inventory
- 583
- Price-to-rent
- 12.3×
Monthly cashflow live
- Estimated rent
- $4,394 high interval (Pro) →
- Mortgage (P&I)
- −$3,409
- Tax from tax record
- −$425 /mo · $5,103/yr
- Insurance
- −$271
- HOA
- −$256
- Vacancy / Maint / Mgmt
- −$923
- Net cashflow
- $-889
Break-even live
Sensitivity live
| Price | -10% $-521 | -5% $-705 | +0% $-889 | +5% $-1,073 | +10% $-1,257 |
|---|---|---|---|---|---|
| Rent | -10% $-1,236 | -5% $-1,063 | +0% $-889 | +5% $-716 | +10% $-542 |
| Rate | -1.0pp $-562 | -0.5pp $-724 | base $-889 | +0.5pp $-1,058 | +1.0pp $-1,229 |
UW: 25.0% down · 7.5% · 30yr · 1.5% tax · 5.0% vac · 8.0% maint · 8.0% mgmt
Financing live
Cash to close
- Down payment
- $162,500
- Closing costs
- $19,500
- Reserves months
- —
- Total cash needed
- —
Loan-product check · same deal, 3 products live
Conventional
25% down · 7.5% · 30yr
- Down + closing
- —
- Monthly P&I
- —
- Monthly cashflow
- —
- DSCR
- —
- Eligible?
- —
Personal DTI + credit; lowest rate.
DSCR
20% down · 8.5% · 30yr
- Down + closing
- —
- Monthly P&I
- —
- Monthly cashflow
- —
- DSCR
- —
- Eligible?
- —
No personal income docs; deal must DSCR.
Hard money
10% down · 12.0% · 12mo
- Down + closing
- —
- Monthly P&I
- —
- Monthly cashflow
- —
- DSCR
- —
- Eligible?
- —
Short-term bridge; refi at stabilization.
Rent comps 10 comps
| Address | Beds | Baths | Sqft | Rent | $/sqft | DOM | Units | Dist |
|---|---|---|---|---|---|---|---|---|
| 2418 Westmont Dr Royal Palm Beach, FL | 4.0 | 3.0 | 2361 | $4,950 | $2.10 | 5d | 1 | 0.13mi |
| 2064 Reston Cir Royal Palm Beach, FL | 4.0 | 2.5 | 2857 | $3,990 | $1.40 | 26d | 1 | 0.57mi |
| 2064 Reston Cir Royal Palm Beach, FL | 4.0 | 2.5 | 2857 | $3,990 | $1.40 | 6d | 1 | 0.57mi |
| 147 Alcazar St Royal Palm Beach, FL | 4.0 | 3.0 | 2182 | $3,950 | $1.81 | 7d | 1 | 0.76mi |
| 1724 Annandale Cir Royal Palm Beach, FL | 6.0 | 4.0 | 3974 | $6,300 | $1.59 | 1d | 1 | 0.81mi |
| 147 Sunflower Cir Royal Palm Beach, FL | 4.0 | 2.0 | 2000 | $4,100 | $2.05 | 4d | 1 | 0.86mi |
| 147 Sunflower Cir Royal Palm Beach, FL | 4.0 | 2.0 | 2000 | $4,300 | $2.15 | 21d | 1 | 0.86mi |
| 1104 Oakwater Dr Royal Palm Beach, FL | 4.0 | 2.5 | 2003 | $3,896 | $1.95 | 24d | 1 | 1.05mi |
| 1104 Oakwater Dr Royal Palm Beach, FL | 4.0 | 2.5 | 2003 | $3,896 | $1.95 | 26d | 1 | 1.05mi |
| 104 Oxford Ct Royal Palm Beach, FL | 4.0 | 3.0 | 2133 | $4,500 | $2.11 | 26d | 1 | 1.23mi |
HOA detail
- Monthly dues
- $256 · $3,072/yr
- Likely covers
- waterpool
Listing history 22 events
-
2026-06-21days on market $650,000 Active 80 DOM
-
2026-06-18days on market $650,000 Active 77 DOM
-
2026-06-17days on market $650,000 Active 76 DOM
-
2026-06-16pricedays on market $650,000 Active 75 DOM
-
2026-06-15days on market $668,900 Active 74 DOM
-
2026-06-13days on market $668,900 Active 72 DOM
-
2026-06-09days on market $668,900 Active 68 DOM
-
2026-06-08days on market $668,900 Active 67 DOM
-
2026-06-07days on market $668,900 Active 66 DOM
-
2026-06-04days on market $668,900 Active 63 DOM
-
2026-06-03days on market $668,900 Active 62 DOM
-
2026-06-02days on market $668,900 Active 61 DOM
-
2026-06-01days on market $668,900 Active 60 DOM
-
2026-05-31days on market $668,900 Active 59 DOM
-
2026-05-08status Active
-
2026-05-04historical Active Under Contract
-
2026-04-02$673,900 Active
-
2026-01-13status Active
-
2025-12-18historical Active Under Contract
-
2025-12-18historical
-
2025-12-13$650,000 Active
-
2025-12-06historical
ⓘ Source: listings_history table (triggers on properties + properties_extension) + one-shot
backfill from property_details.listing_events for pre-trigger history.
Tax reassessment forecast FL · Resets to sale price
- Current annual tax
- $5,103 · $425/mo
- Projected year-2 tax
- $5,395 · $450/mo
- Expected delta
- +$292/yr (+$24/mo · 5.7%)
ⓘ Screening estimate from a state-policy table — verify with the county assessor before closing.
Climate risk First Street
- Flood 1/10 Low FEMA zone X (unshaded) · 0% chance over 30 yrs
- Wildfire 3/10 Moderate
- Heat 10/10 Extreme 7 d/yr ≥107°F today · 26 d/yr by 30 yrs out
- Wind 10/10 Extreme 99% chance of damaging wind over 30 yrs
- Air quality 2/10 Low 0 unhealthy d/yr today · 1 by 30 yrs out
Nearby sold comps map
Loading sold comps map…
Walkable amenities ~0.75 mi
Loading nearby amenities…
Taxation est. · year 1
- Rental income
- $52,732
- − Mortgage interest
- −$36,410
- − Property taxes
- −$5,103
- − Insurance
- −$3,250
- − Repairs & maintenance
- −$4,219
- − Management
- −$4,219
- − HOA
- −$3,072
- − Depreciation
- −$18,909
- Taxable loss
- −$22,449
- Est. tax savings @ 24.0%
- +$5,388
- After-tax cash flow
- $-5,282/yr
For passive investors: Depreciation is non-cash, so a rental often shows a tax loss while cash-flowing — sheltering income. Rental losses are passive: they offset passive income freely, and up to $25,000/yr can offset ordinary (W-2) income if you actively participate and your MAGI is under $100k (phasing out to $0 by $150k); unused losses carry forward. On sale, claimed depreciation is recaptured at up to 25%, and gains may owe capital-gains tax (a 1031 exchange can defer both). Figures are a year-1 estimate at your 24.0% rate — not tax advice; consult a CPA.
Schools (NCES district)
- District
- Palm Beach
- NCES district ID
- 1201500
- Math proficiency
- 46% ▼ -16.00%
- Reading proficiency
- 53% ▼ -4.00%
- Median HH income
- $53,943
- Composite
- 42.72/100
- National rank
- #3160
- State rank
- #34 of 73 in FL
Livability — Royal Palm Beach
- Score
- 79/100
- State rank
- #135
- US rank
- #2039
Category grades
Schools grade is shown separately in the Schools card above.
Census & demographics
- Census place
- Royal Palm Beach, FL
- County
- Palm Beach County · 1,438,312 people
- City population
- 75,299
- Metro
- Miami-Fort Lauderdale-Pompano Beach, FL
- Population (ZIP)
- 76,863
- Household income
- $92,591
- Rent vs Own
- Severe rent burden
- 1870.0
Population outlook (Palm Beach County) Hauer SSP2
- Today (2025)
- 1,637,487 people
- By 2030
- 1,743,255 · +6.5%
- By 2040
- 1,948,712 · +19.0%
- By 2050
- 2,132,979 · +30.3%
- By 2075
- 2,530,027 · +54.5%
- By 2100
- 2,706,979 · +65.3%
Race, ethnicity, and origin ACS 2023
- Neighborhood character
- Diverse neighborhood (Simpson 0.70)
- Race & ethnicity
- White 44% Hispanic / Latino 24% Black 23% Two or more races 16% Asian 5%
- Hispanic origin (detail)
- Mexican 2% Puerto Rican 5% Cuban 4% Dominican 2%
- Common ancestry
- Hispanic 6% Romanian 2% Italian 1%
- Foreign-born
- 26% · Canada, Jamaica, China
- Languages at home
- 73% English-only · Spanish 17% French/Haitian/Cajun 4% Other Indo-European 2%
Political lean MEDSL · Palm Beach
- 2024 margin
- Toss-up / Even · D 50.0% · R 49.2%
- 2008→2024 swing
- -22.1pp toward R · 2008: 22.9pp · 2024: 0.8pp
- All cycles
- 2024: D+0.8 2020: D+12.8 2016: D+15.3 2012: D+17.0 2008: D+22.9
Not yet ingested
- Civics
- —
Market trends
- HPI YoY
- ▲ 17.04%
- Current HPI
- 903.78
- Rent YoY
- ▲ 0.85%
- Metro
- Miami-Fort Lauderdale-Pompano Beach, FL
- State GDP YoY
- ▲ 3.28%
- F500 in state
- 36
Industry mix (Fortune 500 HQ in FL)
| Industry | F500 HQs | Revenue |
|---|---|---|
| Industrial Technology | 2 | $29B |
|
||
| Insurance | 2 | $17B |
|
||
| Retail | 1 | $60B |
|
||
| Technology Distribution | 1 | $58B |
|
||
| Homebuilding | 1 | $35B |
|
||
| Technology Manufacturing | 1 | $35B |
|
||
Price history
+3.7% since first listed8 events — show timeline
- 2026-05-08 Relisted — Beaches MLS
- 2026-05-04 Contingent — Beaches MLS
- 2026-04-02 Listed $673,900 Beaches MLS
- 2026-01-13 Relisted — Beaches MLS
- 2025-12-18 Contingent — Beaches MLS
- 2025-12-18 Listing Removed — Beaches MLS
- 2025-12-13 Listed $650,000 Beaches MLS
- 2025-12-06 Coming Soon — Beaches MLS
Property tax history
+0.7%/yrLatest (2025): $5,103 · +3.0% YoY. Source: county tax records.
Cash-flow waterfall
monthlySold comps — $/sqft
last 12 mo · ≤1 miLoading sold comps…