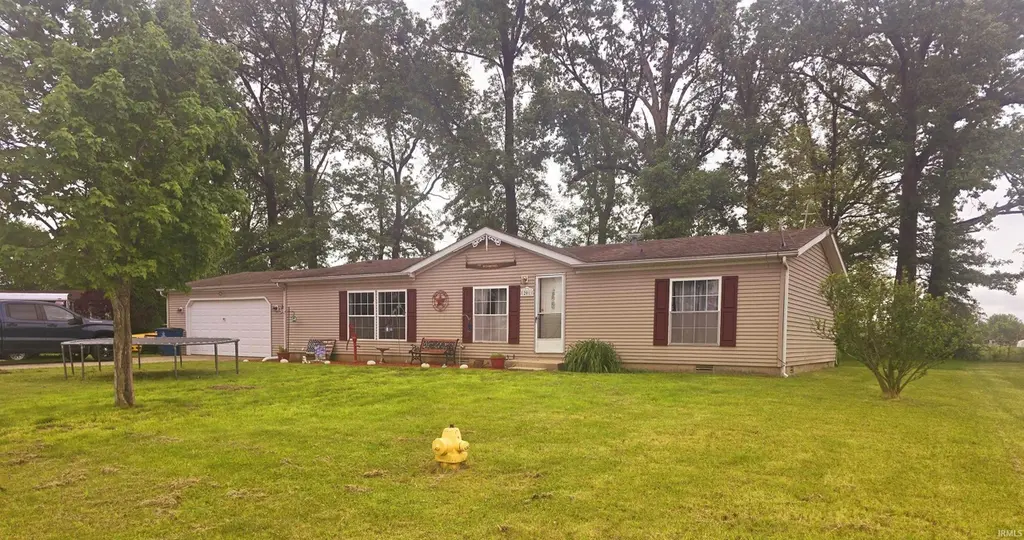
201 Cypress Ct · Marion, IN
Flood risk 1/10 · Minimal
- FEMA flood zone
- X (unshaded)
- Chance of flooding over 30 yrs
- 0.0%
- Est. flood insurance / yr
- $507 – $1,088
Fire risk 3/10 · Minor
- Est. fire insurance / yr
- $717 – $1,331
Heat risk 3/10 · Minor
- Hot days now (above 100°F)
- 7 days/yr
- Hot days in 30 yrs
- 18 days/yr
Wind risk 2/10 · Minimal
- Chance of severe wind over 30 yrs
- 1.0%
Air-quality risk 3/10 · Minor
- Unhealthy air days now
- 2 days/yr
- Unhealthy air days in 30 yrs
- 3 days/yr
Risk factors via First Street. Map © Google.
Why this score? — see what drove the F grade
The composite is a weighted blend of 9 inputs, each scored 0–100. Each bar is that input's sub-score; the figure is the points it added to the 100-point composite (weight × sub-score).
- Cash flow +9.7/30.0
- ARV discount +7.5/15.0
- Schools +3.8/10.0
- Livability +3.2/5.0
- DSCR +2.7/10.0
- Rent growth +2.5/5.0
- Condition / age +2.5/5.0
- 1% rule +2.0/10.0
- Appreciation +0.0/10.0
$155,000
🖨 Deal sheet (PDF) 📄 Offer letter ✓ Due diligence
Listing remarks MLS
This 3 bedroom two bath home sits in a quiet rural neighborhood just minutes from I69. This home features an open floor plan, attached 2 car garage, master suite with garden tub, island in the kitchen, and city utilities.
Key facts
- 0.45 acre lot
- 2 garage spots
- Built 2000
Property features AI
Finance
- Other: Lot dimensions approximately 123 x 160 (0.452 acre); Located in the Meadows East subdivision
- Financial info: No investor or income/expense details provided
- HOA & community: No association amenities
Exterior
- Parking: Attached garage with 2 spaces; Garage with concrete driveway and garage door opener; Off-street parking
- Security: Smoke detectors
- Utilities: Public water; Public sewer; Electric service
- Home design: Single-story manufactured home; Entry facing information not provided
- Construction: Vinyl siding; Asphalt roof; Block foundation; Built as a manufactured home
- Exterior features: Chain link fencing; Shed on the property; Cul-de-sac lot in a wooded setting; Paved public road access
Interior
- Kitchen: Dishwasher; Refrigerator; Exhaust fan; Electric oven; Electric range
- Bedrooms: Total of 6 rooms (bedrooms included)
- Flooring: Vinyl flooring
- Bathrooms: 2 full bathrooms
- Heating & cooling: Electric heat pump; Central air conditioning
- Interior features: Kitchen island; One fireplace
- Laundry & utility: Main-level laundry with electric dryer hookup; Electric water heater
Neighborhood map
What this means for you Summary
Snapshot
- This is a 2-bed/2.0-bath manufactured listed at $155k.
Deal economics
- At list price, monthly cash flow is $-102 ($-1k/yr) — negative.
- To cash-flow at today's rent, offer at most $137k (11.6% below list).
- To meet the 1% rule (rent ≥ 1% of price), the offer needs to be $108k (30.2% below list).
- Recommended offer: $108k (30.2% below list) — sets the bar for 1% rule.
- Cap rate 5.5% vs local median 8.2% in Marion — below-typical yield; the buyer is paying a premium for something (appreciation thesis, condition, location) that the cap rate doesn't capture.
Location & tenants
- Location reads 65/100 on livability (#337 in IN) — a middle-class / working-renter tenant base. Strengths: crime A+, cost of living A+, housing A+; Watch: amenities F, commute F, employment F.
- Eastbrook Community School Corporation (rural): math 42% / reading 46% proficiency, ranked #98 of 301 in IN (top 33%) — families likely to look elsewhere, expect single-tenant / working-renter base with shorter leases.
- Zoned schools: Eastbrook North Elementary (math 43% / reading 34%, grade F, #535 of 994 statewide, top 54%, 307 students, 52% FRL); Eastbrook Middle School (math 30% / reading 45%, grade F, #146 of 330 statewide, top 46%, 399 students, 48% FRL); Eastbrook High School (math 52% / reading 72%, grade B-, #41 of 369 statewide, top 12%, 509 students, 38% FRL).
- Market conditions: 114 active listings in the ZIP; 52 units permitted in Grant County in 2024 (8 in 5+ unit buildings).
Forward outlook
- Local home prices are declining (-3.0%/yr); year-one equity from $1k of loan paydown is wiped out by about $5k of value loss. Plan a longer hold.
- Grant County population projected at -18% by 2050 — secular population decline; favor cash flow + early exit over multi-decade hold.
Negotiation context
- It's been on market 20 days — a 2% lower offer ($153k) is reasonable based on typical stale-listing flexibility.
- 3 sale attempts since 9y ago; this cycle's ask is 72% above the opening price — seller raised mid-cycle; expect resistance to lowballs.
- Current owner paid $85k; list at $155k implies a 82% gain — meaningful room to come down on a strong offer.
Questions for the listing agent
- What do current leases actually rent for vs. the listed asking? Can we see a recent rent roll and the last 12 months of T-12 income?
- Is there a deadline driving the sale (1031 exchange, divorce, estate, relocation)? That informs how much negotiation room exists.
- Schools are F-rated, which usually means shorter tenancies and higher turnover. Who's the typical renter profile here, and what's been the actual vacancy rate?
- The area grade is low — what's the realistic commute time and amenity access for the typical tenant pool here? Any planned neighborhood developments (good or bad) we should know about?
- What's the average days-on-market for RENTAL listings here right now (not sales)? A rising rental-DOM trend means longer vacancies and softer asking-rent achievability than the comps imply.
- What's the recent tenant-quality profile in this submarket — average credit score on applications, eviction rate, late-payment / NSF rate, and stable-employment percentage? A property-management company in the area should have these aggregated.
- How much new for-sale + rental construction is in the pipeline within 1–3 miles? Heavy new supply typically softens prices + rents 12–24 months out; constrained supply supports both.
Investment metrics
- 1% rule
- 0.70% ✗
- Cap rate
- 5.51%
- Cash-on-cash
- -2.81%
- DSCR
- 0.87
- GRM
- 11.9
CMA / ARV
- ARV (on-the-fly)
- $47,736
- Comps found
- 1
Show comp detail 1 sale within ~0.75 mi
| Address | Dist | Beds/Ba | Sqft | Sold | Price | $/sf | Match |
|---|---|---|---|---|---|---|---|
| 156 Meadows East Pkwy | 0.08mi | 3/2.0 (+1) | 1,456 (+4%) | 10mo | $50,000 | $34 | 77 |
Match score weights: distance 35% · size 25% · config 20% · recency 20%. Top-matched comps best support the ARV.
Projected returns pro-forma
-3.0% appreciation · 3.0% rent growth · sell at horizon
- IRR
- -21.0%
- Equity multiple
- 0.27×
- Total profit
- $-31,646
- Equity at exit
- $23,111
- IRR
- -14.6%
- Equity multiple
- 0.17×
- Total profit
- $-36,114
- Equity at exit
- $13,402
Cash invested: $43,400 (down + closing). Projections, not guarantees.
Landlord ↔ Tenant lean methodology
- Overall (STATE)
- 90 Strongly Landlord-Friendly
- State Indiana
- 90 Strongly Landlord-Friendly · R+11
- County
- — inherits STATE
- City
- — inherits STATE
ZIP-level market 46953
- Home prices YoY
- -23.4%
- Active inventory
- 114
- Price-to-rent
- 11.9×
Monthly cashflow live
- Estimated rent
- $1,082 medium interval (Pro) →
- Mortgage (P&I)
- −$813
- Tax from tax record
- −$79 /mo · $952/yr
- Insurance
- −$65
- HOA
- −$0
- Vacancy / Maint / Mgmt
- −$227
- Net cashflow
- $-102
Break-even live
Sensitivity live
| Price | -10% $-14 | -5% $-58 | +0% $-102 | +5% $-146 | +10% $-189 |
|---|---|---|---|---|---|
| Rent | -10% $-187 | -5% $-144 | +0% $-102 | +5% $-59 | +10% $-16 |
| Rate | -1.0pp $-24 | -0.5pp $-62 | base $-102 | +0.5pp $-142 | +1.0pp $-183 |
UW: 25.0% down · 7.5% · 30yr · 1.5% tax · 5.0% vac · 8.0% maint · 8.0% mgmt
Financing live
Cash to close
- Down payment
- $38,750
- Closing costs
- $4,650
- Reserves months
- —
- Total cash needed
- —
Loan-product check · same deal, 3 products live
Conventional
25% down · 7.5% · 30yr
- Down + closing
- —
- Monthly P&I
- —
- Monthly cashflow
- —
- DSCR
- —
- Eligible?
- —
Personal DTI + credit; lowest rate.
DSCR
20% down · 8.5% · 30yr
- Down + closing
- —
- Monthly P&I
- —
- Monthly cashflow
- —
- DSCR
- —
- Eligible?
- —
No personal income docs; deal must DSCR.
Hard money
10% down · 12.0% · 12mo
- Down + closing
- —
- Monthly P&I
- —
- Monthly cashflow
- —
- DSCR
- —
- Eligible?
- —
Short-term bridge; refi at stabilization.
Listing history 22 events
-
2026-06-21days on market $155,000 Active 20 DOM
-
2026-06-19days on market $155,000 Active 18 DOM
-
2026-06-18days on market $155,000 Active 17 DOM
-
2026-06-17days on market $155,000 Active 16 DOM
-
2026-06-16days on market $155,000 Active 15 DOM
-
2026-06-15days on market $155,000 Active 14 DOM
-
2026-06-14days on market $155,000 Active 12 DOM
-
2026-06-12days on market $155,000 Active 11 DOM
-
2026-06-09days on market $155,000 Active 8 DOM
-
2026-06-08days on market $155,000 Active 7 DOM
-
2026-06-07days on market $155,000 Active 6 DOM
-
2026-06-05days on market $155,000 Active 3 DOM
-
2026-06-03days on market $155,000 Active 2 DOM
-
2026-06-01statusdays on market $155,000 Active 1 DOM
-
2026-05-31days on market $155,000 Coming Soon 5 DOM
-
2026-05-30days on market $155,000 Coming Soon 4 DOM
-
2026-05-26historical $155,000
-
2019-11-27soldstatus $85,000 222-char remark
Show marketing remark (222 chars)
This 3 bedroom two bath home sits in a quiet rural neighborhood just minutes from I69. This home features an open floor plan, attached 2 car garage, master suite with garden tub, island in the kitchen, and city utilities.
-
2019-08-16$89,900 222-char remark
Show marketing remark (222 chars)
This 3 bedroom two bath home sits in a quiet rural neighborhood just minutes from I69. This home features an open floor plan, attached 2 car garage, master suite with garden tub, island in the kitchen, and city utilities.
-
2018-06-05$80,000
-
2017-10-24soldstatus $85,000
-
2017-07-27$85,000
ⓘ Source: listings_history table (triggers on properties + properties_extension) + one-shot
backfill from property_details.listing_events for pre-trigger history.
Tax reassessment forecast IN · Partial reset (capped growth)
- Current annual tax
- $952 · $79/mo
- Projected year-2 tax
- $1,135 · $95/mo
- Expected delta
- +$183/yr (+$15/mo · 19.2%)
ⓘ Screening estimate from a state-policy table — verify with the county assessor before closing.
Climate risk First Street
- Flood 1/10 Low FEMA zone X (unshaded) · 0% chance over 30 yrs
- Wildfire 3/10 Moderate
- Heat 3/10 Moderate 7 d/yr ≥100°F today · 18 d/yr by 30 yrs out
- Wind 2/10 Low 100% chance of damaging wind over 30 yrs
- Air quality 3/10 Moderate 2 unhealthy d/yr today · 3 by 30 yrs out
Nearby sold comps map
Loading sold comps map…
Walkable amenities ~0.75 mi
Loading nearby amenities…
Taxation est. · year 1
- Rental income
- $12,989
- − Mortgage interest
- −$8,682
- − Property taxes
- −$952
- − Insurance
- −$775
- − Repairs & maintenance
- −$1,039
- − Management
- −$1,039
- − Depreciation
- −$4,509
- Taxable loss
- −$4,008
- Est. tax savings @ 24.0%
- +$962
- After-tax cash flow
- $-258/yr
For passive investors: Depreciation is non-cash, so a rental often shows a tax loss while cash-flowing — sheltering income. Rental losses are passive: they offset passive income freely, and up to $25,000/yr can offset ordinary (W-2) income if you actively participate and your MAGI is under $100k (phasing out to $0 by $150k); unused losses carry forward. On sale, claimed depreciation is recaptured at up to 25%, and gains may owe capital-gains tax (a 1031 exchange can defer both). Figures are a year-1 estimate at your 24.0% rate — not tax advice; consult a CPA.
Schools (NCES district)
- District
- Eastbrook Community School Corporation
- NCES district ID
- 1803030
- Math proficiency
- 42% ▬ 0.00%
- Reading proficiency
- 46% ▼ -1.00%
- Median HH income
- $55,030
- Composite
- 38.28/100
- National rank
- #4234
- State rank
- #98 of 301 in IN
Livability — Marion
- Score
- 65/100
- State rank
- #337
- US rank
- #13006
Category grades
Schools grade is shown separately in the Schools card above.
Census & demographics
- Census place
- Marion, IN
- County
- Grant County · 41,561 people
- City population
- 41,561
- Metro
- Marion, IN
- Population (ZIP)
- 23,372
- Household income
- $46,288
- Rent vs Own
- Severe rent burden
- 597.0
Population outlook (Grant County) Hauer SSP2
- Today (2025)
- 64,394 people
- By 2030
- 62,145 · -3.5%
- By 2040
- 57,252 · -11.1%
- By 2050
- 52,968 · -17.7%
- By 2075
- 45,986 · -28.6%
- By 2100
- 39,400 · -38.8%
Race, ethnicity, and origin ACS 2023
- Neighborhood character
- Predominantly White (77%)
- Race & ethnicity
- White 77% Black 10% Two or more races 9% Hispanic / Latino 6%
- Hispanic origin (detail)
- Mexican 4%
- Common ancestry
- Italian 3% Iranian 1% Slovak 1%
- Foreign-born
- 2% · Canada
- Languages at home
- 96% English-only · Spanish 3%
Political lean MEDSL · Grant
- 2024 margin
- Solid R (+41.8) · D 28.2% · R 70.0% · Other 1.9%
- 2008→2024 swing
- -28.7pp toward R · 2008: -13.1pp · 2024: -41.8pp
- All cycles
- 2024: R+41.8 2020: R+38.8 2016: R+39.5 2012: R+22.0 2008: R+13.1
Not yet ingested
- Civics
- —
Market trends
- HPI YoY
- ▼ -52.47%
- Current HPI
- 171.7246
- Rent YoY
- —
- Metro
- Marion, IN
- State GDP YoY
- ▲ 2.90%
- F500 in state
- 18
Industry mix (Fortune 500 HQ in IN)
| Industry | F500 HQs | Revenue |
|---|---|---|
| Industrial Machinery | 2 | $37B |
|
||
| Healthcare | 1 | $177B |
|
||
| Pharmaceuticals | 1 | $45B |
|
||
| Metals / Steel | 1 | $18B |
|
||
| Agriculture | 1 | $17B |
|
||
| Packaging | 1 | $12B |
|
||
Price history
+82.4% since first listed6 events — show timeline
- 2026-05-26 Coming Soon $155,000 IRMLS
- 2019-11-27 Sold (MLS) $85,000 IRMLS
- 2019-08-16 Listed $89,900 IRMLS
- 2018-06-05 Listed $80,000 IRMLS
- 2017-10-24 Sold (MLS) $85,000 IRMLS
- 2017-07-27 Listed $85,000 IRMLS
Property tax history
+4.4%/yrLatest (2025): $952 · -18.2% YoY. Source: county tax records.
Cash-flow waterfall
monthlySold comps — $/sqft
last 12 mo · ≤1 miLoading sold comps…