4401 Jay Rd · Snowflake, AZ
Flood risk 1/10 · Minimal
- FEMA flood zone
- X (unshaded)
- Chance of flooding over 30 yrs
- 0.0%
- Est. flood insurance / yr
- $507 – $1,088
Fire risk 4/10 · Minor
- Est. fire insurance / yr
- $610 – $1,132
Heat risk 4/10 · Minor
- Hot days now (above 92°F)
- 7 days/yr
- Hot days in 30 yrs
- 18 days/yr
Wind risk 1/10 · Minimal
- Chance of severe wind over 30 yrs
- —
Air-quality risk 1/10 · Minimal
- Unhealthy air days now
- 0 days/yr
- Unhealthy air days in 30 yrs
- 0 days/yr
Risk factors via First Street. Map © Google.
Why this score? — see what drove the D- grade
The composite is a weighted blend of 9 inputs, each scored 0–100. Each bar is that input's sub-score; the figure is the points it added to the 100-point composite (weight × sub-score).
- Appreciation +10.0/10.0
- ARV discount +7.5/15.0
- Cash flow +6.7/30.0
- Schools +4.6/10.0
- Livability +3.5/5.0
- Rent growth +2.5/5.0
- Condition / age +2.5/5.0
- DSCR +0.9/10.0
- 1% rule +0.5/10.0
$250,000
🖨 Deal sheet 📄 Offer letter ✓ Due diligence
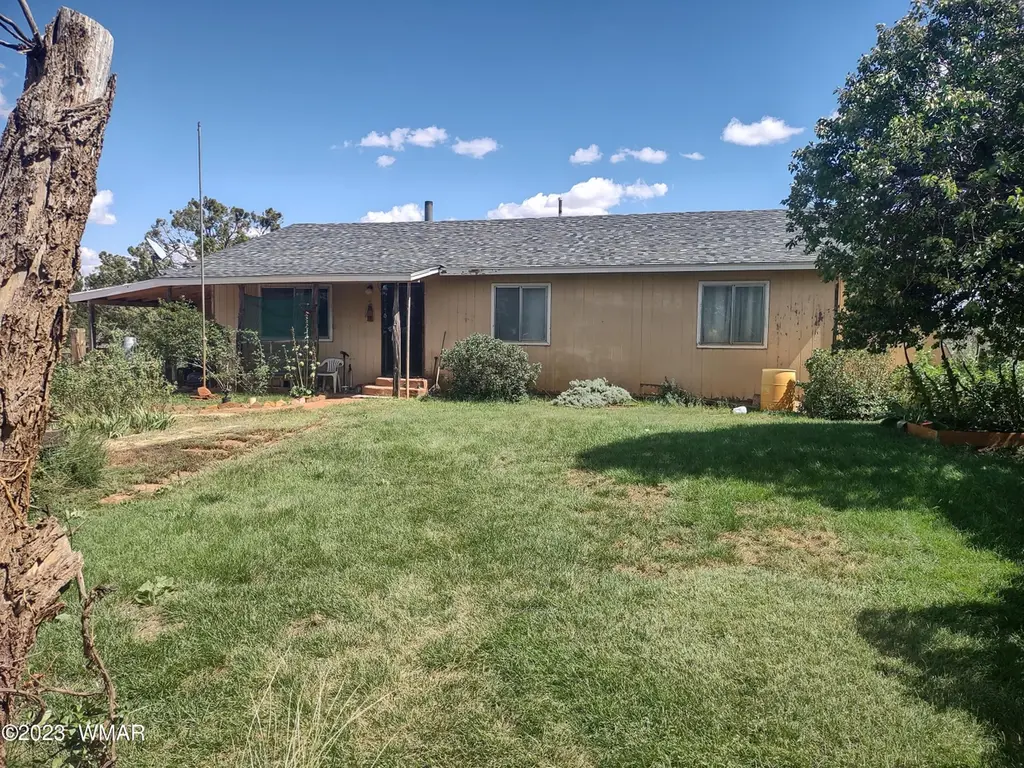
Listing remarks
This great home offers something for everyone. The 1500 square feet plus the 10+ acres allows room for everyone. The property is close to town and dirt roads access with all the privacy you desire. Power with a private well is a great blend of convenience. Acreage to plant your garden for additional self-sustained living. This home is priced to sell and a great way to build quick equity. Call today for showings.
Key facts
- Close to town
- Private well
- 10 acres
Tags
Property features AI
Finance
- Other: Approximately 10.55 acres; Zoned residential; Allows raising horses; No road maintenance; Trees on property; Property does not lease land
- HOA & community: No HOA
Exterior
- Parking: Has a garage; One attached carport
- Utilities: Septic tank; Private well (water available); APS electric service with individual meter; Propane with leased tank; Power available
- Home design: Site-built home; One story; Pitched shingle roof
- Construction: Wood frame construction
- Exterior features: Barn/stable; Additional outbuilding; Wire fence; Private-adjoining property
Interior
- Flooring: Carpet; Tile
- Bathrooms: Shower; Tub/shower combo
- Heating & cooling: Wood heating; Electric water heater
- Interior features: Woodstove fireplace; Carpet and tile flooring
- Laundry & utility: Utility room for laundry
Neighborhood map
What this means for you Summary
Snapshot
- This is a 3-bed/2.0-bath single-family listed at $250k.
Deal economics
- At list price, monthly cash flow is $-402 ($-5k/yr) — negative.
- To cash-flow at today's rent, offer at most $179k (28.4% below list).
- To meet the 1% rule (rent ≥ 1% of price), the offer needs to be $137k (45.0% below list).
- Recommended offer: $137k (45.0% below list) — sets the bar for 1% rule.
- Cap rate 4.4% vs local median 2.9% in Snowflake — top-decile yield for the area; either an underpriced asset or a hidden risk that comps aren't pricing in. Stress-test before assuming the spread holds.
Location & tenants
- Location reads 69/100 on livability (#46 in AZ) — a middle-class / working-renter tenant base. Strengths: cost of living A+, housing A+; Watch: employment C-, amenities F, commute F.
- Snowflake Unified District (4391) (town): math 55% / reading 53% proficiency, ranked #36 of 249 in AZ (top 14%) — acceptable for families but not a draw, mixed tenant base, ~2y average lease.
- Market conditions: 290 active listings in the ZIP; 485 units permitted in Navajo County in 2024 (11 in 5+ unit buildings).
Forward outlook
- In year one you build about $27k of equity ($2k loan paydown + $25k appreciation (10.0% local appreciation)).
- Navajo County population projected at -16% by 2050 — secular population decline; favor cash flow + early exit over multi-decade hold.
- By year 2, paydown + projected appreciation supports a ~$43k cash-out refi (75% LTV) — recoverable capital for the next deal without selling this one.
Negotiation context
- It's been on market 15 days — a 2% lower offer ($246k) is reasonable based on typical stale-listing flexibility.
- Current owner paid $90k; list at $250k implies a 178% gain — meaningful room to come down on a strong offer.
Questions for the listing agent
- What do current leases actually rent for vs. the listed asking? Can we see a recent rent roll and the last 12 months of T-12 income?
- Built in 1978 — when were the roof, HVAC, electrical panel, plumbing, and water heater last replaced?
- Is there a deadline driving the sale (1031 exchange, divorce, estate, relocation)? That informs how much negotiation room exists.
- The area grade is low — what's the realistic commute time and amenity access for the typical tenant pool here? Any planned neighborhood developments (good or bad) we should know about?
- What's the average days-on-market for RENTAL listings here right now (not sales)? A rising rental-DOM trend means longer vacancies and softer asking-rent achievability than the comps imply.
- What's the recent tenant-quality profile in this submarket — average credit score on applications, eviction rate, late-payment / NSF rate, and stable-employment percentage? A property-management company in the area should have these aggregated.
- How much new for-sale + rental construction is in the pipeline within 1–3 miles? Heavy new supply typically softens prices + rents 12–24 months out; constrained supply supports both.
Investment metrics
- 1% rule
- 0.55% ✗
- Cap rate
- 4.36%
- Cash-on-cash
- -6.89%
- DSCR
- 0.69
- GRM
- 15.2
CMA / ARV
No comps found within radius.
Projected returns pro-forma
10.0% appreciation · 3.0% rent growth · sell at horizon
- IRR
- 19.4%
- Equity multiple
- 2.58×
- Total profit
- $110,431
- Equity at exit
- $225,220
- IRR
- 17.8%
- Equity multiple
- 5.93×
- Total profit
- $345,079
- Equity at exit
- $485,695
Cash invested: $70,000 (down + closing). Projections, not guarantees.
Landlord ↔ Tenant lean methodology
- Overall (STATE)
- 87 Strongly Landlord-Friendly
- State Arizona
- 87 Strongly Landlord-Friendly · R+3
- County
- — inherits STATE
- City
- — inherits STATE
ZIP-level market 85937
- Home prices YoY
- 3.3%
- Active inventory
- 290
- Price-to-rent
- 15.2×
Monthly cashflow live
- Estimated rent
- $1,375 medium interval (Pro) →
- Mortgage (P&I)
- −$1,311
- Tax from tax record
- −$73 /mo · $873/yr
- Insurance
- −$104
- HOA
- −$0
- Vacancy / Maint / Mgmt
- −$289
- Net cashflow
- $-402
Break-even live
UW: 25.0% down · 7.5% · 30yr · 1.5% tax · 5.0% vac · 8.0% maint · 8.0% mgmt
Financing live
Cash to close
- Down payment
- $62,500
- Closing costs
- $7,500
- Reserves months
- —
- Total cash needed
- —
Loan-product check · same deal, 3 products live
Conventional
25% down · 7.5% · 30yr
- Down + closing
- —
- Monthly P&I
- —
- Monthly cashflow
- —
- DSCR
- —
- Eligible?
- —
Personal DTI + credit; lowest rate.
DSCR
20% down · 8.5% · 30yr
- Down + closing
- —
- Monthly P&I
- —
- Monthly cashflow
- —
- DSCR
- —
- Eligible?
- —
No personal income docs; deal must DSCR.
Hard money
10% down · 12.0% · 12mo
- Down + closing
- —
- Monthly P&I
- —
- Monthly cashflow
- —
- DSCR
- —
- Eligible?
- —
Short-term bridge; refi at stabilization.
Listing history 12 events
-
2026-06-18days on market $250,000 Active 15 DOM
-
2026-06-17days on market $250,000 Active 14 DOM
-
2026-06-16days on market $250,000 Active 13 DOM
-
2026-06-15days on market $250,000 Active 12 DOM
-
2026-06-14days on market $250,000 Active 10 DOM
-
2026-06-13days on market $250,000 Active 9 DOM
-
2026-06-10days on market $250,000 Active 7 DOM
-
2026-06-09days on market $250,000 Active 6 DOM
-
2026-06-08days on market $250,000 Active 5 DOM
-
2026-06-07days on market $250,000 Active 4 DOM
-
2026-06-05remarks 415-char remark
-
2026-06-05$250,000 Active 1 DOM
ⓘ Source: listings_history table (triggers on properties + properties_extension) + one-shot
backfill from property_details.listing_events for pre-trigger history.
Tax reassessment forecast AZ · Resets to sale price
- Current annual tax
- $873 · $73/mo
- Projected year-2 tax
- $1,650 · $138/mo
- Expected delta
- +$777/yr (+$65/mo · 89.0%)
ⓘ Screening estimate from a state-policy table — verify with the county assessor before closing.
Climate risk First Street
- Flood 1/10 Low FEMA zone X (unshaded) · 0% chance over 30 yrs
- Wildfire 4/10 Moderate
- Heat 4/10 Moderate 7 d/yr ≥92°F today · 18 d/yr by 30 yrs out
- Wind 1/10 Low
- Air quality 1/10 Low 0 unhealthy d/yr today · 0 by 30 yrs out
Nearby sold comps map
Loading sold comps map…
Walkable amenities ~0.75 mi
Loading nearby amenities…
Taxation est. · year 1
- Rental income
- $16,496
- − Mortgage interest
- −$14,004
- − Property taxes
- −$873
- − Insurance
- −$1,250
- − Repairs & maintenance
- −$1,320
- − Management
- −$1,320
- − Depreciation
- −$7,273
- Taxable loss
- −$9,543
- Est. tax savings @ 24.0%
- +$2,290
- After-tax cash flow
- $-2,533/yr
For passive investors: Depreciation is non-cash, so a rental often shows a tax loss while cash-flowing — sheltering income. Rental losses are passive: they offset passive income freely, and up to $25,000/yr can offset ordinary (W-2) income if you actively participate and your MAGI is under $100k (phasing out to $0 by $150k); unused losses carry forward. On sale, claimed depreciation is recaptured at up to 25%, and gains may owe capital-gains tax (a 1031 exchange can defer both). Figures are a year-1 estimate at your 24.0% rate — not tax advice; consult a CPA.
Schools (NCES district)
- District
- Snowflake Unified District (4391)
- NCES district ID
- 0407820
- Math proficiency
- 55% ▼ -9.00%
- Reading proficiency
- 53% ▼ -2.00%
- Median HH income
- $47,767
- Composite
- 45.91/100
- National rank
- #2545
- State rank
- #36 of 249 in AZ
Livability — Snowflake
- Score
- 69/100
- State rank
- #46
- US rank
- #8817
Category grades
Schools grade is shown separately in the Schools card above.
Census & demographics
- Population (ZIP)
- 9,975
Population outlook (Navajo County) Hauer SSP2
- Today (2025)
- 105,760 people
- By 2030
- 103,301 · -2.3%
- By 2040
- 97,070 · -8.2%
- By 2050
- 88,850 · -16.0%
- By 2075
- 65,180 · -38.4%
- By 2100
- 37,281 · -64.7%
Race, ethnicity, and origin ACS 2023
- Neighborhood character
- Predominantly White (83%)
- Race & ethnicity
- White 83% Hispanic / Latino 9% Two or more races 7% Black 4%
- Hispanic origin (detail)
- Mexican 7%
- Common ancestry
- Italian 5% Slovak 3% Portuguese 2%
- Foreign-born
- 4% · Canada
- Languages at home
- 90% English-only · Spanish 7% French/Haitian/Cajun 2% German/W. Germanic 1%
Political lean MEDSL · Navajo
- 2024 margin
- R (+17.2) · D 40.9% · R 58.1%
- 2008→2024 swing
- -5.5pp toward R · 2008: -11.7pp · 2024: -17.2pp
- All cycles
- 2024: R+17.2 2020: R+8.2 2016: R+7.9 2012: R+8.4 2008: R+11.7
Not yet ingested
- Civics
- —
Market trends
- HPI YoY
- ▲ 15.31%
- Current HPI
- 480.9577
- Rent YoY
- —
- Metro
- —
- State GDP YoY
- ▲ 4.54%
- F500 in state
- 20
Industry mix (Fortune 500 HQ in AZ)
| Industry | F500 HQs | Revenue |
|---|---|---|
| Technology | 2 | $13B |
|
||
| Mining / Metals | 1 | $23B |
|
||
| Environmental Services | 1 | $16B |
|
||
| Metals / Steel | 1 | $14B |
|
||
| Technology Distribution | 1 | $9B |
|
||
| Homebuilding | 1 | $8B |
|
||
Price history
+177.8% since first listed4 events — show timeline
- 2026-06-03 Listed $250,000 WMMLS
- 2024-03-27 Price Changed $280,000 WMMLS
- 2024-03-12 Price Changed $245,000 WMMLS
- 2003-01-13 Sold (Public Records) $90,000 Public Records
Property tax history
+1.9%/yrLatest (2025): $873 · +35.3% YoY. Source: county tax records.
Cash-flow waterfall
monthlySold comps — $/sqft
last 12 mo · ≤1 miLoading sold comps…