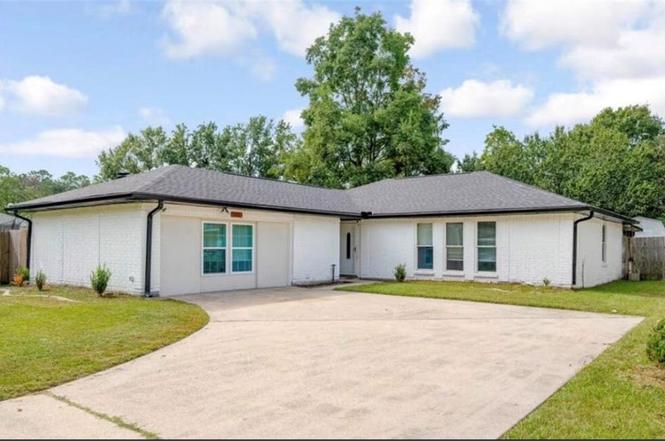
105 Drury Ln · Slidell, LA
Flood risk 6/10 · Moderate
- FEMA flood zone
- X
- Chance of flooding over 30 yrs
- 0.57%
- Est. flood insurance / yr
- $507 – $1,088
Fire risk 5/10 · Moderate
- Est. fire insurance / yr
- $1,269 – $2,357
Heat risk 10/10 · Severe
- Hot days now (above 108°F)
- 7 days/yr
- Hot days in 30 yrs
- 22 days/yr
Wind risk 9/10 · Severe
- Chance of severe wind over 30 yrs
- 99.0%
Air-quality risk 2/10 · Minimal
- Unhealthy air days now
- 1 days/yr
- Unhealthy air days in 30 yrs
- 2 days/yr
Risk factors via First Street. Map © Google.
Why this score? — see what drove the D+ grade
The composite is a weighted blend of 9 inputs, each scored 0–100. Each bar is that input's sub-score; the figure is the points it added to the 100-point composite (weight × sub-score).
- Cash flow +16.1/30.0
- ARV discount +9.1/15.0
- DSCR +5.0/10.0
- Schools +4.3/10.0
- Rent growth +4.0/5.0
- 1% rule +3.8/10.0
- Livability +3.5/5.0
- Condition / age +2.5/5.0
- Appreciation +0.0/10.0
$230,000
🖨 Deal sheet (PDF) 📄 Offer letter ✓ Due diligence
Listing remarks MLS
Come see your new home! This house was fully remodeled with a new roof, floors, paint, appliances,etc... less than two years ago. This beauty will be ready for showing July 1st when the current tenants move out. Please do not bother them in the meantime. It appraised for $250,000 one year ago, so it is being listed at $230,000 for a quick sale.
Key facts
- Parking
- Built 1996
- Listed 3 days
Property features AI
Finance
- HOA & community: Annual homeowners association fee of $200
Exterior
- Parking: Driveway
- Utilities: Public water; Public sewer
- Home design: Single-story; Brick construction; Shingle roof; Slab foundation
- Construction: Built with brick; Shingle roof; Slab foundation
- Exterior features: Lot is outside city limits; Rectangular lot with dimensions approximately 148 x 60 x 155 x 60
Interior
- Bathrooms: Two full bathrooms
- Heating & cooling: Central heating; Central air conditioning
- Interior features: Six total rooms; Very good condition
Neighborhood map
What this means for you Summary
Snapshot
- This is a 4-bed/2.0-bath single-family listed at $230k.
Deal economics
- At list price, monthly cash flow is $119 ($1k/yr) — positive.
- The deal already cash-flows at list — no discount required.
- To meet the 1% rule (rent ≥ 1% of price), the offer needs to be $202k (12.3% below list).
- Recommended offer: $202k (12.3% below list) — sets the bar for 1% rule.
Location & tenants
- Location reads 70/100 on livability (#57 in LA) — a middle-class / working-renter tenant base. Strengths: cost of living A+, housing A+, health & safety A+; Watch: amenities F, commute F.
- St. Tammany Parish (suburban): math 43% / reading 55% proficiency, ranked #11 of 98 in LA (top 11%) — families likely to look elsewhere, expect single-tenant / working-renter base with shorter leases.
- Zoned schools: Bayou Woods Elementary School (math 52% / reading 47%, grade D, #129 of 646 statewide, top 21%, 432 students, 72% FRL); Slidell Junior High School (math 25% / reading 47%, grade F, #84 of 218 statewide, top 41%, 823 students, 60% FRL); Slidell High School (math 34% / reading 41%, grade F, #93 of 265 statewide, top 36%, 1,883 students, 52% FRL) — zoned schools average 61% FRL vs 40% district-wide (22 pts higher); higher-poverty schools than district average — tighter screening recommended.
- Market conditions: Rents rising fast (+5.9%/yr); 246 active listings in the ZIP; 10 comparable units currently listed for rent nearby; rentals lingering (median 46d on market — plan ~5-8 weeks vacancy on turnover, expect pricing pressure); 80% of comp listings sitting > 30 days — soft ceiling on asking rent; 1,064 units permitted in St. Tammany Parish in 2024 (0 in 5+ unit buildings).
- This rent runs 39% of the median local income ($63k/yr) — at the standard rent-burdened threshold; future hikes will face affordability resistance.
Forward outlook
- Local home prices are declining (-3.0%/yr); year-one equity from $2k of loan paydown is wiped out by about $7k of value loss. Plan a longer hold.
- St. Tammany County population projected at +27% by 2050 — long-run rental-demand tailwind backs the buy-and-hold thesis.
Negotiation context
- Only 3 days on market — expect competitive offers; lowballing is unlikely to land.
- 13 sale attempts since 16y ago with the ask held roughly flat each time — persistent listings suggest the price (not the market) is what's stuck; bring a comps-based counter.
- Current owner paid $125k; list at $230k implies a 84% gain — meaningful room to come down on a strong offer.
Risks & watch-outs
- Climate carrying-cost: major flood risk; severe wind risk, 99% chance of damaging wind over 30y; moderate wildfire risk; extreme-heat days projected 7→22/yr by 2055 (HVAC capex compounding) — expect insurance premiums to compound above CPI over the hold.
Questions for the listing agent
- What does the HOA fee cover, when was the last increase, and are there any pending special assessments or reserve-fund shortfalls?
- Is there a deadline driving the sale (1031 exchange, divorce, estate, relocation)? That informs how much negotiation room exists.
- Schools are B-rated — typically a magnet for longer-tenancy family renters. What's the average tenant stay here, and is there a school-zone premium baked into asking?
- The area grade is low — what's the realistic commute time and amenity access for the typical tenant pool here? Any planned neighborhood developments (good or bad) we should know about?
- What's the average days-on-market for RENTAL listings here right now (not sales)? A rising rental-DOM trend means longer vacancies and softer asking-rent achievability than the comps imply.
- What's the recent tenant-quality profile in this submarket — average credit score on applications, eviction rate, late-payment / NSF rate, and stable-employment percentage? A property-management company in the area should have these aggregated.
- How much new for-sale + rental construction is in the pipeline within 1–3 miles? Heavy new supply typically softens prices + rents 12–24 months out; constrained supply supports both.
Investment metrics
- 1% rule
- 0.88% ✗
- Cap rate
- 6.91%
- Cash-on-cash
- 2.22%
- DSCR
- 1.10
- GRM
- 9.5
CMA / ARV
- ARV (on-the-fly)
- $238,750
- Comps found
- 12
Show comp detail 12 sales within ~0.75 mi
| Address | Dist | Beds/Ba | Sqft | Sold | Price | $/sf | Match |
|---|---|---|---|---|---|---|---|
| 308 Westminster Dr | 0.26mi | 4/2.0 | 1,868 (-2%) | 1mo | $220,000 | $118 | 83 |
| 317 Raleigh Dr | 0.24mi | 4/2.0 | 1,810 (-5%) | 11mo | $240,000 | $133 | 71 |
| 1037 Saint Joseph St | 0.54mi | 4/2.0 | 1,908 (-0%) | 8mo | $244,900 | $128 | 68 |
| 201 Drury Ln | 0.12mi | 3/2.0 (-1) | 1,648 (-14%) | 2mo | $170,000 | $103 | 65 |
| 314 Raleigh Dr | 0.23mi | 3/2.0 (-1) | 1,755 (-8%) | 9mo | $220,000 | $125 | 63 |
| 1505 Saint Ann Pl | 0.59mi | 4/2.0 | 1,840 (-4%) | 5mo | $87,800 | $48 | 62 |
| 35411 Liberty Dr | 0.50mi | 4/2.0 | 1,801 (-6%) | 8mo | $234,500 | $130 | 60 |
| 319 Westminster Dr | 0.31mi | 3/2.0 (-1) | 1,648 (-14%) | 2mo | $228,500 | $139 | 56 |
| 301 Holmes Dr | 0.22mi | 3/2.0 (-1) | 1,666 (-13%) | 12mo | $225,000 | $135 | 54 |
| 1334 Westlawn Dr | 0.68mi | 4/2.0 | 1,735 (-9%) | 5mo | $187,500 | $108 | 49 |
| 501 Queen Anne Dr | 0.57mi | 3/2.5 (-1) | 2,100 (+10%) | 3mo | $225,000 | $107 | 47 |
| 1339 Westlawn Dr | 0.71mi | 4/2.0 | 1,679 (-12%) | 11mo | $145,500 | $87 | 38 |
Match score weights: distance 35% · size 25% · config 20% · recency 20%. Top-matched comps best support the ARV.
Projected returns pro-forma
-3.0% appreciation · 5.91% rent growth · sell at horizon
- IRR
- -9.8%
- Equity multiple
- 0.63×
- Total profit
- $-23,647
- Equity at exit
- $34,294
- IRR
- 3.0%
- Equity multiple
- 1.24×
- Total profit
- $15,490
- Equity at exit
- $19,886
Cash invested: $64,400 (down + closing). Projections, not guarantees.
Landlord ↔ Tenant lean methodology
- Overall (STATE)
- 90 Strongly Landlord-Friendly
- State Louisiana
- 90 Strongly Landlord-Friendly · R+12
- County
- — inherits STATE
- City
- — inherits STATE
ZIP-level market 70460
- Rents YoY
- 5.9%
- Active inventory
- 246
- Price-to-rent
- 9.5×
Monthly cashflow live
- Estimated rent
- $2,017 high interval (Pro) →
- Mortgage (P&I)
- −$1,206
- Tax from tax record
- −$156 /mo · $1,867/yr
- Insurance
- −$96
- HOA
- −$17
- Vacancy / Maint / Mgmt
- −$424
- Net cashflow
- $119
Break-even live
Sensitivity live
| Price | -10% $249 | -5% $184 | +0% $119 | +5% $54 | +10% $-11 |
|---|---|---|---|---|---|
| Rent | -10% $-40 | -5% $39 | +0% $119 | +5% $199 | +10% $278 |
| Rate | -1.0pp $235 | -0.5pp $178 | base $119 | +0.5pp $59 | +1.0pp $-1 |
UW: 25.0% down · 7.5% · 30yr · 1.5% tax · 5.0% vac · 8.0% maint · 8.0% mgmt
Financing live
Cash to close
- Down payment
- $57,500
- Closing costs
- $6,900
- Reserves months
- —
- Total cash needed
- —
Loan-product check · same deal, 3 products live
Conventional
25% down · 7.5% · 30yr
- Down + closing
- —
- Monthly P&I
- —
- Monthly cashflow
- —
- DSCR
- —
- Eligible?
- —
Personal DTI + credit; lowest rate.
DSCR
20% down · 8.5% · 30yr
- Down + closing
- —
- Monthly P&I
- —
- Monthly cashflow
- —
- DSCR
- —
- Eligible?
- —
No personal income docs; deal must DSCR.
Hard money
10% down · 12.0% · 12mo
- Down + closing
- —
- Monthly P&I
- —
- Monthly cashflow
- —
- DSCR
- —
- Eligible?
- —
Short-term bridge; refi at stabilization.
Rent comps 10 comps
| Address | Beds | Baths | Sqft | Rent | $/sqft | DOM | Units | Dist |
|---|---|---|---|---|---|---|---|---|
| 308 Raleigh Dr Slidell, LA | 4.0 | 2.5 | 2292 | $2,125 | $0.93 | 45d | 1 | 0.22mi |
| 35567 Liberty Dr Slidell, LA | 3.0 | 2.0 | 1232 | $1,650 | $1.34 | 46d | 1 | 0.25mi |
| 110 Charles Dr Slidell, LA | 4.0 | 2.0 | 2210 | $2,175 | $0.98 | 13d | 1 | 0.54mi |
| 444 Holmes Dr Slidell, LA | 4.0 | 2.0 | 1594 | $1,800 | $1.13 | 46d | 1 | 0.62mi |
| 35363 Melody Ln Slidell, LA | 3.0 | 2.0 | 1510 | $1,800 | $1.19 | 45d | 1 | 0.62mi |
| 1111 Saint Scholastica St Slidell, LA | 3.0 | 2.0 | 2037 | $2,000 | $0.98 | 25d | 1 | 0.70mi |
| 35621 Oak Ridge Ave Slidell, LA | 3.0 | 2.0 | 1406 | $1,800 | $1.28 | 45d | 1 | 0.78mi |
| 36409 Jackson Rd Slidell, LA | 4.0 | 2.0 | 1670 | $2,100 | $1.26 | 45d | 1 | 0.86mi |
| 58019 Carroll Rd Slidell, LA | 4.0 | 2.0 | 1400 | $1,695 | $1.21 | 45d | 1 | 0.91mi |
| 96 Chamale Cv Slidell, LA | 3.0 | 2.5 | 1432 | $1,500 | $1.05 | 45d | 1 | 1.45mi |
HOA detail
- Monthly dues
- $17 · $204/yr
Listing history 4 events
-
2026-06-21remarks 356-char remark
-
2026-06-21days on market $230,000 Active 3 DOM
-
2026-06-18remarks 348-char remark
Show marketing remark (346 chars)
Come see your new home! This house was fully remodeled with a new roof, floors, paint, appliances,etc... less than two years ago. This beauty will be ready for showing July 1st when the current tenants move out. Please do not bother them in the meantime. It appraised for $250,000 one year ago, so it is being listed at $230,000 for a quick sale.
-
2026-06-18$230,000 Active 1 DOM
Show marketing remark (346 chars)
Come see your new home! This house was fully remodeled with a new roof, floors, paint, appliances,etc... less than two years ago. This beauty will be ready for showing July 1st when the current tenants move out. Please do not bother them in the meantime. It appraised for $250,000 one year ago, so it is being listed at $230,000 for a quick sale.
ⓘ Source: listings_history table (triggers on properties + properties_extension) + one-shot
backfill from property_details.listing_events for pre-trigger history.
Tax reassessment forecast LA · Resets to sale price
- Current annual tax
- $1,867 · $156/mo
- Projected year-2 tax
- $1,867 · $156/mo
- Expected delta
- $0/yr ($0/mo · 0.0%)
ⓘ Screening estimate from a state-policy table — verify with the county assessor before closing.
Climate risk First Street
- Flood 6/10 Major FEMA zone X · 57% chance over 30 yrs
- Wildfire 5/10 Major
- Heat 10/10 Extreme 7 d/yr ≥108°F today · 22 d/yr by 30 yrs out
- Wind 9/10 Extreme 99% chance of damaging wind over 30 yrs
- Air quality 2/10 Low 1 unhealthy d/yr today · 2 by 30 yrs out
Nearby sold comps map
Loading sold comps map…
Walkable amenities ~0.75 mi
Loading nearby amenities…
Taxation est. · year 1
- Rental income
- $24,207
- − Mortgage interest
- −$12,884
- − Property taxes
- −$1,867
- − Insurance
- −$1,150
- − Repairs & maintenance
- −$1,937
- − Management
- −$1,937
- − HOA
- −$204
- − Depreciation
- −$6,691
- Taxable loss
- −$2,461
- Est. tax savings @ 24.0%
- +$591
- After-tax cash flow
- $2,020/yr
For passive investors: Depreciation is non-cash, so a rental often shows a tax loss while cash-flowing — sheltering income. Rental losses are passive: they offset passive income freely, and up to $25,000/yr can offset ordinary (W-2) income if you actively participate and your MAGI is under $100k (phasing out to $0 by $150k); unused losses carry forward. On sale, claimed depreciation is recaptured at up to 25%, and gains may owe capital-gains tax (a 1031 exchange can defer both). Figures are a year-1 estimate at your 24.0% rate — not tax advice; consult a CPA.
Schools (NCES district)
- District
- St. Tammany Parish
- NCES district ID
- 2201650
- Math proficiency
- 43% ▼ -32.00%
- Reading proficiency
- 55% ▼ -26.00%
- Median HH income
- $61,752
- Composite
- 43.04/100
- National rank
- #3098
- State rank
- #11 of 98 in LA
Livability — Slidell
- Score
- 70/100
- State rank
- #57
- US rank
- #7673
Category grades
Schools grade is shown separately in the Schools card above.
Census & demographics
- County
- Saint Tammany Parish · 228,296 people
- City population
- 95,511
- Metro
- New Orleans-Metairie, LA
- Population (ZIP)
- 21,669
- Household income
- $62,565
- Rent vs Own
- Severe rent burden
- 318.0
Population outlook (St. Tammany County) Hauer SSP2
- Today (2025)
- 286,725 people
- By 2030
- 304,175 · +6.1%
- By 2040
- 336,203 · +17.3%
- By 2050
- 364,590 · +27.2%
- By 2075
- 433,362 · +51.1%
- By 2100
- 470,333 · +64.0%
Race, ethnicity, and origin ACS 2023
- Neighborhood character
- Diverse neighborhood (Simpson 0.62)
- Race & ethnicity
- White 53% Black 29% Two or more races 11% Hispanic / Latino 10% Pacific Islander 2%
- Hispanic origin (detail)
- Mexican 3%
- Common ancestry
- Lithuanian 13% Slovak 1% Italian 1%
- Foreign-born
- 5% · Canada
- Languages at home
- 92% English-only · Spanish 6%
Political lean MEDSL · St. Tammany
- 2024 margin
- Solid R (+43.8) · D 27.3% · R 71.1% · Other 1.6%
- 2008→2024 swing
- +9.6pp toward D · 2008: -53.4pp · 2024: -43.8pp
- All cycles
- 2024: R+43.8 2020: R+44.2 2016: R+50.8 2012: R+52.2 2008: R+53.4
Not yet ingested
- Civics
- —
Market trends
- HPI YoY
- ▼ -93.87%
- Current HPI
- 130.56
- Rent YoY
- ▲ 5.91%
- Metro
- New Orleans-Metairie, LA
- State GDP YoY
- ▲ 3.29%
- F500 in state
- 10
Industry mix (Fortune 500 HQ in LA)
| Industry | F500 HQs | Revenue |
|---|---|---|
| Telecommunications | 2 | $23B |
|
||
| Utilities | 1 | $12B |
|
||
| Wholesale / Distribution | 1 | $5B |
|
||
| Advertising | 1 | $2B |
|
||
Price history
+43.8% since first listed32 events — show timeline
- 2026-06-18 Listed $230,000 AcadianaMLS
- 2026-06-18 Listed $230,000 GSREIN
- 2025-10-19 Rental Removed $2,000 GSREIN
- 2025-10-13 Price Changed $2,000 GSREIN
- 2025-10-09 Price Changed $230,000 AcadianaMLS
- 2025-10-09 Price Changed $230,000 GSREIN
- 2025-09-26 Price Changed $234,000 AcadianaMLS
- 2025-09-25 Price Changed $234,000 GSREIN
- 2025-09-17 Price Changed $2,100 GSREIN
- 2025-09-10 Listed for Rent $2,200 GSREIN
- 2025-09-09 Listed $240,000 AcadianaMLS
- 2025-09-06 Price Changed $240,000 AcadianaMLS
- 2025-05-21 Price Changed $245,000 AcadianaMLS
- 2025-05-21 Price Changed $245,000 GSREIN
- 2025-04-14 Listed $250,000 AcadianaMLS
- 2024-08-28 Rental Removed $2,000 GSREIN
- 2024-08-20 Listed for Rent $2,000 GSREIN
- 2024-04-26 Sold (Public Records) $125,000 Public Records
- 2019-04-03 Sold (Public Records) $100,000 Public Records
- 2016-04-29 Sold (MLS) $130,000 GSREIN
- 2016-04-26 Contingent — GSREIN
- 2016-04-18 Relisted — GSREIN
- 2016-02-18 Contingent — GSREIN
- 2016-01-29 Price Changed $130,000 GSREIN
- 2016-01-13 Price Changed $134,000 GSREIN
- 2016-01-13 Price Changed $135,000 GSREIN
- 2015-11-10 Listed $139,000 GSREIN
- 2015-11-10 Listed $130,000 AcadianaMLS
- 2014-06-14 Listed $130,000 GSREIN
- 2014-06-14 Listed $130,000 AcadianaMLS
- 2010-07-12 Listed $159,900 GSREIN
- 2010-07-12 Listed $159,900 AcadianaMLS
Property tax history
-0.6%/yrLatest (2025): $1,867 · -3.9% YoY. Source: county tax records.
Cash-flow waterfall
monthlySold comps — $/sqft
last 12 mo · ≤1 miLoading sold comps…