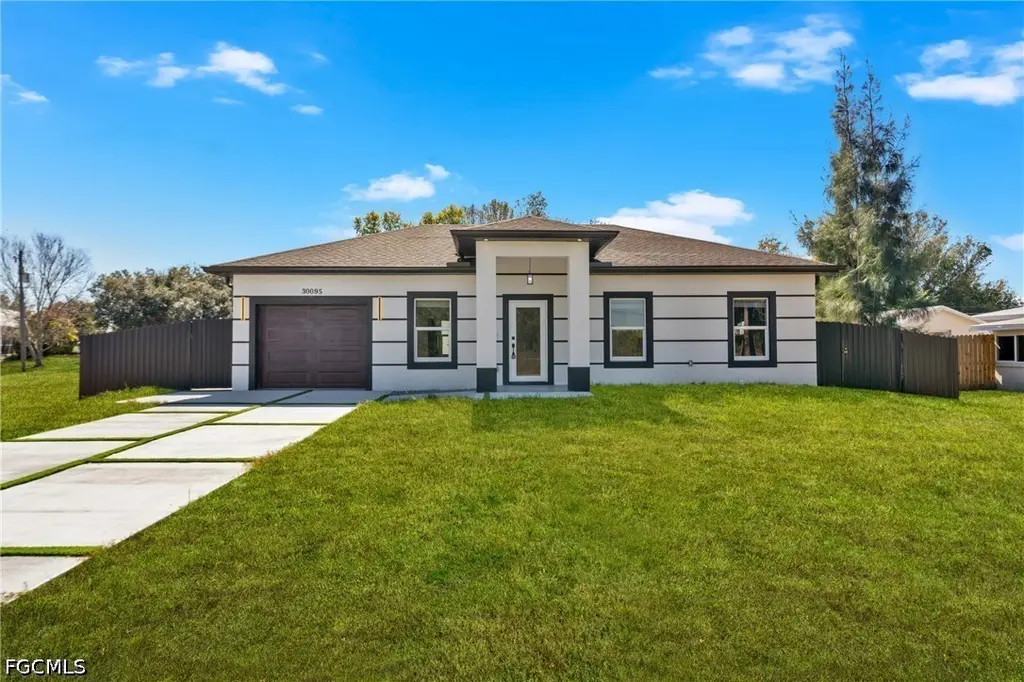
30095 Beech Rd · Cleveland, FL
Flood risk 6/10 · Moderate
- FEMA flood zone
- X (shaded)
- Chance of flooding over 30 yrs
- 0.56%
- Est. flood insurance / yr
- $507 – $1,088
Fire risk 4/10 · Minor
- Est. fire insurance / yr
- $947 – $1,759
Heat risk 10/10 · Severe
- Hot days now (above 108°F)
- 7 days/yr
- Hot days in 30 yrs
- 28 days/yr
Wind risk 10/10 · Severe
- Chance of severe wind over 30 yrs
- 99.0%
Air-quality risk 2/10 · Minimal
- Unhealthy air days now
- 2 days/yr
- Unhealthy air days in 30 yrs
- 2 days/yr
Risk factors via First Street. Map © Google.
Why this score? — see what drove the D+ grade
The composite is a weighted blend of 9 inputs, each scored 0–100. Each bar is that input's sub-score; the figure is the points it added to the 100-point composite (weight × sub-score).
- Cash flow +14.4/30.0
- ARV discount +7.5/15.0
- Schools +4.6/10.0
- DSCR +4.4/10.0
- 1% rule +4.0/10.0
- Rent growth +3.5/5.0
- Livability +3.4/5.0
- Condition / age +2.5/5.0
- Appreciation +2.4/10.0
$275,000
🖨 Deal sheet 📄 Offer letter ✓ Due diligence
Listing remarks
Beautiful new construction home located in the desirable Punta Gorda area of Florida’s Gulf Coast. This modern residence features an open-concept floor plan with a bright great room, contemporary kitchen with island, and spacious bedrooms designed for comfortable Florida living. Tile flooring throughout and high ceilings create a clean and elegant feel. Situated on a generous lot, the property offers plenty of outdoor space with room to add a pool, garden, or entertainment area. The home includes a private driveway, attached garage, and a covered lanai perfect for enjoying the warm Gulf Coast climate year-round. Conveniently located near shopping, dining, parks, and the vibrant waterf
Key facts
- Contemporary kitchen
- Generous lot
- Tile flooring
Tags
Property features AI
Finance
- Financial info: Pets allowed with conditions (call for details)
- HOA & community: Non-gated community; Association fee listed as $0
Exterior
- Parking: Attached garage with 2 spaces; Driveway; Paved parking; Garage door opener
- Security: Smoke detector(s)
- Utilities: Septic tank; Private well water; Cable available; High speed internet available; Public maintained paved road
- Home design: Single-story home; Entry level: 1; New construction; South-facing; North exposure noted
- Construction: Block, concrete and stucco construction; Shingle roof; New construction
- Exterior features: Fenced yard; Open patio/porch; Patio; Porch; Room for a pool; Outdoor storage
Interior
- Kitchen: Dishwasher; Microwave; Range; Refrigerator; Kitchen island; Breakfast bar; Pantry; Eat-in kitchen
- Bedrooms: Primary bedroom on the main level; Additional bedroom(s) on the main level
- Flooring: Tile flooring
- Bathrooms: 3 full bathrooms; Separate shower in at least one bathroom; Shower-only stall in at least one bathroom
- Heating & cooling: Central heating (electric); Central air conditioning (electric); Ceiling fans
- Interior features: Breakfast bar; Eat-in kitchen; Kitchen island; High ceilings; Living/dining room; Main level primary bedroom; Bedroom on main level; Pantry; Separate shower; Shower only; Walk-in closet(s); Cable TV available; High speed internet available; Split bedroom floorplan; Sliding windows; Impact glass windows; Unfurnished
- Laundry & utility: Washer hookup inside; Dryer hookup inside
Neighborhood map
What this means for you Summary
Snapshot
- This is a 3-bed/3.0-bath land listed at $275k.
Deal economics
- At list price, monthly cash flow is $56 ($675/yr) — positive.
- The deal already cash-flows at list — no discount required.
- To meet the 1% rule (rent ≥ 1% of price), the offer needs to be $248k (9.9% below list).
- Recommended offer: $248k (9.9% below list) — sets the bar for 1% rule.
- Cap rate 6.5% vs local median 4.8% in Cleveland — top-decile yield for the area; either an underpriced asset or a hidden risk that comps aren't pricing in. Stress-test before assuming the spread holds.
Location & tenants
- Location reads 67/100 on livability (#574 in FL) — a middle-class / working-renter tenant base. Strengths: crime A+, cost of living A+, housing A+; Watch: employment D, schools F, amenities F.
- Charlotte (suburban): math 54% / reading 54% proficiency, ranked #22 of 73 in FL (top 30%) — acceptable for families but not a draw, mixed tenant base, ~2y average lease.
- Market conditions: Rents rising fast (+4.1%/yr); 1037 active listings in the ZIP; 4,585 units permitted in Charlotte County in 2024 (703 in 5+ unit buildings).
- This rent runs 41% of the median local income ($72k/yr) — at the standard rent-burdened threshold; future hikes will face affordability resistance.
Forward outlook
- Local home prices are declining (-3.0%/yr); year-one equity from $2k of loan paydown is wiped out by about $8k of value loss. Plan a longer hold.
- Charlotte County population projected at +24% by 2050 — long-run rental-demand tailwind backs the buy-and-hold thesis.
Negotiation context
- It's been on market 86 days — a 6% lower offer ($258k) is reasonable based on typical stale-listing flexibility.
- 15 sale attempts since 12y ago; this cycle's ask has dropped $15k (5%) from the opening price — seller is motivated, your offer sets the floor, not the list.
- Current owner paid $18k; list at $275k implies a 1428% gain — meaningful room to come down on a strong offer.
Risks & watch-outs
- Climate carrying-cost: major flood risk; severe wind risk, 99% chance of damaging wind over 30y; extreme-heat days projected 7→28/yr by 2055 (HVAC capex compounding) — expect insurance premiums to compound above CPI over the hold.
Questions for the listing agent
- It's been on market 86 days. Have you received any prior offers? Is the seller open to a 10% concession, seller financing, or rate buy-down credit?
- Why hasn't it sold? Are there any deal-killer items the seller is aware of (foundation, flood, title, zoning, code violations)?
- Is there a deadline driving the sale (1031 exchange, divorce, estate, relocation)? That informs how much negotiation room exists.
- Schools are F-rated, which usually means shorter tenancies and higher turnover. Who's the typical renter profile here, and what's been the actual vacancy rate?
- The area grade is low — what's the realistic commute time and amenity access for the typical tenant pool here? Any planned neighborhood developments (good or bad) we should know about?
- What's the average days-on-market for RENTAL listings here right now (not sales)? A rising rental-DOM trend means longer vacancies and softer asking-rent achievability than the comps imply.
- What's the recent tenant-quality profile in this submarket — average credit score on applications, eviction rate, late-payment / NSF rate, and stable-employment percentage? A property-management company in the area should have these aggregated.
- How much new for-sale + rental construction is in the pipeline within 1–3 miles? Heavy new supply typically softens prices + rents 12–24 months out; constrained supply supports both.
Investment metrics
- 1% rule
- 0.90% ✗
- Cap rate
- 6.54%
- Cash-on-cash
- 0.88%
- DSCR
- 1.04
- GRM
- 9.3
CMA / ARV
No comps found within radius.
Projected returns pro-forma
-3.0% appreciation · 4.13% rent growth · sell at horizon
- IRR
- -13.6%
- Equity multiple
- 0.51×
- Total profit
- $-38,096
- Equity at exit
- $41,003
- IRR
- -3.0%
- Equity multiple
- 0.79×
- Total profit
- $-16,454
- Equity at exit
- $23,777
Cash invested: $77,000 (down + closing). Projections, not guarantees.
Landlord ↔ Tenant lean methodology
- Overall (STATE)
- 87 Strongly Landlord-Friendly
- State Florida
- 87 Strongly Landlord-Friendly · R+3
- County
- — inherits STATE
- City
- — inherits STATE
ZIP-level market 33982
- Home prices YoY
- -1.2%
- Rents YoY
- 4.1%
- Active inventory
- 1037
- Price-to-rent
- 9.3×
Monthly cashflow live
- Estimated rent
- $2,477 medium interval (Pro) →
- Mortgage (P&I)
- −$1,442
- Tax est. 1.5%
- −$344 /mo · $4,125/yr
- Insurance
- −$115
- HOA
- −$0
- Vacancy / Maint / Mgmt
- −$520
- Net cashflow
- $56
Break-even live
UW: 25.0% down · 7.5% · 30yr · 1.5% tax · 5.0% vac · 8.0% maint · 8.0% mgmt
Financing live
Cash to close
- Down payment
- $68,750
- Closing costs
- $8,250
- Reserves months
- —
- Total cash needed
- —
Loan-product check · same deal, 3 products live
Conventional
25% down · 7.5% · 30yr
- Down + closing
- —
- Monthly P&I
- —
- Monthly cashflow
- —
- DSCR
- —
- Eligible?
- —
Personal DTI + credit; lowest rate.
DSCR
20% down · 8.5% · 30yr
- Down + closing
- —
- Monthly P&I
- —
- Monthly cashflow
- —
- DSCR
- —
- Eligible?
- —
No personal income docs; deal must DSCR.
Hard money
10% down · 12.0% · 12mo
- Down + closing
- —
- Monthly P&I
- —
- Monthly cashflow
- —
- DSCR
- —
- Eligible?
- —
Short-term bridge; refi at stabilization.
Listing history 50 events
-
2026-06-18price $275,000 Active 86 DOM
-
2026-06-18days on market $285,000 Active 86 DOM
-
2026-06-17days on market $285,000 Active 85 DOM
-
2026-06-16days on market $285,000 Active 84 DOM
-
2026-06-15days on market $285,000 Active 83 DOM
-
2026-06-14days on market $285,000 Active 81 DOM
-
2026-06-13days on market $285,000 Active 80 DOM
-
2026-06-10days on market $285,000 Active 78 DOM
-
2026-06-09days on market $285,000 Active 77 DOM
-
2026-06-08days on market $285,000 Active 76 DOM
-
2026-06-07days on market $285,000 Active 75 DOM
-
2026-06-05pricedays on market $285,000 Active 72 DOM
-
2026-06-03days on market $290,000 Active 71 DOM
-
2026-06-02days on market $290,000 Active 70 DOM
-
2026-06-01days on market $290,000 Active 69 DOM
-
2026-05-31days on market $290,000 Active 68 DOM
-
2026-05-30days on market $290,000 Active 67 DOM
-
2026-04-09$289,900 Active
-
2026-03-31historical
-
2026-03-24historical
-
2026-03-24$290,000 Active
-
2026-03-24historical
-
2026-03-18status Active
-
2026-03-17status Pending
-
2026-02-27price $289,900
-
2026-02-27price $289,900
-
2026-02-26price $289,900
-
2026-01-27price $294,900
-
2026-01-27price $294,900
-
2026-01-27price $294,900
-
2025-12-09$305,000 Active
-
2025-12-04$305,000 Active
-
2025-12-04$305,000 Active
-
2024-04-16soldstatus $18,000
-
2024-04-15soldstatus $18,000 Closed
-
2024-03-23status Pending
-
2024-02-19$18,900 Active
-
2023-10-27historical
-
2023-09-18price $306,400
-
2023-09-06$456,500 Active
-
2023-09-05historical
-
2023-08-02$389,400 Active
-
2023-06-29historical
-
2023-02-20$371,400 Active
-
2023-01-10historical
-
2022-11-10status Active
-
2022-10-14historical
-
2022-07-25price $336,400
-
2022-07-25price $364,300
-
2022-07-22price $336,400
ⓘ Source: listings_history table (triggers on properties + properties_extension) + one-shot
backfill from property_details.listing_events for pre-trigger history.
Climate risk First Street
- Flood 6/10 Major FEMA zone X (shaded) · 56% chance over 30 yrs
- Wildfire 4/10 Moderate
- Heat 10/10 Extreme 7 d/yr ≥108°F today · 28 d/yr by 30 yrs out
- Wind 10/10 Extreme 99% chance of damaging wind over 30 yrs
- Air quality 2/10 Low 2 unhealthy d/yr today · 2 by 30 yrs out
Nearby sold comps map
Loading sold comps map…
Walkable amenities ~0.75 mi
Loading nearby amenities…
Taxation est. · year 1
- Rental income
- $29,722
- − Mortgage interest
- −$15,404
- − Property taxes
- −$4,125
- − Insurance
- −$1,375
- − Repairs & maintenance
- −$2,378
- − Management
- −$2,378
- − Depreciation
- −$8,000
- Taxable loss
- −$3,938
- Est. tax savings @ 24.0%
- +$945
- After-tax cash flow
- $1,620/yr
For passive investors: Depreciation is non-cash, so a rental often shows a tax loss while cash-flowing — sheltering income. Rental losses are passive: they offset passive income freely, and up to $25,000/yr can offset ordinary (W-2) income if you actively participate and your MAGI is under $100k (phasing out to $0 by $150k); unused losses carry forward. On sale, claimed depreciation is recaptured at up to 25%, and gains may owe capital-gains tax (a 1031 exchange can defer both). Figures are a year-1 estimate at your 24.0% rate — not tax advice; consult a CPA.
Schools (NCES district)
- District
- Charlotte
- NCES district ID
- 1200240
- Math proficiency
- 54% ▼ -6.00%
- Reading proficiency
- 54% ▼ -1.00%
- Median HH income
- $44,864
- Composite
- 45.62/100
- National rank
- #2586
- State rank
- #22 of 73 in FL
Livability — Cleveland
- Score
- 67/100
- State rank
- #574
- US rank
- #10905
Category grades
Schools grade is shown separately in the Schools card above.
Census & demographics
- County
- Charlotte County · 196,994 people
- Metro
- Punta Gorda, FL
- Population (ZIP)
- 13,006
- Household income
- $72,443
- Rent vs Own
- Severe rent burden
- 43.0
Population outlook (Charlotte County) Hauer SSP2
- Today (2025)
- 198,646 people
- By 2030
- 210,507 · +6.0%
- By 2040
- 230,857 · +16.2%
- By 2050
- 247,148 · +24.4%
- By 2075
- 281,777 · +41.8%
- By 2100
- 293,609 · +47.8%
Race, ethnicity, and origin ACS 2023
- Neighborhood character
- Predominantly White (81%)
- Race & ethnicity
- White 81% Two or more races 8% Hispanic / Latino 7% Black 7%
- Hispanic origin (detail)
- Puerto Rican 2% Cuban 3%
- Common ancestry
- Lithuanian 3% Iranian 3% Slovak 3%
- Foreign-born
- 6% · Canada, Jamaica
- Languages at home
- 93% English-only · Spanish 5% German/W. Germanic 1% Arabic 1%
Political lean MEDSL · Charlotte
- 2024 margin
- Solid R (+34.0) · D 32.7% · R 66.7%
- 2008→2024 swing
- -26.7pp toward R · 2008: -7.2pp · 2024: -34.0pp
- All cycles
- 2024: R+34.0 2020: R+26.6 2016: R+27.8 2012: R+14.3 2008: R+7.2
Not yet ingested
- Civics
- —
Market trends
- HPI YoY
- ▼ -5.25%
- Current HPI
- 448.5895
- Rent YoY
- ▲ 4.13%
- Metro
- Punta Gorda, FL
- State GDP YoY
- ▲ 3.28%
- F500 in state
- 36
Industry mix (Fortune 500 HQ in FL)
| Industry | F500 HQs | Revenue |
|---|---|---|
| Industrial Technology | 2 | $29B |
|
||
| Insurance | 2 | $17B |
|
||
| Retail | 1 | $60B |
|
||
| Technology Distribution | 1 | $58B |
|
||
| Homebuilding | 1 | $35B |
|
||
| Technology Manufacturing | 1 | $35B |
|
||
Price history
+4735.7% since first listed45 events — show timeline
- 2026-04-09 Listed $289,900 Stellar MLS as Distributed by MLS Grid
- 2026-03-31 Listing Removed — Stellar MLS as Distributed by MLS Grid
- 2026-03-24 Listing Removed — MARMLS
- 2026-03-24 Listed $290,000 FORTMLS
- 2026-03-24 Listing Removed — FORTMLS
- 2026-03-18 Relisted — FORTMLS
- 2026-03-17 Pending — FORTMLS
- 2026-02-27 Price Changed $289,900 MARMLS
- 2026-02-27 Price Changed $289,900 FORTMLS
- 2026-02-26 Price Changed $289,900 Stellar MLS as Distributed by MLS Grid
- 2026-01-27 Price Changed $294,900 Stellar MLS as Distributed by MLS Grid
- 2026-01-27 Price Changed $294,900 FORTMLS
- 2026-01-27 Price Changed $294,900 MARMLS
- 2025-12-09 Listed $305,000 MARMLS
- 2025-12-04 Listed $305,000 FORTMLS
- 2025-12-04 Listed $305,000 Stellar MLS as Distributed by MLS Grid
- 2024-04-16 Sold (Public Records) $18,000 Public Records
- 2024-04-15 Sold (MLS) $18,000 Stellar MLS as Distributed by MLS Grid
- 2024-03-23 Pending — Stellar MLS as Distributed by MLS Grid
- 2024-02-19 Listed $18,900 Stellar MLS as Distributed by MLS Grid
- 2023-10-27 Listing Removed — Stellar MLS as Distributed by MLS Grid
- 2023-09-18 Price Changed $306,400 Stellar MLS as Distributed by MLS Grid
- 2023-09-06 Listed $456,500 Stellar MLS as Distributed by MLS Grid
- 2023-09-05 Listing Removed — Stellar MLS as Distributed by MLS Grid
- 2023-08-02 Listed $389,400 Stellar MLS as Distributed by MLS Grid
- 2023-06-29 Listing Removed — Stellar MLS as Distributed by MLS Grid
- 2023-02-20 Listed $371,400 Stellar MLS as Distributed by MLS Grid
- 2023-01-10 Listing Removed — Stellar MLS as Distributed by MLS Grid
- 2022-11-10 Relisted — Stellar MLS as Distributed by MLS Grid
- 2022-10-14 Listing Removed — Stellar MLS as Distributed by MLS Grid
- 2022-07-25 Price Changed $336,400 Stellar MLS as Distributed by MLS Grid
- 2022-07-25 Price Changed $364,300 Stellar MLS as Distributed by MLS Grid
- 2022-07-22 Price Changed $336,400 Stellar MLS as Distributed by MLS Grid
- 2022-03-25 Price Changed $341,400 Stellar MLS as Distributed by MLS Grid
- 2022-03-21 Price Changed $338,400 Stellar MLS as Distributed by MLS Grid
- 2022-01-10 Price Changed $341,400 Stellar MLS as Distributed by MLS Grid
- 2021-12-03 Listed $326,400 Stellar MLS as Distributed by MLS Grid
- 2021-11-17 Sold (Public Records) $13,000 Public Records
- 2021-11-16 Sold (MLS) $13,000 Stellar MLS as Distributed by MLS Grid
- 2021-10-24 Pending — Stellar MLS as Distributed by MLS Grid
- 2021-10-23 Relisted — Stellar MLS as Distributed by MLS Grid
- 2021-10-22 Pending — Stellar MLS as Distributed by MLS Grid
- 2021-10-17 Listed $15,000 Stellar MLS as Distributed by MLS Grid
- 2015-06-09 Listing Removed — Stellar MLS as Distributed by MLS Grid
- 2014-06-14 Listed $5,995 Stellar MLS as Distributed by MLS Grid
Property tax history
+5.3%/yrLatest (2025): $361 · -23.3% YoY. Source: county tax records.
Cash-flow waterfall
monthlySold comps — $/sqft
last 12 mo · ≤1 miLoading sold comps…