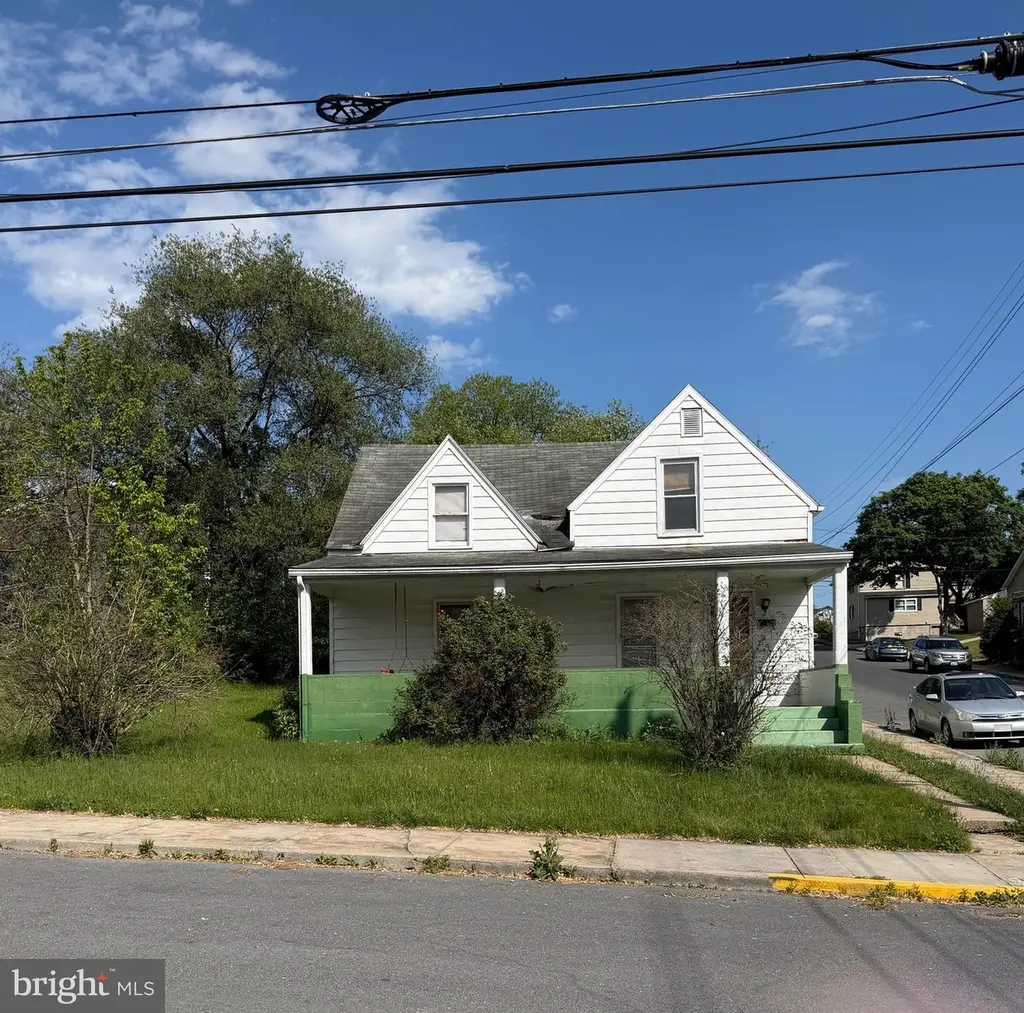
803 3rd St · Martinsburg, WV
Flood risk 1/10 · Minimal
- FEMA flood zone
- X (unshaded)
- Chance of flooding over 30 yrs
- 0.0%
- Est. flood insurance / yr
- $473 – $860
Fire risk 3/10 · Minor
- Est. fire insurance / yr
- $787 – $1,461
Heat risk 5/10 · Moderate
- Hot days now (above 103°F)
- 7 days/yr
- Hot days in 30 yrs
- 16 days/yr
Wind risk 2/10 · Minimal
- Chance of severe wind over 30 yrs
- 2.0%
Air-quality risk 2/10 · Minimal
- Unhealthy air days now
- 0 days/yr
- Unhealthy air days in 30 yrs
- 1 days/yr
Risk factors via First Street. Map © Google.
Why this score? — see what drove the B grade
The composite is a weighted blend of 9 inputs, each scored 0–100. Each bar is that input's sub-score; the figure is the points it added to the 100-point composite (weight × sub-score).
- Cash flow +30.0/30.0
- 1% rule +10.0/10.0
- DSCR +10.0/10.0
- ARV discount +7.5/15.0
- Rent growth +4.1/5.0
- Livability +3.8/5.0
- Schools +2.6/10.0
- Condition / age +2.5/5.0
- Appreciation +0.0/10.0
$90,000
🖨 Deal sheet (PDF) 📄 Offer letter ✓ Due diligence
Listing remarks
HIGHEST AND BEST OFFERS DUE WED. BY 8PM! INVESTOR SPECIAL!! This 3 bedroom, 1 bath Cape Cod home is ready for its next chapter and offers a great opportunity for investors/flippers looking for their next project! Situated on nearly a quarter acre lot, the property also features a covered front porch and classic character that provide a starting point for restoration or redevelopment. Cash sale only. Property is being sold as-is.
Key facts
- 9,848 sq ft lot
- Built 1940
- Listed 6 days
Property features AI
Exterior
- Parking: On-street parking
- Utilities: Public water; Public sewer
- Home design: Detached property; Composite roof; Aluminum siding
- Construction: Stone foundation; Built year per assessor
- Exterior features: Corner lot location; In city limits
Interior
- Bedrooms: 1 bedroom on main level; 2 bedrooms on the first upper level
- Bathrooms: 1 full bathroom (main level)
- Heating & cooling: Heating system: Other; Natural gas heat; Natural gas hot water
- Interior features: Estimated living area; 7 total rooms; Unfinished basement with outside entrance
Neighborhood map
What this means for you Summary
Snapshot
- This is a 2-bed/1.0-bath single-family listed at $90k.
Deal economics
- At list price, monthly cash flow is $573 ($7k/yr) — positive.
- The deal already cash-flows at list — no discount required.
- Meets the 1% rule at list price ($1k rent vs $90k).
- Cap rate 13.9% vs local median 4.0% in Martinsburg — top-decile yield for the area; either an underpriced asset or a hidden risk that comps aren't pricing in. Stress-test before assuming the spread holds.
Location & tenants
- Location reads 75/100 on livability (#29 in WV, #4,057 nationally) — a middle-class / working-renter tenant base. Strengths: amenities A+, cost of living A+, housing A+; Watch: commute F, employment D-.
- Berkeley County Schools (other): math 21% / reading 38% proficiency, ranked #24 of 55 in WV (top 44%) — low school quality limits family demand, transient renter base, plan for 1-2y turnover.
- Market conditions: Rents rising fast (+6.3%/yr); 109 active listings in the ZIP; 25 comparable units currently listed for rent nearby; rentals at typical pace (median 14d on market — plan ~3-4 weeks tenant-placement turnaround); 1,460 units permitted in Berkeley County in 2024 (16 in 5+ unit buildings).
Forward outlook
- Local home prices are declining (-3.0%/yr); year-one equity from $622 of loan paydown is wiped out by about $3k of value loss. Plan a longer hold.
- Berkeley County population projected at +25% by 2050 — long-run rental-demand tailwind backs the buy-and-hold thesis.
- At projected returns (-3.0% appreciation + 6.3% rent growth), your $25k cash investment doubles in ~5 years — after that, you're playing with house money.
Negotiation context
- Only 6 days on market — expect competitive offers; lowballing is unlikely to land.
Risks & watch-outs
- Watch-outs: built in 1940 — expect roof / HVAC / electrical / plumbing capex.
- Climate carrying-cost: extreme-heat days projected 7→16/yr by 2055 (HVAC capex compounding) — expect insurance premiums to compound above CPI over the hold.
Questions for the listing agent
- Built in 1940 — when were the roof, HVAC, electrical panel, plumbing, and water heater last replaced?
- Is there a deadline driving the sale (1031 exchange, divorce, estate, relocation)? That informs how much negotiation room exists.
- What's the average days-on-market for RENTAL listings here right now (not sales)? A rising rental-DOM trend means longer vacancies and softer asking-rent achievability than the comps imply.
- What's the recent tenant-quality profile in this submarket — average credit score on applications, eviction rate, late-payment / NSF rate, and stable-employment percentage? A property-management company in the area should have these aggregated.
- How much new for-sale + rental construction is in the pipeline within 1–3 miles? Heavy new supply typically softens prices + rents 12–24 months out; constrained supply supports both.
Investment metrics
- 1% rule
- 1.56% ✓
- Cap rate
- 13.93%
- Cash-on-cash
- 27.27%
- DSCR
- 2.21
- GRM
- 5.3
CMA / ARV
- ARV (on-the-fly)
- $263,292
- Comps found
- 12
Show comp detail 12 sales within ~0.75 mi
| Address | Dist | Beds/Ba | Sqft | Sold | Price | $/sf | Match |
|---|---|---|---|---|---|---|---|
| 212 Strine Ave | 0.04mi | 2/2.0 | 1,116 (-6%) | 3mo | $270,000 | $242 | 82 |
| 200 Rothwell Ave | 0.24mi | 3/2.0 (+1) | 1,152 (-3%) | 7mo | $229,000 | $199 | 69 |
| 210 Frederick St | 0.27mi | 3/1.0 (+1) | 1,250 (+5%) | 8mo | $46,000 | $37 | 67 |
| 334 Yoakum Ave | 0.46mi | 3/2.0 (+1) | 1,183 (-0%) | 4mo | $284,900 | $241 | 66 |
| 521 E Moler Ave | 0.22mi | 3/1.5 (+1) | 1,280 (+8%) | 7mo | $212,000 | $166 | 63 |
| 728 N High St | 0.05mi | 3/2.0 (+1) | 1,336 (+13%) | 6mo | $218,000 | $163 | 62 |
| 400 Athletic St | 0.46mi | 3/2.0 (+1) | 1,120 (-6%) | 9mo | $259,900 | $232 | 53 |
| 320 N Western Ave | 0.45mi | 3/2.0 (+1) | 1,100 (-7%) | 8mo | $246,500 | $224 | 51 |
| 327 Athletic St | 0.44mi | 3/2.0 (+1) | 1,056 (-11%) | 8mo | $234,500 | $222 | 46 |
| 313 Legion St | 0.58mi | 3/2.5 (+1) | 1,270 (+7%) | 8mo | $294,900 | $232 | 44 |
| 477 E Burke St | 0.71mi | 2/1.0 | 1,040 (-12%) | 7mo | $114,000 | $110 | 41 |
| 329 Randolph St | 0.74mi | 3/1.5 (+1) | 1,344 (+13%) | 9mo | $209,900 | $156 | 29 |
Match score weights: distance 35% · size 25% · config 20% · recency 20%. Top-matched comps best support the ARV.
Projected returns pro-forma
-3.0% appreciation · 6.3% rent growth · sell at horizon
- IRR
- 24.7%
- Equity multiple
- 2.06×
- Total profit
- $26,691
- Equity at exit
- $13,419
- IRR
- 34.4%
- Equity multiple
- 4.62×
- Total profit
- $91,298
- Equity at exit
- $7,782
Cash invested: $25,200 (down + closing). Projections, not guarantees.
Landlord ↔ Tenant lean methodology
- Overall (STATE)
- 83 Strongly Landlord-Friendly
- State West Virginia
- 83 Strongly Landlord-Friendly · R+22
- County
- — inherits STATE
- City
- — inherits STATE
ZIP-level market 25404
- Home prices YoY
- -10.7%
- Rents YoY
- 6.3%
- Active inventory
- 109
- Price-to-rent
- 5.3×
Monthly cashflow live
- Estimated rent
- $1,408 high interval (Pro) →
- Mortgage (P&I)
- −$472
- Tax from tax record
- −$30 /mo · $361/yr
- Insurance
- −$38
- HOA
- −$0
- Vacancy / Maint / Mgmt
- −$296
- Net cashflow
- $573
Break-even live
Sensitivity live
| Price | -10% $624 | -5% $598 | +0% $573 | +5% $547 | +10% $522 |
|---|---|---|---|---|---|
| Rent | -10% $461 | -5% $517 | +0% $573 | +5% $628 | +10% $684 |
| Rate | -1.0pp $618 | -0.5pp $596 | base $573 | +0.5pp $549 | +1.0pp $526 |
UW: 25.0% down · 7.5% · 30yr · 1.5% tax · 5.0% vac · 8.0% maint · 8.0% mgmt
Financing live
Cash to close
- Down payment
- $22,500
- Closing costs
- $2,700
- Reserves months
- —
- Total cash needed
- —
Loan-product check · same deal, 3 products live
Conventional
25% down · 7.5% · 30yr
- Down + closing
- —
- Monthly P&I
- —
- Monthly cashflow
- —
- DSCR
- —
- Eligible?
- —
Personal DTI + credit; lowest rate.
DSCR
20% down · 8.5% · 30yr
- Down + closing
- —
- Monthly P&I
- —
- Monthly cashflow
- —
- DSCR
- —
- Eligible?
- —
No personal income docs; deal must DSCR.
Hard money
10% down · 12.0% · 12mo
- Down + closing
- —
- Monthly P&I
- —
- Monthly cashflow
- —
- DSCR
- —
- Eligible?
- —
Short-term bridge; refi at stabilization.
Rent comps 25 comps
| Address | Beds | Baths | Sqft | Rent | $/sqft | DOM | Units | Dist |
|---|---|---|---|---|---|---|---|---|
| 721 2nd St Unit A Martinsburg, WV | 2.0 | 1.0 | 1412 | $1,180 | $0.84 | 14d | 1 | 0.09mi |
| 530 N 3rd St Unit B Martinsburg, WV | 1.0 | 1.0 | 1220 | $1,430 | $1.17 | 21d | 1 | 0.24mi |
| 316 N High St Martinsburg, WV | 3.0 | 1.5 | 1300 | $1,650 | $1.27 | 14d | 1 | 0.47mi |
| 117 E Martin St Unit 1 Martinsburg, WV | 2.0 | 1.0 | 800 | $1,200 | $1.50 | 14d | 1 | 0.61mi |
| 218 N College St Martinsburg, WV | 3.0 | 1.0 | 1200 | $1,330 | $1.11 | 21d | 1 | 0.63mi |
| 212 W Martin St Martinsburg, WV | 1.0 | 1.0 | 800 | $1,050 | $1.31 | 14d | 1 | 0.66mi |
| 116 S High St Martinsburg, WV | 2.0 | 1.0 | 1200 | $1,280 | $1.07 | 14d | 1 | 0.71mi |
| 1100 Myna Ct Martinsburg, WV | 2.0–3.0 | 2.0–2.5 | 1400 | $1,640 | $1.17 | 14d | 15 | 0.74mi |
| 226 N Raleigh St Martinsburg, WV | 3.0 | 1.0 | 1200 | $1,450 | $1.21 | 21d | 1 | 0.74mi |
| 200 E King St Martinsburg, WV | 2.0 | 1.0 | 900 | $900 | $1.00 | 14d | 1 | 0.79mi |
| 200 E King St Unit 10 Martinsburg, WV | 2.0 | 1.0 | 900 | $900 | $1.00 | 21d | 1 | 0.79mi |
| 589 Berkeley Cir Martinsburg, WV | 2.0 | 2.0 | 1160 | $1,970 | $1.70 | 13d | 1 | 0.80mi |
| 700 Thomas Ln Martinsburg, WV | 2.0 | 1.0 | 900 | $1,200 | $1.33 | 21d | 1 | 0.81mi |
| 704 Thomas Ln Martinsburg, WV | 2.0 | 1.0 | 950 | $1,300 | $1.37 | 21d | 1 | 0.84mi |
| 1123 Shepherdstown Rd Martinsburg, WV | 3.0 | 1.0 | 1429 | $1,900 | $1.33 | 21d | 1 | 0.86mi |
| 215 W King St Apt B Martinsburg, WV | 2.0 | 2.0 | 1192 | $1,690 | $1.42 | 21d | 1 | 0.86mi |
| 311 W King St Martinsburg, WV | 3.0 | 1.0 | 800 | $950 | $1.19 | 21d | 1 | 0.87mi |
| 320 W Stephen St Martinsburg, WV | 2.0 | 2.0 | 800 | $950 | $1.19 | 14d | 1 | 1.03mi |
| 19 Tevis Cir Martinsburg, WV | 2.0 | 2.0 | 1128 | $1,545 | $1.37 | 14d | 5 | 1.09mi |
| 600 W John St Martinsburg, WV | 1.0–2.0 | 1.0–2.0 | 976 | $2,026 | $2.08 | 14d | 14 | 1.09mi |
| 236 Trimble Ave Martinsburg, WV | 2.0 | 1.5 | 1200 | $1,350 | $1.12 | 14d | 1 | 1.12mi |
| 329 Porter Ave Martinsburg, WV | 2.0 | 1.0 | 800 | $1,000 | $1.25 | 14d | 1 | 1.22mi |
| 620 W Virginia Ave Martinsburg, WV | 3.0 | 1.0 | 1200 | $1,555 | $1.30 | 14d | 1 | 1.33mi |
| 653 Faulkner Ave Martinsburg, WV | 3.0 | 1.5 | 1442 | $1,450 | $1.01 | 21d | 1 | 1.45mi |
| 122 Garden Dr Martinsburg, WV | 1.0–3.0 | 1.0 | 829 | $900 | $1.09 | 14d | 24 | 1.46mi |
Listing history 2 events
-
2026-05-14status Pending
-
2026-05-08$90,000 Active
ⓘ Source: listings_history table (triggers on properties + properties_extension) + one-shot
backfill from property_details.listing_events for pre-trigger history.
Tax reassessment forecast WV · Resets to sale price
- Current annual tax
- $361 · $30/mo
- Projected year-2 tax
- $531 · $44/mo
- Expected delta
- +$170/yr (+$14/mo · 47.3%)
ⓘ Screening estimate from a state-policy table — verify with the county assessor before closing.
Climate risk First Street
- Flood 1/10 Low FEMA zone X (unshaded) · 0% chance over 30 yrs
- Wildfire 3/10 Moderate
- Heat 5/10 Major 7 d/yr ≥103°F today · 16 d/yr by 30 yrs out
- Wind 2/10 Low 2% chance of damaging wind over 30 yrs
- Air quality 2/10 Low 0 unhealthy d/yr today · 1 by 30 yrs out
Nearby sold comps map
Loading sold comps map…
Walkable amenities ~0.75 mi
Loading nearby amenities…
Taxation est. · year 1
- Rental income
- $16,894
- − Mortgage interest
- −$5,041
- − Property taxes
- −$361
- − Insurance
- −$450
- − Repairs & maintenance
- −$1,352
- − Management
- −$1,352
- − Depreciation
- −$2,618
- Taxable income
- $5,721
- Est. tax owed @ 24.0%
- −$1,373
- After-tax cash flow
- $5,499/yr
For passive investors: Depreciation is non-cash, so a rental often shows a tax loss while cash-flowing — sheltering income. Rental losses are passive: they offset passive income freely, and up to $25,000/yr can offset ordinary (W-2) income if you actively participate and your MAGI is under $100k (phasing out to $0 by $150k); unused losses carry forward. On sale, claimed depreciation is recaptured at up to 25%, and gains may owe capital-gains tax (a 1031 exchange can defer both). Figures are a year-1 estimate at your 24.0% rate — not tax advice; consult a CPA.
Schools (NCES district)
- District
- Berkeley County Schools
- NCES district ID
- 5400060
- Math proficiency
- 21% ▼ -12.00%
- Reading proficiency
- 38% ▼ -6.00%
- Median HH income
- $54,599
- Composite
- 26.16/100
- National rank
- #7273
- State rank
- #24 of 55 in WV
Livability — Martinsburg
- Score
- 75/100
- State rank
- #29
- US rank
- #4057
Category grades
Schools grade is shown separately in the Schools card above.
Census & demographics
- Census place
- Martinsburg, WV
- County
- Berkeley County · 85,235 people
- City population
- 55,439
- Metro
- Hagerstown-Martinsburg, MD-WV
- Population (ZIP)
- 23,990
- Household income
- $70,633
- Rent vs Own
- Severe rent burden
- 833.0
Population outlook (Berkeley County) Hauer SSP2
- Today (2025)
- 127,359 people
- By 2030
- 134,684 · +5.8%
- By 2040
- 148,219 · +16.4%
- By 2050
- 159,300 · +25.1%
- By 2075
- 179,920 · +41.3%
- By 2100
- 183,896 · +44.4%
Race, ethnicity, and origin ACS 2023
- Neighborhood character
- Predominantly White (78%)
- Race & ethnicity
- White 78% Black 9% Two or more races 8% Hispanic / Latino 7% Asian 1%
- Hispanic origin (detail)
- Mexican 3% Puerto Rican 1%
- Common ancestry
- Slovak 3% Romanian 3% Italian 1%
- Foreign-born
- 6% · Canada, South Korea
- Languages at home
- 94% English-only · Spanish 5%
Political lean MEDSL · Berkeley
- 2024 margin
- Solid R (+35.8) · D 31.2% · R 67.0% · Other 1.8%
- 2008→2024 swing
- -22.8pp toward R · 2008: -13.0pp · 2024: -35.8pp
- All cycles
- 2024: R+35.8 2020: R+31.2 2016: R+37.2 2012: R+21.3 2008: R+13.0
Not yet ingested
- Civics
- —
Market trends
- HPI YoY
- ▼ -24.58%
- Current HPI
- 205.3277
- Rent YoY
- ▲ 6.30%
- Metro
- Hagerstown-Martinsburg, MD-WV
- State GDP YoY
- —
- F500 in state
- 0
Price history
2 events — show timeline
- 2026-05-14 Pending — BRIGHT MLS
- 2026-05-08 Listed $90,000 BRIGHT MLS
Property tax history
-1.0%/yrLatest (2025): $361 · +17.9% YoY. Source: county tax records.
Cash-flow waterfall
monthlySold comps — $/sqft
last 12 mo · ≤1 miLoading sold comps…