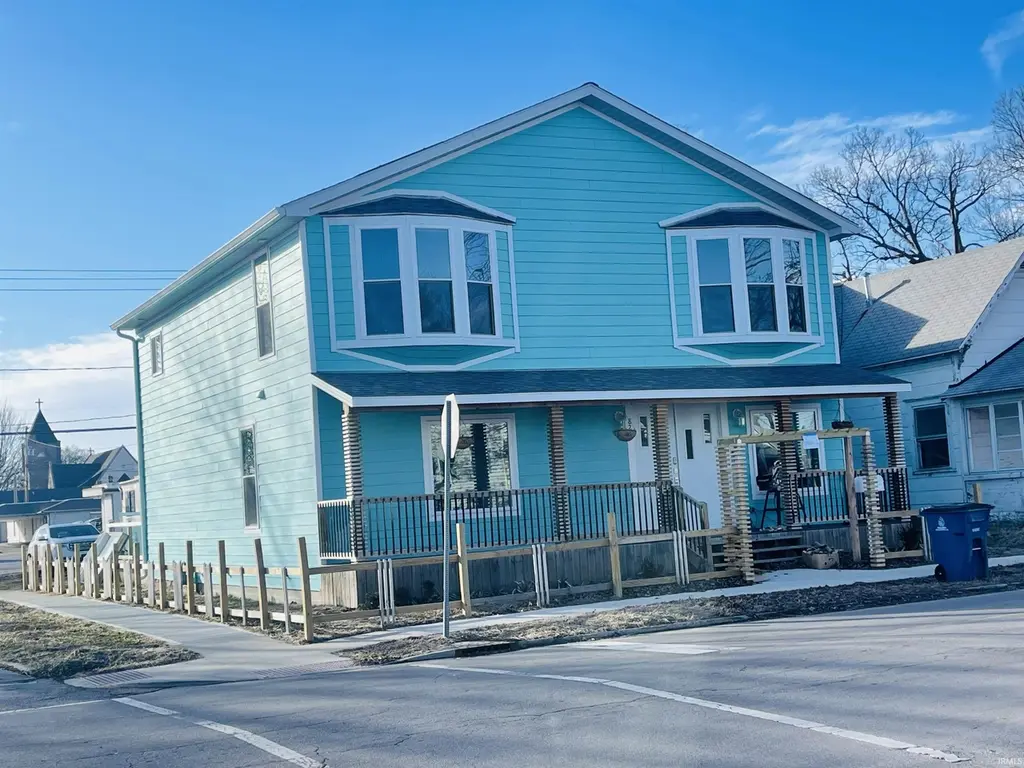
822 S Branson St · Marion, IN
Flood risk 1/10 · Minimal
- FEMA flood zone
- X (unshaded)
- Chance of flooding over 30 yrs
- 0.0%
- Est. flood insurance / yr
- $507 – $1,088
Fire risk 1/10 · Minimal
- Est. fire insurance / yr
- $717 – $1,331
Heat risk 3/10 · Minor
- Hot days now (above 100°F)
- 7 days/yr
- Hot days in 30 yrs
- 19 days/yr
Wind risk 2/10 · Minimal
- Chance of severe wind over 30 yrs
- —
Air-quality risk 2/10 · Minimal
- Unhealthy air days now
- 1 days/yr
- Unhealthy air days in 30 yrs
- 3 days/yr
Risk factors via First Street. Map © Google.
Why this score? — see what drove the D- grade
The composite is a weighted blend of 9 inputs, each scored 0–100. Each bar is that input's sub-score; the figure is the points it added to the 100-point composite (weight × sub-score).
- Cash flow +18.9/30.0
- DSCR +6.0/10.0
- 1% rule +4.9/10.0
- Livability +3.2/5.0
- Rent growth +2.5/5.0
- Condition / age +2.5/5.0
- Schools +1.7/10.0
- ARV discount +0.0/15.0
- Appreciation +0.0/10.0
$140,000
🖨 Deal sheet (PDF) 📄 Offer letter ✓ Due diligence
Listing remarks MLS
Charming, updated, and income-producing, this beautiful 5-bedroom, 3-bath property offers incredible flexibility as a thriving Bed & Breakfast or a spacious private residence. Currently operating as Branson House Bed & Breakfast (Bransonhousebb. com), the home blends timeless character with extensive modern updates, giving you both charm and peace of mind. Major improvements include a newer roof, two furnaces and two central air units, full rewiring and replumbing, a brand-new sewer line out front, a built-in whole-home dehumidifier system, and 13 solar panels for energy efficiency. Natural light fills the home, highlighting the inviting spaces, walk-in closets, and warm details throughout. Outside, an adorable new fence, welcoming walkway, and charming entry arch create unforgettable curb appeal. Whether you’re looking to continue operating a successful Bed & Breakfast, generate income while living onsite, or simply enjoy it as a spacious 5-bedroom, 3-bath home, this property offers versatility, efficiency, and abundant charm in one exceptional opportunity.
Key facts
- Full rewiring
- Newer roof
- Replumbing
Tags
Neighborhood map
What this means for you Summary
Snapshot
- This is a 3-bed/2.0-bath single-family listed at $140k.
Deal economics
- At list price, monthly cash flow is $143 ($2k/yr) — positive.
- The deal already cash-flows at list — no discount required.
- To meet the 1% rule (rent ≥ 1% of price), the offer needs to be $139k (0.8% below list).
- Recommended offer: $127k (9.0% below list) — sets the bar for market timing.
Location & tenants
- Location reads 65/100 on livability (#337 in IN) — a middle-class / working-renter tenant base. Strengths: crime A+, cost of living A+, housing A+; Watch: amenities F, commute F, employment F.
- Marion Community Schools (town): math 18% / reading 24% proficiency, ranked #277 of 301 in IN (top 92%) — low school quality limits family demand, transient renter base, plan for 1-2y turnover; 67% free/reduced lunch — lower-income household profile, screen leases tightly.
- Zoned schools: Riverview Elementary School (math 42% / reading 27%, grade F, #597 of 994 statewide, top 63%, 396 students, 72% FRL); John L Mcculloch Junior High Sch (math 11% / reading 22%, grade F, #287 of 330 statewide, top 88%, 524 students, 74% FRL); Marion High School (math 12% / reading 47%, grade F, #308 of 369 statewide, top 84%, 1,050 students, 66% FRL) — zoned schools at 71% FRL track the district average.
- Market conditions: 114 active listings in the ZIP; 1 comparable units currently listed for rent nearby; 52 units permitted in Grant County in 2024 (8 in 5+ unit buildings).
- This rent runs 36% of the median local income ($46k/yr) — at the standard rent-burdened threshold; future hikes will face affordability resistance.
Forward outlook
- Local home prices are declining (-3.0%/yr); year-one equity from $968 of loan paydown is wiped out by about $4k of value loss. Plan a longer hold.
- Grant County population projected at -18% by 2050 — secular population decline; favor cash flow + early exit over multi-decade hold.
Negotiation context
- It's been on market 103 days — a 9% lower offer ($127k) is reasonable based on typical stale-listing flexibility.
- 2 sale attempts since 2y ago with the ask held roughly flat each time — persistent listings suggest the price (not the market) is what's stuck; bring a comps-based counter.
Questions for the listing agent
- It's been on market 103 days. Have you received any prior offers? Is the seller open to a 9% concession, seller financing, or rate buy-down credit?
- Why hasn't it sold? Are there any deal-killer items the seller is aware of (foundation, flood, title, zoning, code violations)?
- Is there a deadline driving the sale (1031 exchange, divorce, estate, relocation)? That informs how much negotiation room exists.
- Schools are F-rated, which usually means shorter tenancies and higher turnover. Who's the typical renter profile here, and what's been the actual vacancy rate?
- The area grade is low — what's the realistic commute time and amenity access for the typical tenant pool here? Any planned neighborhood developments (good or bad) we should know about?
- What's the average days-on-market for RENTAL listings here right now (not sales)? A rising rental-DOM trend means longer vacancies and softer asking-rent achievability than the comps imply.
- What's the recent tenant-quality profile in this submarket — average credit score on applications, eviction rate, late-payment / NSF rate, and stable-employment percentage? A property-management company in the area should have these aggregated.
- How much new for-sale + rental construction is in the pipeline within 1–3 miles? Heavy new supply typically softens prices + rents 12–24 months out; constrained supply supports both.
Investment metrics
- 1% rule
- 0.99% ✗
- Cap rate
- 7.52%
- Cash-on-cash
- 4.38%
- DSCR
- 1.20
- GRM
- 8.4
CMA / ARV
- ARV (median comp)
- $105,199
- List price
- $140,000
- Delta
- 33.08%
- Verdict
- OVERPRICED
- Comps
- 20 within 1.0 mi
Show comp detail 9 sales within ~0.75 mi
| Address | Dist | Beds/Ba | Sqft | Sold | Price | $/sf | Match |
|---|---|---|---|---|---|---|---|
| 608 W 3rd St | 0.58mi | 3/1.5 | 2,699 (-0%) | 1mo | $67,000 | $25 | 70 |
| 620 W 6th St | 0.51mi | 4/2.0 (+1) | 2,678 (-1%) | 6mo | $105,000 | $39 | 64 |
| 815 S Boots St | 0.17mi | 4/2.0 (+1) | 3,070 (+14%) | 15mo | $13,000 | $4 | 52 |
| 720 W 7th St | 0.55mi | 2/1.5 (-1) | 2,808 (+4%) | 15mo | $60,000 | $21 | 49 |
| 614 W Nelson St | 0.73mi | 3/1.5 | 2,470 (-9%) | 12mo | $122,000 | $49 | 40 |
| 512 W 1st St | 0.66mi | 3/1.0 | 2,396 (-12%) | 14mo | $69,900 | $29 | 35 |
| 205 N Nebraska St | 0.66mi | 3/2.0 | 2,400 (-11%) | 20mo | $172,500 | $72 | 33 |
| 803 W 2nd St | 0.71mi | 3/2.0 | 2,300 (-15%) | 12mo | $123,500 | $54 | 32 |
| 204 S Race St | 0.57mi | 4/4.0 (+1) | 2,336 (-14%) | 20mo | $30,000 | $13 | 21 |
Match score weights: distance 35% · size 25% · config 20% · recency 20%. Top-matched comps best support the ARV.
Projected returns pro-forma
-3.0% appreciation · 3.0% rent growth · sell at horizon
- IRR
- -9.4%
- Equity multiple
- 0.65×
- Total profit
- $-13,554
- Equity at exit
- $20,874
- IRR
- -0.0%
- Equity multiple
- 1.00×
- Total profit
- $-8
- Equity at exit
- $12,105
Cash invested: $39,200 (down + closing). Projections, not guarantees.
Landlord ↔ Tenant lean methodology
- Overall (STATE)
- 90 Strongly Landlord-Friendly
- State Indiana
- 90 Strongly Landlord-Friendly · R+11
- County
- — inherits STATE
- City
- — inherits STATE
ZIP-level market 46953
- Home prices YoY
- -23.4%
- Active inventory
- 114
- Price-to-rent
- 8.4×
Monthly cashflow live
- Estimated rent
- $1,389 medium interval (Pro) →
- Mortgage (P&I)
- −$734
- Tax from tax record
- −$162 /mo · $1,940/yr
- Insurance
- −$58
- HOA
- −$0
- Vacancy / Maint / Mgmt
- −$292
- Net cashflow
- $143
Break-even live
Sensitivity live
| Price | -10% $222 | -5% $183 | +0% $143 | +5% $104 | +10% $64 |
|---|---|---|---|---|---|
| Rent | -10% $33 | -5% $88 | +0% $143 | +5% $198 | +10% $253 |
| Rate | -1.0pp $214 | -0.5pp $179 | base $143 | +0.5pp $107 | +1.0pp $70 |
UW: 25.0% down · 7.5% · 30yr · 1.5% tax · 5.0% vac · 8.0% maint · 8.0% mgmt
Financing live
Cash to close
- Down payment
- $35,000
- Closing costs
- $4,200
- Reserves months
- —
- Total cash needed
- —
Loan-product check · same deal, 3 products live
Conventional
25% down · 7.5% · 30yr
- Down + closing
- —
- Monthly P&I
- —
- Monthly cashflow
- —
- DSCR
- —
- Eligible?
- —
Personal DTI + credit; lowest rate.
DSCR
20% down · 8.5% · 30yr
- Down + closing
- —
- Monthly P&I
- —
- Monthly cashflow
- —
- DSCR
- —
- Eligible?
- —
No personal income docs; deal must DSCR.
Hard money
10% down · 12.0% · 12mo
- Down + closing
- —
- Monthly P&I
- —
- Monthly cashflow
- —
- DSCR
- —
- Eligible?
- —
Short-term bridge; refi at stabilization.
Rent comps 1 comps
| Address | Beds | Baths | Sqft | Rent | $/sqft | DOM | Units | Dist |
|---|---|---|---|---|---|---|---|---|
| 511 W Buckingham Dr Marion, IN | 3.0 | 2.0 | 1942 | $2,000 | $1.03 | 45d | 1 | 1.30mi |
Listing history 10 events
-
2026-06-09days on market $140,000 Active 103 DOM
-
2026-06-08days on market $140,000 Active 102 DOM
-
2026-06-07days on market $140,000 Active 101 DOM
-
2026-06-02days on market $140,000 Active 96 DOM
-
2026-06-01days on market $140,000 Active 95 DOM
-
2026-05-31days on market $140,000 Active 94 DOM
-
2026-05-30days on market $140,000 Active 93 DOM
-
2026-05-14historical Active Under Contract 1098-char remark
Show marketing remark (1098 chars)
Charming, updated, and income-producing, this beautiful 5-bedroom, 3-bath property offers incredible flexibility as a thriving Bed & Breakfast or a spacious private residence. Currently operating as Branson House Bed & Breakfast (Bransonhousebb. com), the home blends timeless character with extensive modern updates, giving you both charm and peace of mind. Major improvements include a newer roof, two furnaces and two central air units, full rewiring and replumbing, a brand-new sewer line out front, a built-in whole-home dehumidifier system, and 13 solar panels for energy efficiency. Natural light fills the home, highlighting the inviting spaces, walk-in closets, and warm details throughout. Outside, an adorable new fence, welcoming walkway, and charming entry arch create unforgettable curb appeal. Whether you’re looking to continue operating a successful Bed & Breakfast, generate income while living onsite, or simply enjoy it as a spacious 5-bedroom, 3-bath home, this property offers versatility, efficiency, and abundant charm in one exceptional opportunity.
-
2026-02-26$140,000 Active 1098-char remark
Show marketing remark (1098 chars)
Charming, updated, and income-producing, this beautiful 5-bedroom, 3-bath property offers incredible flexibility as a thriving Bed & Breakfast or a spacious private residence. Currently operating as Branson House Bed & Breakfast (Bransonhousebb. com), the home blends timeless character with extensive modern updates, giving you both charm and peace of mind. Major improvements include a newer roof, two furnaces and two central air units, full rewiring and replumbing, a brand-new sewer line out front, a built-in whole-home dehumidifier system, and 13 solar panels for energy efficiency. Natural light fills the home, highlighting the inviting spaces, walk-in closets, and warm details throughout. Outside, an adorable new fence, welcoming walkway, and charming entry arch create unforgettable curb appeal. Whether you’re looking to continue operating a successful Bed & Breakfast, generate income while living onsite, or simply enjoy it as a spacious 5-bedroom, 3-bath home, this property offers versatility, efficiency, and abundant charm in one exceptional opportunity.
-
2024-08-19$365,000 Active
ⓘ Source: listings_history table (triggers on properties + properties_extension) + one-shot
backfill from property_details.listing_events for pre-trigger history.
Tax reassessment forecast IN · Partial reset (capped growth)
- Current annual tax
- $1,940 · $162/mo
- Projected year-2 tax
- $1,940 · $162/mo
- Expected delta
- $0/yr ($0/mo · 0.0%)
ⓘ Screening estimate from a state-policy table — verify with the county assessor before closing.
Climate risk First Street
- Flood 1/10 Low FEMA zone X (unshaded) · 0% chance over 30 yrs
- Wildfire 1/10 Low
- Heat 3/10 Moderate 7 d/yr ≥100°F today · 19 d/yr by 30 yrs out
- Wind 2/10 Low
- Air quality 2/10 Low 1 unhealthy d/yr today · 3 by 30 yrs out
Nearby sold comps map
Loading sold comps map…
Walkable amenities ~0.75 mi
Loading nearby amenities…
Taxation est. · year 1
- Rental income
- $16,669
- − Mortgage interest
- −$7,842
- − Property taxes
- −$1,940
- − Insurance
- −$700
- − Repairs & maintenance
- −$1,333
- − Management
- −$1,333
- − Depreciation
- −$4,073
- Taxable loss
- −$553
- Est. tax savings @ 24.0%
- +$133
- After-tax cash flow
- $1,851/yr
For passive investors: Depreciation is non-cash, so a rental often shows a tax loss while cash-flowing — sheltering income. Rental losses are passive: they offset passive income freely, and up to $25,000/yr can offset ordinary (W-2) income if you actively participate and your MAGI is under $100k (phasing out to $0 by $150k); unused losses carry forward. On sale, claimed depreciation is recaptured at up to 25%, and gains may owe capital-gains tax (a 1031 exchange can defer both). Figures are a year-1 estimate at your 24.0% rate — not tax advice; consult a CPA.
Schools (NCES district)
- District
- Marion Community Schools
- NCES district ID
- 1806390
- Math proficiency
- 18% ▼ -9.00%
- Reading proficiency
- 24% ▼ -6.00%
- Median HH income
- $33,415
- Composite
- 17.13/100
- National rank
- #9115
- State rank
- #277 of 301 in IN
Livability — Marion
- Score
- 65/100
- State rank
- #337
- US rank
- #13006
Category grades
Schools grade is shown separately in the Schools card above.
Census & demographics
- Census place
- Marion, IN
- County
- Grant County · 41,561 people
- City population
- 41,561
- Metro
- Marion, IN
- Population (ZIP)
- 23,372
- Household income
- $46,288
- Rent vs Own
- Severe rent burden
- 597.0
Population outlook (Grant County) Hauer SSP2
- Today (2025)
- 64,394 people
- By 2030
- 62,145 · -3.5%
- By 2040
- 57,252 · -11.1%
- By 2050
- 52,968 · -17.7%
- By 2075
- 45,986 · -28.6%
- By 2100
- 39,400 · -38.8%
Race, ethnicity, and origin ACS 2023
- Neighborhood character
- Predominantly White (77%)
- Race & ethnicity
- White 77% Black 10% Two or more races 9% Hispanic / Latino 6%
- Hispanic origin (detail)
- Mexican 4%
- Common ancestry
- Italian 3% Iranian 1% Slovak 1%
- Foreign-born
- 2% · Canada
- Languages at home
- 96% English-only · Spanish 3%
Political lean MEDSL · Grant
- 2024 margin
- Solid R (+41.8) · D 28.2% · R 70.0% · Other 1.9%
- 2008→2024 swing
- -28.7pp toward R · 2008: -13.1pp · 2024: -41.8pp
- All cycles
- 2024: R+41.8 2020: R+38.8 2016: R+39.5 2012: R+22.0 2008: R+13.1
Not yet ingested
- Civics
- —
Market trends
- HPI YoY
- ▼ -52.47%
- Current HPI
- 171.7246
- Rent YoY
- —
- Metro
- Marion, IN
- State GDP YoY
- ▲ 2.90%
- F500 in state
- 18
Industry mix (Fortune 500 HQ in IN)
| Industry | F500 HQs | Revenue |
|---|---|---|
| Industrial Machinery | 2 | $37B |
|
||
| Healthcare | 1 | $177B |
|
||
| Pharmaceuticals | 1 | $45B |
|
||
| Metals / Steel | 1 | $18B |
|
||
| Agriculture | 1 | $17B |
|
||
| Packaging | 1 | $12B |
|
||
Price history
-61.6% since first listed3 events — show timeline
- 2026-05-14 Contingent — IRMLS
- 2026-02-26 Listed $140,000 IRMLS
- 2024-08-19 Listed $365,000 IRMLS
Property tax history
+12.8%/yrLatest (2025): $1,940 · +122.0% YoY. Source: county tax records.
Cash-flow waterfall
monthlySold comps — $/sqft
last 12 mo · ≤1 miLoading sold comps…