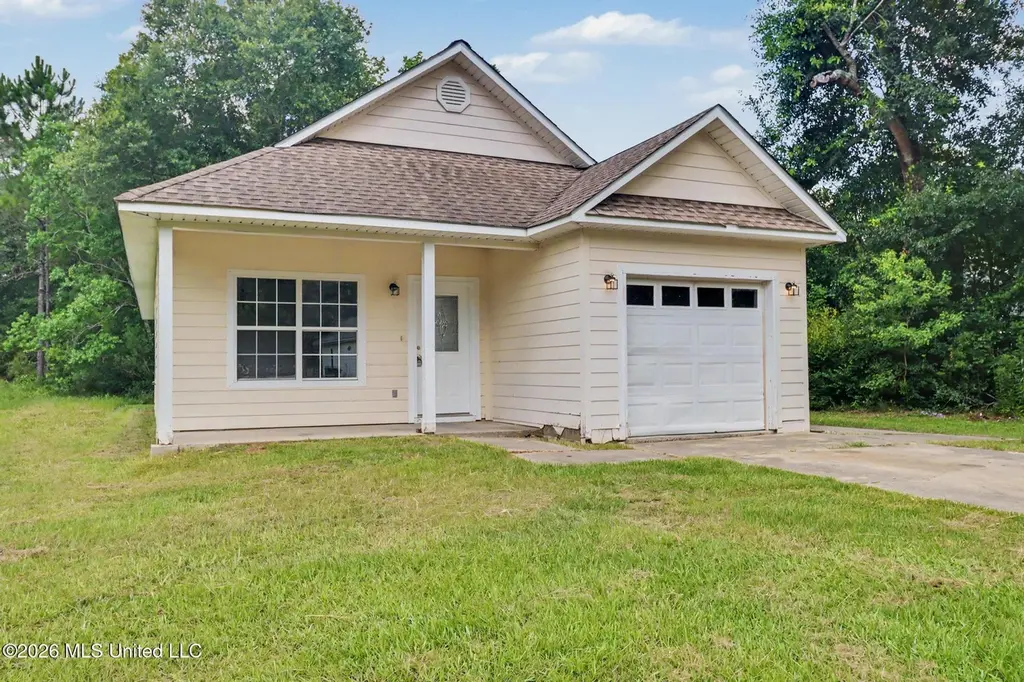
11609 Oaklane Dr · Gulfport, MS
Flood risk 4/10 · Minor
- FEMA flood zone
- X (shaded)
- Chance of flooding over 30 yrs
- 0.24%
- Est. flood insurance / yr
- $507 – $1,088
Fire risk 4/10 · Minor
- Est. fire insurance / yr
- $1,241 – $2,305
Heat risk 10/10 · Severe
- Hot days now (above 108°F)
- 7 days/yr
- Hot days in 30 yrs
- 22 days/yr
Wind risk 9/10 · Severe
- Chance of severe wind over 30 yrs
- 99.0%
Air-quality risk 1/10 · Minimal
- Unhealthy air days now
- 0 days/yr
- Unhealthy air days in 30 yrs
- 0 days/yr
Risk factors via First Street. Map © Google.
Why this score? — see what drove the B- grade
The composite is a weighted blend of 9 inputs, each scored 0–100. Each bar is that input's sub-score; the figure is the points it added to the 100-point composite (weight × sub-score).
- Cash flow +26.2/30.0
- ARV discount +9.5/15.0
- DSCR +8.9/10.0
- 1% rule +6.2/10.0
- Rent growth +4.2/5.0
- Schools +4.2/10.0
- Livability +3.7/5.0
- Condition / age +2.5/5.0
- Appreciation +0.0/10.0
$154,900
🖨 Deal sheet (PDF) 📄 Offer letter ✓ Due diligence
Listing remarks
Welcome home to 11609 Oaklane Drive in north Gulfport! This move-in ready 3-bedroom, 2-bath home was built in 2006 and sits on a generous quarter-acre lot — offering plenty of outdoor space to enjoy. At 1,254 square feet, the layout is comfortable and efficient, with a single-car garage adding convenience and extra storage. Fresh paint throughout gives the home a clean, bright feel the moment you walk in, while brand new luxury vinyl flooring adds a modern touch that's as durable as it is beautiful. The kitchen shines with granite countertops, and the entire home has been professionally cleaned from top to bottom — all you need to do is unpack. Located in the highly sought-after
Key facts
- 0.24 acre lot
- Garage
- Built 2006
Property features AI
Exterior
- Parking: 1-car garage; 2 total parking spaces; Concrete parking
- Security: Smoke detector(s); Dead bolt locks
- Utilities: Public water; Public sewer; Electricity connected; Sewer connected; Water connected; Cable available
- Home design: Single-family residence (house); One story; Move-in ready
- Construction: Cement siding; Architectural shingle roof; Slab foundation; Built (year source: public records)
- Exterior features: Front porch; City lot; Level lot
Interior
- Kitchen: Dishwasher; Disposal; Electric range; Microwave; Refrigerator; Granite counters; Breakfast bar
- Flooring: Luxury vinyl; Ceramic tile
- Bathrooms: 2 full bathrooms
- Heating & cooling: Central electric heating; Central electric cooling; Ceiling fans
- Interior features: Ceiling fans; High ceilings; Breakfast bar; Granite counters; Insulated windows; Dead bolt locks
- Laundry & utility: Washer hookup (main level, inside); Electric dryer hookup
Neighborhood map
What this means for you Summary
Snapshot
- This is a 3-bed/1.0-bath single-family listed at $155k.
Deal economics
- At list price, monthly cash flow is $395 ($5k/yr) — positive.
- The deal already cash-flows at list — no discount required.
- Meets the 1% rule at list price ($2k rent vs $155k).
- Cap rate 9.4% vs local median 4.9% in Gulfport — top-decile yield for the area; either an underpriced asset or a hidden risk that comps aren't pricing in. Stress-test before assuming the spread holds.
Location & tenants
- Location reads 73/100 on livability (#15 in MS) — a middle-class / working-renter tenant base. Strengths: cost of living A+, housing A+, health & safety A+; Watch: amenities F, commute F, employment F.
- Harrison County School District (rural): math 52% / reading 46% proficiency, ranked #14 of 130 in MS (top 11%) — families likely to look elsewhere, expect single-tenant / working-renter base with shorter leases; 62% free/reduced lunch — lower-income household profile, screen leases tightly.
- Zoned schools: Harrison Central Elementary (math 52% / reading 37%, grade F, #92 of 375 statewide, top 26%, 472 students, 99% FRL); West Harrison Middle School (653 students, 100% FRL); West Harrison High School (math 57% / reading 52%, grade C-, #10 of 197 statewide, top 5%, 1,124 students, 100% FRL) — zoned schools average 100% FRL vs 62% district-wide (37 pts higher); higher-poverty schools than district average — tighter screening recommended.
- Market conditions: Rents rising fast (+7.0%/yr); 770 active listings in the ZIP; 9 comparable units currently listed for rent nearby; rentals lingering (median 46d on market — plan ~5-8 weeks vacancy on turnover, expect pricing pressure); 56% of comp listings sitting > 30 days — soft ceiling on asking rent; 2,194 units permitted in Harrison County in 2024 (0 in 5+ unit buildings).
- This rent runs 33% of the median local income ($63k/yr) — at the standard rent-burdened threshold; future hikes will face affordability resistance.
Forward outlook
- Local home prices are declining (-3.0%/yr); year-one equity from $1k of loan paydown is wiped out by about $5k of value loss. Plan a longer hold.
- Harrison County population projected at +27% by 2050 — long-run rental-demand tailwind backs the buy-and-hold thesis.
- At projected returns (-3.0% appreciation + 7.0% rent growth), your $43k cash investment doubles in ~8 years — after that, you're playing with house money.
Negotiation context
- Only 8 days on market — expect competitive offers; lowballing is unlikely to land.
- 2 sale attempts since 19y ago with the ask held roughly flat each time — persistent listings suggest the price (not the market) is what's stuck; bring a comps-based counter.
Risks & watch-outs
- Climate carrying-cost: severe wind risk, 99% chance of damaging wind over 30y; extreme-heat days projected 7→22/yr by 2055 (HVAC capex compounding) — expect insurance premiums to compound above CPI over the hold.
Questions for the listing agent
- Is there a deadline driving the sale (1031 exchange, divorce, estate, relocation)? That informs how much negotiation room exists.
- Schools are D-rated, which usually means shorter tenancies and higher turnover. Who's the typical renter profile here, and what's been the actual vacancy rate?
- What's the average days-on-market for RENTAL listings here right now (not sales)? A rising rental-DOM trend means longer vacancies and softer asking-rent achievability than the comps imply.
- What's the recent tenant-quality profile in this submarket — average credit score on applications, eviction rate, late-payment / NSF rate, and stable-employment percentage? A property-management company in the area should have these aggregated.
- How much new for-sale + rental construction is in the pipeline within 1–3 miles? Heavy new supply typically softens prices + rents 12–24 months out; constrained supply supports both.
Investment metrics
- 1% rule
- 1.12% ✓
- Cap rate
- 9.35%
- Cash-on-cash
- 10.93%
- DSCR
- 1.49
- GRM
- 7.4
CMA / ARV
- ARV (on-the-fly)
- $162,140
- Comps found
- 12
Show comp detail 12 sales within ~0.75 mi
| Address | Dist | Beds/Ba | Sqft | Sold | Price | $/sf | Match |
|---|---|---|---|---|---|---|---|
| 11619 Acorn Dr | 0.16mi | 3/2.0 | 1,216 (+0%) | 7mo | $165,000 | $136 | 82 |
| 11597 Oaklane Dr | 0.04mi | 3/2.0 | 1,260 (+4%) | 8mo | $145,000 | $115 | 80 |
| 11599 Acorn Dr | 0.13mi | 3/2.0 | 1,260 (+4%) | 11mo | $120,000 | $95 | 74 |
| 11591 Oaklane Dr | 0.03mi | 3/2.0 | 1,256 (+4%) | 18mo | $139,000 | $111 | 73 |
| 11611 Acorn Dr | 0.15mi | 3/2.0 | 1,216 (+0%) | 18mo | $175,000 | $144 | 73 |
| 11580 Acorn Dr | 0.13mi | 3/2.0 | 1,278 (+6%) | 10mo | $139,900 | $109 | 72 |
| 12059 Five Oaks Cir | 0.49mi | 3/2.0 | 1,251 (+3%) | 4mo | $169,900 | $136 | 64 |
| 11512 Acorn Dr | 0.19mi | 3/2.0 | 1,266 (+5%) | 23mo | $144,000 | $114 | 60 |
| 16383 Clearwater Cir | 0.36mi | 3/2.0 | 1,289 (+6%) | 10mo | $187,900 | $146 | 60 |
| 12115 Five Oaks Dr | 0.55mi | 3/2.0 | 1,297 (+7%) | 1mo | $184,900 | $143 | 58 |
| 16364 Clearwater Cir | 0.35mi | 3/2.0 | 1,272 (+5%) | 18mo | $170,000 | $134 | 56 |
| 16392 Clearwater Cir | 0.37mi | 3/2.0 | 1,343 (+11%) | 19mo | $179,900 | $134 | 45 |
Match score weights: distance 35% · size 25% · config 20% · recency 20%. Top-matched comps best support the ARV.
Projected returns pro-forma
-3.0% appreciation · 6.99% rent growth · sell at horizon
- IRR
- 4.2%
- Equity multiple
- 1.17×
- Total profit
- $7,281
- Equity at exit
- $23,096
- IRR
- 16.9%
- Equity multiple
- 2.63×
- Total profit
- $70,899
- Equity at exit
- $13,393
Cash invested: $43,372 (down + closing). Projections, not guarantees.
Landlord ↔ Tenant lean methodology
- Overall (STATE)
- 90 Strongly Landlord-Friendly
- State Mississippi
- 90 Strongly Landlord-Friendly · R+11
- County
- — inherits STATE
- City
- — inherits STATE
ZIP-level market 39503
- Home prices YoY
- -21.5%
- Rents YoY
- 7.0%
- Active inventory
- 770
- Price-to-rent
- 7.4×
Monthly cashflow live
- Estimated rent
- $1,735 high interval (Pro) →
- Mortgage (P&I)
- −$812
- Tax from tax record
- −$99 /mo · $1,184/yr
- Insurance
- −$65
- HOA
- −$0
- Vacancy / Maint / Mgmt
- −$364
- Net cashflow
- $395
Break-even live
Sensitivity live
| Price | -10% $483 | -5% $439 | +0% $395 | +5% $351 | +10% $307 |
|---|---|---|---|---|---|
| Rent | -10% $258 | -5% $327 | +0% $395 | +5% $464 | +10% $532 |
| Rate | -1.0pp $473 | -0.5pp $435 | base $395 | +0.5pp $355 | +1.0pp $314 |
UW: 25.0% down · 7.5% · 30yr · 1.5% tax · 5.0% vac · 8.0% maint · 8.0% mgmt
Financing live
Cash to close
- Down payment
- $38,725
- Closing costs
- $4,647
- Reserves months
- —
- Total cash needed
- —
Loan-product check · same deal, 3 products live
Conventional
25% down · 7.5% · 30yr
- Down + closing
- —
- Monthly P&I
- —
- Monthly cashflow
- —
- DSCR
- —
- Eligible?
- —
Personal DTI + credit; lowest rate.
DSCR
20% down · 8.5% · 30yr
- Down + closing
- —
- Monthly P&I
- —
- Monthly cashflow
- —
- DSCR
- —
- Eligible?
- —
No personal income docs; deal must DSCR.
Hard money
10% down · 12.0% · 12mo
- Down + closing
- —
- Monthly P&I
- —
- Monthly cashflow
- —
- DSCR
- —
- Eligible?
- —
Short-term bridge; refi at stabilization.
Rent comps 9 comps
| Address | Beds | Baths | Sqft | Rent | $/sqft | DOM | Units | Dist |
|---|---|---|---|---|---|---|---|---|
| 12237 Vada Dr Gulfport, MS | 3.0 | 1.0 | 1350 | $1,349 | $1.00 | 15d | 1 | 0.80mi |
| 15373 Saint Charles St Gulfport, MS | 3.0 | 1.0–3.0 | 1075 | $1,350 | $1.26 | 45d | 2 | 1.03mi |
| 11425 Camden Court Cir Gulfport, MS | 3.0 | 2.0 | 1495 | $1,775 | $1.19 | 23d | 1 | 1.22mi |
| 11413 Camden Court Cir Gulfport, MS | 3.0 | 2.0 | 1495 | $1,775 | $1.19 | 45d | 1 | 1.22mi |
| 11487 Camden Court Cir Gulfport, MS | 3.0 | 2.0 | 1495 | $1,775 | $1.19 | 45d | 1 | 1.22mi |
| 11405 Camden Court Cir Gulfport, MS | 3.0 | 2.0 | 1495 | $1,775 | $1.19 | 45d | 1 | 1.22mi |
| 11502 Camden Court Cir Gulfport, MS | 3.0 | 2.0 | 1495 | $1,775 | $1.19 | 23d | 1 | 1.28mi |
| 11213 Dobson Rd Gulfport, MS | 2.0 | 1.0 | 900 | $1,200 | $1.33 | 45d | 1 | 1.34mi |
| 18052 Green Leaves Dr Gulfport, MS | 3.0 | 2.0 | 1485 | $1,800 | $1.21 | 23d | 1 | 1.47mi |
Listing history 7 events
-
2026-06-21days on market $154,900 Active 8 DOM
-
2026-06-18days on market $154,900 Active 5 DOM
-
2026-06-17days on market $154,900 Active 4 DOM
-
2026-06-16days on market $154,900 Active 3 DOM
-
2026-06-15days on market $154,900 Active 2 DOM
-
2026-06-14remarks 687-char remark
-
2026-06-14$154,900 Active 1 DOM
ⓘ Source: listings_history table (triggers on properties + properties_extension) + one-shot
backfill from property_details.listing_events for pre-trigger history.
Tax reassessment forecast MS · Resets to sale price
- Current annual tax
- $1,184 · $99/mo
- Projected year-2 tax
- $1,224 · $102/mo
- Expected delta
- +$39/yr (+$3/mo · 3.3%)
ⓘ Screening estimate from a state-policy table — verify with the county assessor before closing.
Climate risk First Street
- Flood 4/10 Moderate FEMA zone X (shaded) · 24% chance over 30 yrs
- Wildfire 4/10 Moderate
- Heat 10/10 Extreme 7 d/yr ≥108°F today · 22 d/yr by 30 yrs out
- Wind 9/10 Extreme 99% chance of damaging wind over 30 yrs
- Air quality 1/10 Low 0 unhealthy d/yr today · 0 by 30 yrs out
Nearby sold comps map
Loading sold comps map…
Walkable amenities ~0.75 mi
Loading nearby amenities…
Taxation est. · year 1
- Rental income
- $20,821
- − Mortgage interest
- −$8,677
- − Property taxes
- −$1,184
- − Insurance
- −$774
- − Repairs & maintenance
- −$1,666
- − Management
- −$1,666
- − Depreciation
- −$4,506
- Taxable income
- $2,348
- Est. tax owed @ 24.0%
- −$563
- After-tax cash flow
- $4,179/yr
For passive investors: Depreciation is non-cash, so a rental often shows a tax loss while cash-flowing — sheltering income. Rental losses are passive: they offset passive income freely, and up to $25,000/yr can offset ordinary (W-2) income if you actively participate and your MAGI is under $100k (phasing out to $0 by $150k); unused losses carry forward. On sale, claimed depreciation is recaptured at up to 25%, and gains may owe capital-gains tax (a 1031 exchange can defer both). Figures are a year-1 estimate at your 24.0% rate — not tax advice; consult a CPA.
Schools (NCES district)
- District
- Harrison County School District
- NCES district ID
- 2801770
- Math proficiency
- 52% ▼ -4.00%
- Reading proficiency
- 46% ▼ -4.00%
- Median HH income
- $46,504
- Composite
- 41.66/100
- National rank
- #3419
- State rank
- #14 of 130 in MS
Livability — Gulfport
- Score
- 73/100
- State rank
- #15
- US rank
- #5010
Category grades
Schools grade is shown separately in the Schools card above.
Census & demographics
- County
- Harrison County · 178,171 people
- City population
- 96,188
- Metro
- Gulfport-Biloxi, MS
- Population (ZIP)
- 55,059
- Household income
- $62,641
- Rent vs Own
- Severe rent burden
- 1686.0
Population outlook (Harrison County) Hauer SSP2
- Today (2025)
- 228,444 people
- By 2030
- 241,942 · +5.9%
- By 2040
- 267,531 · +17.1%
- By 2050
- 291,062 · +27.4%
- By 2075
- 346,711 · +51.8%
- By 2100
- 378,165 · +65.5%
Race, ethnicity, and origin ACS 2023
- Neighborhood character
- Diverse neighborhood (Simpson 0.58)
- Race & ethnicity
- White 58% Black 27% Two or more races 9% Hispanic / Latino 6% Asian 2%
- Hispanic origin (detail)
- Mexican 2% Puerto Rican 1%
- Common ancestry
- Lithuanian 5% Slovak 1% Portuguese 1%
- Foreign-born
- 3% · Canada
- Languages at home
- 95% English-only · Spanish 3%
Political lean MEDSL · Harrison
- 2024 margin
- Strong R (+28.9) · D 35.0% · R 63.9% · Other 1.1%
- 2008→2024 swing
- -2.9pp toward R · 2008: -26.0pp · 2024: -28.9pp
- All cycles
- 2024: R+28.9 2020: R+25.2 2016: R+30.7 2012: R+26.6 2008: R+26.0
Not yet ingested
- Civics
- —
Market trends
- HPI YoY
- ▼ -51.39%
- Current HPI
- 187.285
- Rent YoY
- ▲ 6.99%
- Metro
- Gulfport-Biloxi, MS
- State GDP YoY
- —
- F500 in state
- 0
Price history
-8.8% since first listed4 events — show timeline
- 2026-06-13 Listed $154,900 MLSU
- 2007-05-01 Sold (Public Records) — Public Records
- 2007-04-25 Sold (MLS) — MLSU
- 2007-03-11 Listed $169,900 MLSU
Property tax history
+0.8%/yrLatest (2025): $1,184 · +5.0% YoY. Source: county tax records.
Cash-flow waterfall
monthlySold comps — $/sqft
last 12 mo · ≤1 miLoading sold comps…