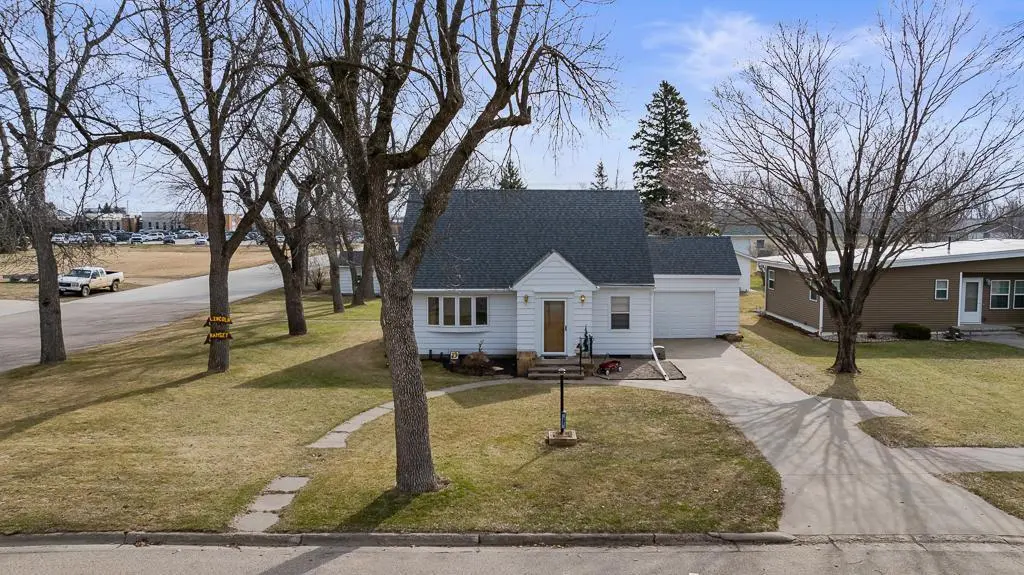
301 S Oak St · Hendricks, MN
Flood risk 1/10 · Minimal
- FEMA flood zone
- X (unshaded)
- Chance of flooding over 30 yrs
- 0.0%
- Est. flood insurance / yr
- $473 – $860
Fire risk 2/10 · Minimal
- Est. fire insurance / yr
- $888 – $1,650
Heat risk 1/10 · Minimal
- Hot days now (above 96°F)
- 7 days/yr
- Hot days in 30 yrs
- 14 days/yr
Wind risk 2/10 · Minimal
- Chance of severe wind over 30 yrs
- —
Air-quality risk 2/10 · Minimal
- Unhealthy air days now
- 1 days/yr
- Unhealthy air days in 30 yrs
- 1 days/yr
Risk factors via First Street. Map © Google.
Why this score? — see what drove the D grade
The composite is a weighted blend of 9 inputs, each scored 0–100. Each bar is that input's sub-score; the figure is the points it added to the 100-point composite (weight × sub-score).
- Appreciation +8.4/10.0
- Cash flow +8.0/30.0
- ARV discount +7.5/15.0
- Schools +5.2/10.0
- Livability +3.8/5.0
- Rent growth +2.5/5.0
- Condition / age +2.5/5.0
- DSCR +2.0/10.0
- 1% rule +1.8/10.0
$175,000
🖨 Deal sheet (PDF) 📄 Offer letter ✓ Due diligence
Listing remarks
Welcome to this charming and well-updated home in the heart of Hendricks! Situated on a spacious corner lot just blocks from the school, hospital, and downtown, this property offers both convenience and comfortable living. The main level features a functional and inviting layout, including a bright & spacious living room, formal dining room, kitchen, main floor bedroom, and main floor 1/2 bathroom. You’ll also love the bright and sunny back porch, complete with main floor laundry and direct access to a brand-new concrete patio. .. perfect for relaxing evenings, entertaining guests, or keeping an eye on outdoor activities in the generous backyard. Upstairs, you’ll find two
Key facts
- Finished bonus room
- Updated kitchen
- Bright back porch
Tags
Property features AI
Exterior
- Parking: Attached garage with storage and garage door opener; Concrete driveway; Electric in garage; 1-car garage (approximately 14' x 20')
- Utilities: City water connected; City sewer connected; Natural gas; 200+ amp electrical service with circuit breakers
- Home design: Residential property; One and one-half stories; Main floor primary bedroom
- Construction: Frame construction; Block foundation; Full basement
- Exterior features: Rear patio and porch; Wood exterior; Corner lot; Storage shed; 86 x 140 lot dimensions; City street with paved frontage; Publicly maintained road
Interior
- Kitchen: Range; Microwave; Dishwasher; Refrigerator; Stainless steel appliances
- Bedrooms: 3 bedrooms (main floor primary bedroom; other bedrooms on upper level)
- Flooring: Hardwood floors
- Bathrooms: One full bathroom on upper level; One half bathroom on main floor
- Heating & cooling: Forced air heating; Central air conditioning
- Interior features: Ceiling fans; Hardwood floors; Kitchen window; Main floor primary bedroom; Patio; Porch; Washer/dryer hookup; Water softener (owned); Partially finished basement with storage space; Separate/formal dining room
- Laundry & utility: Main level laundry room; Washer and dryer included; Electric water heater
Neighborhood map
What this means for you Summary
Snapshot
- This is a 3-bed/2.0-bath single-family listed at $175k.
Deal economics
- At list price, monthly cash flow is $-180 ($-2k/yr) — negative.
- To cash-flow at today's rent, offer at most $143k (18.2% below list).
- To meet the 1% rule (rent ≥ 1% of price), the offer needs to be $119k (32.2% below list).
- Recommended offer: $119k (32.2% below list) — sets the bar for 1% rule.
Location & tenants
- Location reads 76/100 on livability (#151 in MN, #3,376 nationally) — a middle-class / working-renter tenant base. Strengths: cost of living A+, housing A+, health & safety A+; Watch: crime D, employment D, commute F.
- Hendricks Public School District (rural): math 50% / reading 70% proficiency, ranked #153 of 467 in MN (top 33%) — acceptable for families but not a draw, mixed tenant base, ~2y average lease.
- Zoned schools: Hendricks Elementary (math 54% / reading 54%, grade C, #320 of 857 statewide, top 41%, 98 students, 50% FRL); Hendricks Senior High (math 75% / reading 75%, grade A-, #6 of 471 statewide, top 2%, 47 students, 51% FRL) — zoned schools average 51% FRL vs 34% district-wide (17 pts higher); higher-poverty schools than district average — tighter screening recommended.
- Market conditions: 10 active listings in the ZIP; 13 units permitted in Lincoln County in 2024 (0 in 5+ unit buildings).
Forward outlook
- In year one you build about $13k of equity ($1k loan paydown + $12k appreciation (6.8% local appreciation)).
- Lincoln County population projected at -18% by 2050 — secular population decline; favor cash flow + early exit over multi-decade hold.
- By year 3, paydown + projected appreciation supports a ~$33k cash-out refi (75% LTV) — recoverable capital for the next deal without selling this one.
Negotiation context
- It's been on market 21 days — a 2% lower offer ($172k) is reasonable based on typical stale-listing flexibility.
- Current owner paid $124k; 41% above their basis — modest negotiation headroom, anchor on the comps not their cost.
Risks & watch-outs
- Watch-outs: built in 1949 — expect roof / HVAC / electrical / plumbing capex.
Questions for the listing agent
- What do current leases actually rent for vs. the listed asking? Can we see a recent rent roll and the last 12 months of T-12 income?
- Built in 1949 — when were the roof, HVAC, electrical panel, plumbing, and water heater last replaced?
- Is there a deadline driving the sale (1031 exchange, divorce, estate, relocation)? That informs how much negotiation room exists.
- Schools are B-rated — typically a magnet for longer-tenancy family renters. What's the average tenant stay here, and is there a school-zone premium baked into asking?
- Crime grade is D in this area — have there been break-ins, vandalism, or insurance claims at this property in the last 3 years? What carrier currently insures it and at what premium?
- The area grade is low — what's the realistic commute time and amenity access for the typical tenant pool here? Any planned neighborhood developments (good or bad) we should know about?
- What's the average days-on-market for RENTAL listings here right now (not sales)? A rising rental-DOM trend means longer vacancies and softer asking-rent achievability than the comps imply.
- What's the recent tenant-quality profile in this submarket — average credit score on applications, eviction rate, late-payment / NSF rate, and stable-employment percentage? A property-management company in the area should have these aggregated.
- How much new for-sale + rental construction is in the pipeline within 1–3 miles? Heavy new supply typically softens prices + rents 12–24 months out; constrained supply supports both.
Investment metrics
- 1% rule
- 0.68% ✗
- Cap rate
- 5.06%
- Cash-on-cash
- -4.40%
- DSCR
- 0.80
- GRM
- 12.3
CMA / ARV
No comps found within radius.
Projected returns pro-forma
6.82% appreciation · 3.0% rent growth · sell at horizon
- IRR
- 13.8%
- Equity multiple
- 1.97×
- Total profit
- $47,666
- Equity at exit
- $119,194
- IRR
- 14.0%
- Equity multiple
- 4.01×
- Total profit
- $147,259
- Equity at exit
- $224,560
Cash invested: $49,000 (down + closing). Projections, not guarantees.
Landlord ↔ Tenant lean methodology
- Overall (STATE)
- 46 Balanced
- State Minnesota
- 46 Balanced · D+2
- County
- — inherits STATE
- City
- — inherits STATE
ZIP-level market 56136
- Home prices YoY
- 3.3%
- Active inventory
- 10
- Price-to-rent
- 12.3×
Monthly cashflow live
- Estimated rent
- $1,187 medium interval (Pro) →
- Mortgage (P&I)
- −$918
- Tax from tax record
- −$127 /mo · $1,526/yr
- Insurance
- −$73
- HOA
- −$0
- Vacancy / Maint / Mgmt
- −$249
- Net cashflow
- $-180
Break-even live
Sensitivity live
| Price | -10% $-81 | -5% $-130 | +0% $-180 | +5% $-229 | +10% $-279 |
|---|---|---|---|---|---|
| Rent | -10% $-274 | -5% $-227 | +0% $-180 | +5% $-133 | +10% $-86 |
| Rate | -1.0pp $-92 | -0.5pp $-135 | base $-180 | +0.5pp $-225 | +1.0pp $-271 |
UW: 25.0% down · 7.5% · 30yr · 1.5% tax · 5.0% vac · 8.0% maint · 8.0% mgmt
Financing live
Cash to close
- Down payment
- $43,750
- Closing costs
- $5,250
- Reserves months
- —
- Total cash needed
- —
Loan-product check · same deal, 3 products live
Conventional
25% down · 7.5% · 30yr
- Down + closing
- —
- Monthly P&I
- —
- Monthly cashflow
- —
- DSCR
- —
- Eligible?
- —
Personal DTI + credit; lowest rate.
DSCR
20% down · 8.5% · 30yr
- Down + closing
- —
- Monthly P&I
- —
- Monthly cashflow
- —
- DSCR
- —
- Eligible?
- —
No personal income docs; deal must DSCR.
Hard money
10% down · 12.0% · 12mo
- Down + closing
- —
- Monthly P&I
- —
- Monthly cashflow
- —
- DSCR
- —
- Eligible?
- —
Short-term bridge; refi at stabilization.
Listing history 4 events
-
2026-05-01status Pending
-
2026-04-25historical Contingent - Inspection
-
2026-04-10$175,000 Active
-
2024-06-14soldstatus $123,700
ⓘ Source: listings_history table (triggers on properties + properties_extension) + one-shot
backfill from property_details.listing_events for pre-trigger history.
Tax reassessment forecast MN · Partial reset (capped growth)
- Current annual tax
- $1,526 · $127/mo
- Projected year-2 tax
- $1,743 · $145/mo
- Expected delta
- +$217/yr (+$18/mo · 14.2%)
ⓘ Screening estimate from a state-policy table — verify with the county assessor before closing.
Climate risk First Street
- Flood 1/10 Low FEMA zone X (unshaded) · 0% chance over 30 yrs
- Wildfire 2/10 Low
- Heat 1/10 Low 7 d/yr ≥96°F today · 14 d/yr by 30 yrs out
- Wind 2/10 Low
- Air quality 2/10 Low 1 unhealthy d/yr today · 1 by 30 yrs out
Nearby sold comps map
Loading sold comps map…
Walkable amenities ~0.75 mi
Loading nearby amenities…
Taxation est. · year 1
- Rental income
- $14,248
- − Mortgage interest
- −$9,803
- − Property taxes
- −$1,526
- − Insurance
- −$875
- − Repairs & maintenance
- −$1,140
- − Management
- −$1,140
- − Depreciation
- −$5,091
- Taxable loss
- −$5,327
- Est. tax savings @ 24.0%
- +$1,278
- After-tax cash flow
- $-880/yr
For passive investors: Depreciation is non-cash, so a rental often shows a tax loss while cash-flowing — sheltering income. Rental losses are passive: they offset passive income freely, and up to $25,000/yr can offset ordinary (W-2) income if you actively participate and your MAGI is under $100k (phasing out to $0 by $150k); unused losses carry forward. On sale, claimed depreciation is recaptured at up to 25%, and gains may owe capital-gains tax (a 1031 exchange can defer both). Figures are a year-1 estimate at your 24.0% rate — not tax advice; consult a CPA.
Schools (NCES district)
- District
- Hendricks Public School District
- NCES district ID
- 2713680
- Math proficiency
- 50% ▬ 0.00%
- Reading proficiency
- 70% ▲ 10.00%
- Median HH income
- $45,562
- Composite
- 52.23/100
- National rank
- #3466
- State rank
- #153 of 467 in MN
Livability — Hendricks
- Score
- 76/100
- State rank
- #151
- US rank
- #3376
Category grades
Schools grade is shown separately in the Schools card above.
Census & demographics
- Census place
- Hendricks, MN
- Population (ZIP)
- 1,231
Population outlook (Lincoln County) Hauer SSP2
- Today (2025)
- 5,433 people
- By 2030
- 5,215 · -4.0%
- By 2040
- 4,828 · -11.1%
- By 2050
- 4,445 · -18.2%
- By 2075
- 3,678 · -32.3%
- By 2100
- 2,762 · -49.2%
Race, ethnicity, and origin ACS 2023
- Neighborhood character
- Predominantly White (94%)
- Race & ethnicity
- White 94% Two or more races 3% Hispanic / Latino 2%
- Common ancestry
- Portuguese 25% Romanian 6% Iranian 5%
- Foreign-born
- 2% · Canada, China
- Languages at home
- 97% English-only · Spanish 2% Chinese 1%
Political lean MEDSL · Lincoln
- 2024 margin
- Solid R (+37.8) · D 30.1% · R 67.9% · Other 2.0%
- 2008→2024 swing
- -38.6pp toward R · 2008: 0.8pp · 2024: -37.8pp
- All cycles
- 2024: R+37.8 2020: R+38.0 2016: R+35.6 2012: R+5.3 2008: D+0.8
Not yet ingested
- Civics
- —
Market trends
- HPI YoY
- ▲ 6.82%
- Current HPI
- 214.4647
- Rent YoY
- —
- Metro
- —
- State GDP YoY
- ▲ 2.41%
- F500 in state
- 34
Industry mix (Fortune 500 HQ in MN)
| Industry | F500 HQs | Revenue |
|---|---|---|
| Healthcare | 2 | $407B |
|
||
| Retail | 2 | $150B |
|
||
| Consumer Goods | 2 | $32B |
|
||
| Industrial Machinery | 2 | $6B |
|
||
| Agriculture | 1 | $40B |
|
||
| Healthcare / Medical Devices | 1 | $32B |
|
||
Price history
+41.5% since first listed4 events — show timeline
- 2026-05-01 Pending — NORTHSTARMLS as Distributed by MLS Grid
- 2026-04-25 Contingent — NORTHSTARMLS as Distributed by MLS Grid
- 2026-04-10 Listed $175,000 NORTHSTARMLS as Distributed by MLS Grid
- 2024-06-14 Sold (Public Records) $123,700 Public Records
Property tax history
+4.7%/yrLatest (2026): $1,526 · +5.0% YoY. Source: county tax records.
Cash-flow waterfall
monthlySold comps — $/sqft
last 12 mo · ≤1 miLoading sold comps…